BAJAJ HOUSING FINANCE LTD GOOD TIME TO PICK IT Bajaj Housing Finance Ltd. (BHFL) is a prominent non-banking financial company (NBFC) in India, specializing in housing-related finance. It's a subsidiary of Bajaj Finance Ltd., and has been classified as an Upper-Layer NBFC by the RBI under its Scale-Based Regulations.
📊 Latest Financial Highlights (Q1 FY26 Preview)
- Assets Under Management (AUM): 1.2 lakh crore, up 24% YoY and 5% QoQ
- Loan Assets: 1.05 lakh crore, up 24.2% YoY
- Disbursements: 14,640 crore, up 22% YoY
- Net Profit (PAT): Expected to rise 19–21% YoY to 574–584 crore
- Net Interest Income (NII): Estimated to grow 24–28% YoY to 827–851 crore
- Net Interest Margin (NIM): Projected at ~3.2%, slightly compressed due to rate cuts
The company is well-positioned to benefit from the rising demand for housing loans, as more people seek to buy homes. With a focus on technology and customer service, BHFL is likely to enhance its operational efficiency, attracting more clients and growing its market share. As a result, the stock price of BHFL could rise, with steady growth by its expanding loan portfolio and strong brand recognition. In 2026, its share price target would be 253, as per our analysis.
SHORT TERM VIEW
entry - 119.50-123
stop loss - 117.60
target - 135-140
Bajaj


Bajaj Hindusthan Sugar LtdBajaj Hindustan (Ethanol/Sugar Company)
if it sustain above 23 then I'm bullish in this for 1000% gain.
It'll going to give 13 years breakout.
Keep an eye on this.
NOTE: We are not SEBI registered. It's for knowledge purpose only. Consult to your financial adviser before take any trade.
MAY 27 , 2024
Note
entry trigged add half and more on weekly candle close above 23

Bajaj Elec Buy trendDown trend changed to buy now 731 target for now.
on 5th earnings announcement there so may be it will touch on that date probably

BAJAJ AUTO Shortterm VIEW BEARISHAfter a good run from Rs.4,000 (in APRIL 2023) Stock has doubled and more to Rs.10,000.
Along the journey We have seen small consolidations at Rs.8,500-9,300 and stock reached Rs.10k After that we have seen a small dip towards 8,800.
Now its forming a HNS Pattern in Weekly TF.
I expect a Downside correction to 7,000-7,300 Zone.
I also believe Automobile Sector will go through some consolidation.

BAJAJ HOLDING & INVES LTDPrice taking support at 3h chart
10900 is acting as a CIP level and price is on the verge of breakout
30% targets can be achived if it breaksout..Daily closing below 10900 wil be the immidiate stoploss

Bajaj Finserv 2 Nov 24 Inv H&S HourlyBajaj Finserv
2 Nov 24 Inv H&S Hourly Potential Opportunity
On lower time frame it looks good with decent r:R of 1:3
Bit cautious on the higher time frame until further price unfolds
Entry 1777
T1 1825

Bajaj Finance D-W-M-Q StatusBF is trading @6900 range , a complete setup shows that soon we can see blast in this stock .
i have shared 4 screen for better understanding and trend lines . with that EMA , SMA, RSI, Volume

Bajaj Finserv Ltd. - Weekly Chart Analysis1. Symmetrical Triangle Pattern:
Bajaj Finserv has been consolidating within a symmetrical triangle pattern over the past few years, showing lower highs and higher lows.
This pattern suggests a period of accumulation or consolidation, where both buyers and sellers are competing, leading to a breakout or breakdown.
2. Recent Breakout and Pullback:
The price recently broke above the upper boundary of the triangle, indicating a bullish breakout, which was accompanied by significant buying volume.
Currently, the price is retesting the breakout level, which may act as a support zone if it holds.
3. Fibonacci Levels and Potential Resistance Zones:
The previous high near INR 1,880 (approx.) acts as a critical resistance zone. This level also aligns with the 88.18% Fibonacci retracement level, which may serve as a potential profit-booking zone if the stock moves upward again.
If the stock maintains its momentum post-retest, a move toward this resistance could be expected.
4. Volume Profile Analysis:
The Volume Profile on the right shows strong support around the INR 1,500-1,600 levels, indicating that a significant volume of shares has been traded within this range.
This level may act as a support if the price dips further from the current pullback.
5. Trendline Support and Moving Averages:
The long-term upward trendline provides a strong dynamic support level.
The 50-week and 200-week moving averages are positioned below the price, indicating a long-term uptrend and offering additional support around INR 1,500.
6. RSI and Momentum Indicators:
The Relative Strength Index (RSI) shows a healthy range but is not overbought, suggesting there is room for further upward movement.
A crossover in the RSI or any divergence may indicate potential reversals, so keeping an eye on these indicators would be beneficial.
7. Key Levels to Watch:
Support: INR 1,500-1,600 (Volume Profile and Moving Average Support), INR 1,730 (current retest level).
Resistance: INR 1,880 (previous high and Fibonacci level).
Conclusion: The stock is at a critical juncture, currently retesting the breakout level of the symmetrical triangle. If the price sustains above INR 1,730, we could see a bullish continuation toward INR 1,880. However, a breakdown below the trendline or INR 1,500 could invalidate the bullish outlook, potentially leading to further downside.

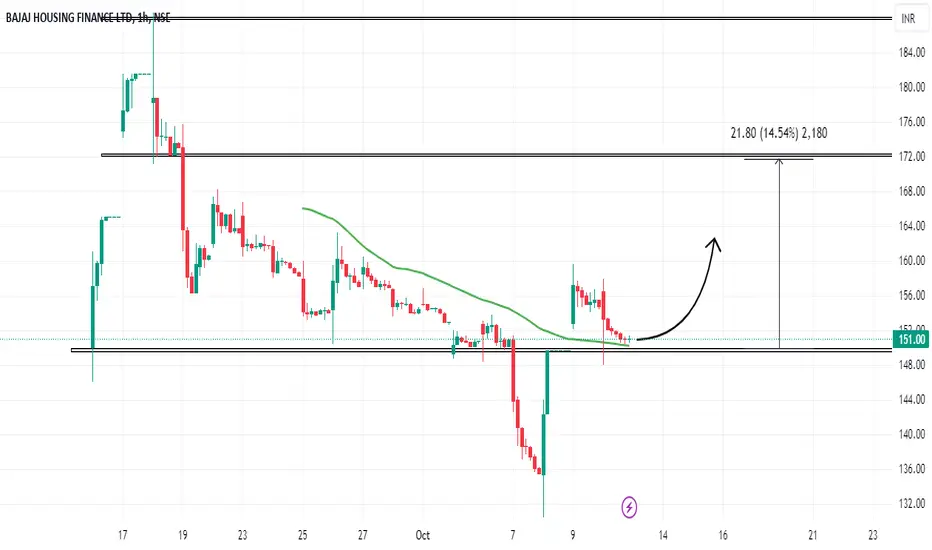
Bajaj Housing Finance : Next Steps Forwardbajaj housing finance is currently at the support area of 150 and is also supported by a 50-hour moving average. This indicates a potential upward movement from this level.
BAJAJ HOUSING FINANCE INTRADAY RANGECurrently, BAJAJ HOUSING FINANCE is trading within a specific price range as indicated above. It is advisable to wait for a significant price movement either above the upper limit (breakout) or below the lower limit (breakdown) of this range before considering further trades. It's worth noting that since BAJAJ HOUSING FINANCE was listed just 2 days ago, there is limited historical data available for conducting a comprehensive technical analysis.

BAJAJ FINSERV TRIANGLE PATTERN As we can see, BAJAJ FINSERV was forming a symmetrical triangle pattern on a weekly time frame and has currently broken out of it. We can consider a buy on pullback at around 1835.

BAJAJ FINSERV LONGBAJAJ FINSERV as seen in the chart above is forming a ascending triangle pattern. Consider it for educational purpose and look for target and SL accordingly.

Bajaj Finance - Hidden Gem?Bajaj Finance is a company of the prestigious Bajaj group. It is the largest NBFC company of India. It has the lowest NPA among NBFC companies as the largest customer of the company is Bajaj Auto which is another group company of Bajaj Group. The company is continuously increasing its market share and onboarding new customers.
The P/E ratio of the company is at 27.33 which is very less than the 20 year median P/E of 45.6.
The company is constantly increasing its quarterly and yearly revenue and net profit.
The company has significantly decreased its Net NPA from 1.46% in June 2021 to 0.38% in June 2024 which shows the good performance of the company.
The ROE is 22.12% which is considered excellent for NBFC segment stocks.
Regardless of such extraordinary performance and financials the company is trading at the same levels at which it was trading 3 years ago. It is a golden opportunity to invest in this stock at this point of time for long term as it may go 3-4 times up from this level.
I am not a SEBI registered analyst.
Please do your own analysis before investing.
Do like and follow and share among your friends and family.
Thank you.

Bajaj Holdings & Investment Ltd (ticker: BAJAJHLDG) ForecastThe chart provided is a daily candlestick chart for Bajaj Holdings & Investment Ltd (ticker: BAJAJHLDG) on the National Stock Exchange (NSE). Here's a detailed analysis and summary of the chart:
Timeframe and Data:
- Timeframe: Daily
- Data Range: From mid-2023 to mid-2024
Price Analysis:
- Current Price: ₹8,031.95
- Price Movement: The stock has experienced a gradual upward trend with periodic corrections.
- The price reached a peak near ₹10,000 in early 2024 and has since been consolidating in a symmetrical triangle pattern.
Technical Patterns and Indicators:
- Symmetrical Triangle: The stock is forming a symmetrical triangle pattern, characterized by converging trendlines.
- Upper Trendline Resistance: Formed by lower highs since early 2024.
- Lower Trendline Support: Formed by higher lows since mid-2023.
- This pattern often precedes a breakout in either direction.
Key Levels and Future Projections:
- Resistance Levels (Take Profit Targets):
- BUY TP1: ₹9,400.00
- BUY TP2: ₹10,400.00
- BUY TP3: ₹12,100.00
- Support Levels:
- Immediate Support: Around the lower trendline of the symmetrical triangle.
- Further Support: If the price breaks below the lower trendline, previous support levels around ₹7,600 to ₹7,800 could be tested.
Trade Setup:
- Bullish Scenario: If the price breaks above the upper trendline of the symmetrical triangle and sustains above this level, it could potentially move towards the identified resistance levels (TP1, TP2, and TP3). This would confirm a bullish breakout from the symmetrical triangle pattern.
- Bearish Scenario: If the price fails to break above the upper trendline and instead breaks below the lower trendline, it could indicate a potential downside move towards the next support levels.
Conclusion:
The chart for Bajaj Holdings & Investment Ltd shows the stock in a consolidation phase within a symmetrical triangle pattern following a significant upward trend. Key levels to watch include the upper trendline resistance and the lower trendline support. A breakout above the upper trendline could signal a bullish move towards ₹9,400, ₹10,400, and ₹12,100. Conversely, a breakdown below the lower trendline could suggest potential further downside. Traders should look for a confirmed breakout in either direction to make informed trading decisions.

#BajFinance has been consolidating in this channel since Sep’21#BajFinance has been consolidating in this channel since Sep’21
IF and when this breaks, it will be a decisive move and can set the trend for next few months.
Mark these levels on your chart so that you do not miss the breakout!


BAJAJ AUTOBelow are some support and resistance levels for BAJAJ AUTO stock. Currently, it is moving within a range.

BAJAJFINSVThere is a possibility of BAJAJ FINSV breaking down as it is currently trading at its support area. Please trade accordingly using the provided levels.

Is Bajaj Auto Going to crash ?Bajaj Auto is At All Time High !!
Stock is in a Rising Channel and Prices are around the resistance
Resistance level is around 8500-8600
Previously we can observe that prices showed correction around 40% from the Resistance of the Channel
So can we expect the same fall ??
Lets see !!
WE ARE ATLEAST NOT BULLISH AT THIS TIME !!

Bajaj Finance Flat CorrectionBajaj FInance is in a long term flat correction which started from late 2021 & it can continue for few more months.
It loks like in Wave C where it can make a 5 wave fall. Minimum target should be 6443 of this pattern but seeing the impulsive wave it shouldn't stop here & we can see straight fall to 5800 levels then later on 5200-5300 levels. This pattern can go in till April May 2024
As per Ichimoku too it has broken weekly cloud & next monthly cloud support appears near 5900 levels
Buying otm puts for march or April is not a bad option right now.. Risk reward is good with small risk & can hedge this trade too if you want

Bajaj Finance - Next move?Bajaj Finance is a company of the prestigious Bajaj group and it currently trading at a PE value of 33.7 which is way below its Median PE of 46.9. It has a good profit growth of 35.8% CAGR over the last 5 years and it has increased its profits by approximately 11 times in the last 7 years. The stock should be held till around next March for good returns.
This analysis is just for educational purpose.
Please do your own retrospective study before investing.

Bajaj Finance Analysis 9-3-203 Buy over 6185 closing for 7500
Bajaj Finance Weekly Analysis 9-3-203 Buy over 6185 closing for 7500
sl on prv weekly lower break
