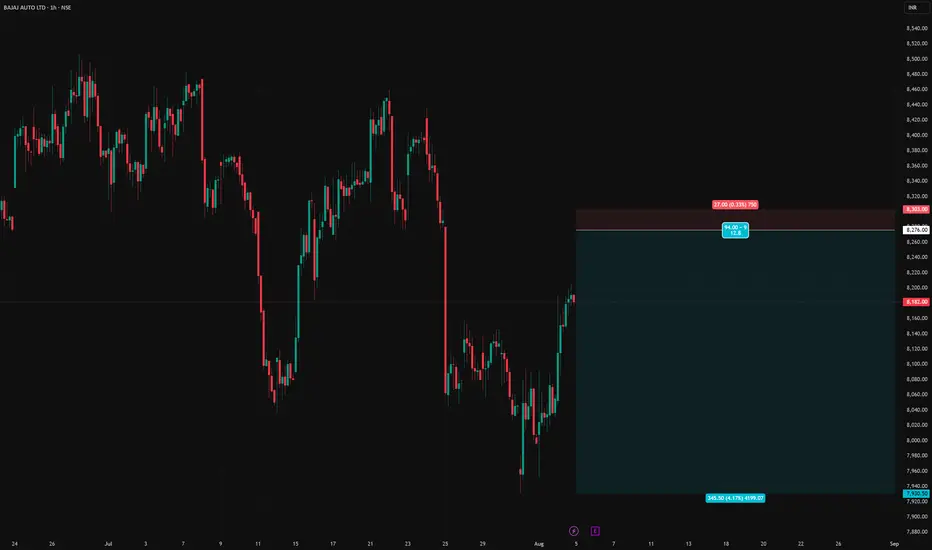
BAJAJ-AUTO short setupBAJAJ-AUTO short setup
Entry price - 8276
Stop Loss - 8303
Target - 7391
Risk Reward - 1:12.8 (Approx 1:13)
Bajajautotrade
BAJAJ AUTO LTD - NSE (BAJAJ-AUTO) ForecastThe stock chart for BAJAJ AUTO LTD - NSE (BAJAJ-AUTO) reveals interesting patterns and potential trading strategies:
1. Symmetrical Triangle Pattern:
- The chart displays a symmetrical triangle formed by converging trend lines.
- This pattern suggests a continuation of the existing trend.
- Traders should wait for a breakout from this triangle before making any moves.
2. Trading Strategies:
- Long Position:
- Consider buying if the price moves above a certain level.
- Target price for a long position: 3900.
- Short Position:
- Sell short if the price falls below a specific level.
- Target price for a short position: 3500.
3. Current Price:
- BAJAJ AUTO LTD is currently trading at 8948.20.
Remember, this analysis is based on technical patterns, and actual market behavior may vary. Always use additional indicators and risk management techniques when trading stocks.

BAJAJ AUTOBajaj auto forming a double bottom and ready to breakout above the trendline as well.
Good to go in this stock for target of previous high (4300 levels).
Trade safe. Manage risk. Be profitable.
Please follow us for more simple trading analysis and setups. Also let me know in the comment in case you have any queries.
Disclaimer :- This is just my view. Please analyze charts yourself and then decide to take any trades.


Buy Bajaj Auto Target 🎯 4200Buy Bajaj Auto Target 🎯 4200 because it is recently trading at its support and I have given target of major Resistance.

Bajaj Auto at SupportBajaj Auto, the trend is good on the monthly timeframe and its weekly price action is suggesting that it trying to form a short-term bottom.
And there is a support zone 3790-3743 that confirms the said price action, now if this support zone holds price might move towards the upper range.

BAJAJ AUTO LOOKING GOOD NEAR 3500 - 3550 IF HOLD 3400 LEVELINTRADAY AND POSITIOAL VIEW SPOT LEVLS
BAJAJ AUTO LOOKING GOOD NEAR 3500 - 3550
IF HOLD 3400 LEVEL THEN POSSIBLE GOOD UPSIDE MOVE IN COMING DAYS
TRADING AND EDUCATION - POSITIONAL BET

BAJAJ AUTO - NEAR IMP SUPPORT LEVELSBajaj Auto has reached imp support levels, if held we might see a good bounce in the stock.
Harmonic Support, Price action support, and 200-day moving average support all converge near the 3300 levels.

BAJAJ AUTO - Flag Pattern TradeThe stock saw a good up move of approx 500 points i.e from 3450 levels to 3966 levels.
From the Past 8 Trading sessions stock has been moving in a range of approx 200 points.
Now there are two types of trades, that can take place
Support Trade :
Pros - good risk-reward ratio 😀
Cons - might get stuck in sideways move for a while, i.e it can test your patience.😌
Breakout Trade:
Pros: Immediate fast move.😍 i.e means immediate return, no patience-testing.
Cons: Low-risk reward ratio, fakeout can happen🤨

