BAKEUSDT 1W AnalysisBAKE ~ 1W Analysis
#BAKE Buy back gradually from here with a short term target of at least 20%+ from this support.
Bakeusdt

BAKEUSDT 1WBAKE ~ 1W Analysis
#BAKE Buy gradually from here if you still have a Conviction on this coin with a short -term target of at least 20%+.

BAKEUSDT 1WBAKE ~ 1W Analysis
#BAKE Buy gradually from here if you still have a Conviction on this coin with a short -term target of at least 20%+.

BAKEUSDT – Red Boxes Are Strong Resistance Zones!The red boxes on BAKEUSDT represent significant resistance zones where we can expect considerable selling pressure. These levels have shown their strength in the past, and it's crucial to approach them with caution.
🔴 Key Insights:
Strong Resistance: The red boxes are key resistance areas with high potential for price rejection. Sellers are likely to be active here, so don’t rush.
Patience is Key: Always wait for lower time frame (LTF) breakouts with CDV and volume profile confirmation before making any decisions.
Avoid Blind Entries: Trading these zones blindly can be risky. Let the market show you its intention, and only trade with confirmation.
💡 Smart Approach:
Wait for a clear signal before making a move. If the market doesn’t break and retest these red zones with volume, there’s no reason to take unnecessary risks. Your entry should always be backed by proper data and analysis. Patience + Smart Entries = Successful Trades.
I keep my charts clean and simple because I believe clarity leads to better decisions.
My approach is built on years of experience and a solid track record. I don’t claim to know it all, but I’m confident in my ability to spot high-probability setups.
If you would like to learn how to use the heatmap, cumulative volume delta and volume footprint techniques that I use below to determine very accurate demand regions, you can send me a private message. I help anyone who wants it completely free of charge.
I have a long list of my proven technique below:
🎯 ZENUSDT.P: Patience & Profitability | %230 Reaction from the Sniper Entry
🐶 DOGEUSDT.P: Next Move
🎨 RENDERUSDT.P: Opportunity of the Month
💎 ETHUSDT.P: Where to Retrace
🟢 BNBUSDT.P: Potential Surge
📊 BTC Dominance: Reaction Zone
🌊 WAVESUSDT.P: Demand Zone Potential
🟣 UNIUSDT.P: Long-Term Trade
🔵 XRPUSDT.P: Entry Zones
🔗 LINKUSDT.P: Follow The River
📈 BTCUSDT.P: Two Key Demand Zones
🟩 POLUSDT: Bullish Momentum
🌟 PENDLEUSDT.P: Where Opportunity Meets Precision
🔥 BTCUSDT.P: Liquidation of Highly Leveraged Longs
🌊 SOLUSDT.P: SOL's Dip - Your Opportunity
🐸 1000PEPEUSDT.P: Prime Bounce Zone Unlocked
🚀 ETHUSDT.P: Set to Explode - Don't Miss This Game Changer
🤖 IQUSDT: Smart Plan
⚡️ PONDUSDT: A Trade Not Taken Is Better Than a Losing One
💼 STMXUSDT: 2 Buying Areas
🐢 TURBOUSDT: Buy Zones and Buyer Presence
🌍 ICPUSDT.P: Massive Upside Potential | Check the Trade Update For Seeing Results
🟠 IDEXUSDT: Spot Buy Area | %26 Profit if You Trade with MSB
📌 USUALUSDT: Buyers Are Active + %70 Profit in Total
🌟 FORTHUSDT: Sniper Entry +%26 Reaction
🐳 QKCUSDT: Sniper Entry +%57 Reaction
📊 BTC.D: Retest of Key Area Highly Likely
I stopped adding to the list because it's kinda tiring to add 5-10 charts in every move but you can check my profile and see that it goes on..
A tiny part of my runners;
🌊 WAVESUSDT.P: Demand Zone Potential
🟣 UNIUSDT.P: Long-Term Trade
🔵 XRPUSDT.P: Entry Zones
🔗 LINKUSDT.P: Follow The River
📈 BTCUSDT.P: Two Key Demand Zones
A tiny part of my runners;
💼 STMXUSDT: 2 Buying Areas
🐢 TURBOUSDT: Buy Zones and Buyer Presence
🌍 ICPUSDT.P: Massive Upside Potential | Check the Trade Update For Seeing Results
🟠 IDEXUSDT: Spot Buy Area | %26 Profit if You Trade with MSB
📌 USUALUSDT: Buyers Are Active + %70 Profit in Total
🌟 FORTHUSDT: Sniper Entry +%26 Reaction
🐳 QKCUSDT: Sniper Entry +%57 Reaction
j
📌I keep my charts clean and simple because I believe clarity leads to better decisions.
📌My approach is built on years of experience and a solid track record. I don’t claim to know it all but I’m confident in my ability to spot high-probability setups.
📌If you would like to learn how to use the heatmap, cumulative volume delta and volume footprint techniques that I use below to determine very accurate demand regions, you can send me a private message. I help anyone who wants it completely free of charge.
🔑I have a long list of my proven technique below:
🎯 ZENUSDT.P: Patience & Profitability | %230 Reaction from the Sniper Entry
🐶 DOGEUSDT.P: Next Move
🎨 RENDERUSDT.P: Opportunity of the Month
💎 ETHUSDT.P: Where to Retrace
🟢 BNBUSDT.P: Potential Surge
📊 BTC Dominance: Reaction Zone
🌊 WAVESUSDT.P: Demand Zone Potential
🟣 UNIUSDT.P: Long-Term Trade
🔵 XRPUSDT.P: Entry Zones
🔗 LINKUSDT.P: Follow The River
📈 BTCUSDT.P: Two Key Demand Zones
🟩 POLUSDT: Bullish Momentum
🌟 PENDLEUSDT.P: Where Opportunity Meets Precision
🔥 BTCUSDT.P: Liquidation of Highly Leveraged Longs
🌊 SOLUSDT.P: SOL's Dip - Your Opportunity
🐸 1000PEPEUSDT.P: Prime Bounce Zone Unlocked
🚀 ETHUSDT.P: Set to Explode - Don't Miss This Game Changer
🤖 IQUSDT: Smart Plan
⚡️ PONDUSDT: A Trade Not Taken Is Better Than a Losing One
💼 STMXUSDT: 2 Buying Areas
🐢 TURBOUSDT: Buy Zones and Buyer Presence
🌍 ICPUSDT.P: Massive Upside Potential | Check the Trade Update For Seeing Results
🟠 IDEXUSDT: Spot Buy Area | %26 Profit if You Trade with MSB
📌 USUALUSDT: Buyers Are Active + %70 Profit in Total
🌟 FORTHUSDT: Sniper Entry +%26 Reaction
🐳 QKCUSDT: Sniper Entry +%57 Reaction
📊 BTC.D: Retest of Key Area Highly Likely
📊 XNOUSDT %80 Reaction with a Simple Blue Box!
📊 BELUSDT Amazing %120 Reaction!
I stopped adding to the list because it's kinda tiring to add 5-10 charts in every move but you can check my profile and see that it goes on..

Bakeusdt Buy Opportunity Entered DCA leverage long from here cause i see a good buy opportunity from here though its very risky.
RR is good if this holds and Bounce.
Expecting a strong and fast bounce if holds.
entered under 0.1400
will scale out if holds under 0.1385
Targeting 0.1700
Note: Not a Financial Advice

BAKEUSDT 1WBAKE ~ 1W Analysis
#BAKE This is the lowest support for now.
Buy from here if you still have a Conviction on this coin with a short -term target of at least 20%+.

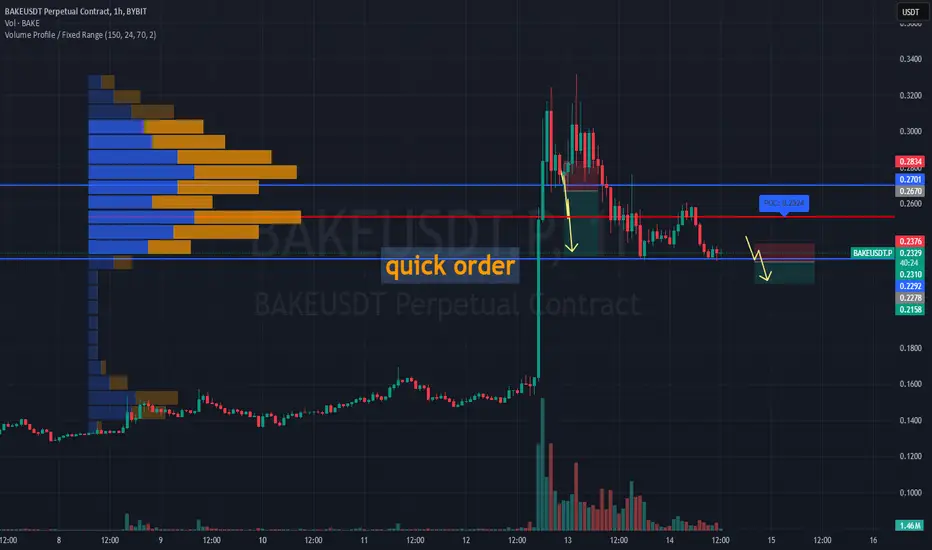
#BAKEUSDT – Quick Trade: Fast Short Opportunity!BYBIT:BAKEUSDT.P is showing weakness after breaking below the $0.2310 zone and consolidating lower. Sellers are in control, price remains below POC $0.2524, and volume confirms bearish pressure.
👉 Key Takeaways:
⚡️ This is a fast trade – no waiting!
The goal is to set the order, take profit, and exit quickly.
⚡️ Fast entry – confirmed breakdown below $0.2278.
⚡️ Tight stop-loss – set at $0.2376 to minimize risk.
⚡️ Quick target – $0.2158, where a bounce may occur.
📉 SHORT BYBIT:BAKEUSDT.P from $0.2278
🛡 Stop Loss: $0.2376
⏱️ 1H Timeframe (Quick Trade!)
✅ Overview:
➡️ BYBIT:BAKEUSDT.P is trading below $0.2310, confirming buyer weakness.
➡️ Downward momentum remains strong, next support is at $0.2158.
➡️ This trade is designed for fast execution and exit at the target level.
⚡️ Plan:
➡️ Act fast – enter and exit without hesitation.
➡️ If price slows down before $0.2158, exit early.
➡️ Don’t chase the price – wait for a clean setup.
📍 Take Profit:
🎯 TP1: $0.2158 – exit zone.
📌 Don't chase – wait for clear execution!
📌 Strategy: Momentum + Quick Profit Target.
🚀 BYBIT:BAKEUSDT.P Breaking Support – Fast Short Opportunity!
HOOKUSDT UPDATEHOOKUSDT is a cryptocurrency trading at $0.2285. Its target price is $0.4000, indicating a potential 120%+ gain. The pattern is a Bullish Falling Wedge, a reversal pattern signaling a trend change. This pattern suggests the downward trend may be ending. A breakout from the wedge could lead to a strong upward move. The Bullish Falling Wedge is a positive signal, indicating a potential price surge. Investors are optimistic about HOOKUSDT's future performance.

BAKEUSDT(BakeryToken) Updated till 12-02-25BAKEUSDT(BakeryToken) Daily timeframe range. we can see a really smooth push from its local low. trying to get through 0.2873 if we can get a confirm close, next 0.4076 needs to be look into. recent support at 0.2072.

#BAKEUSDT shows correction signals📉 SHORT BYBIT:BAKEUSDT.P from $0.2670
🛡 Stop Loss: $0.2834
⏱ 15M Timeframe
✅ Overview:
➡️ BYBIT:BAKEUSDT.P experienced a sharp upward spike, reaching $0.2834, but was followed by a strong decline, indicating profit-taking from major players.
➡️ POC (Point of Control) at $0.2837 shows a high-liquidity area where most trading volume occurred, suggesting a possible resistance zone.
➡️ The $0.2670 level currently acts as short-term support, but a confirmed breakdown could trigger further downside.
➡️ The chart structure signals a potential correction after this steep rally, making short positions at these levels attractive.
⚡ Plan:
➡️ Enter short after confirming a breakdown below $0.2670.
➡️ Risk management through Stop-Loss at $0.2834, placed above the liquidity zone.
Targets:
💎 TP 1: $0.2585
🔥 TP 2: $0.2452
⚡ TP 3: $0.2310
🚀 BYBIT:BAKEUSDT.P shows correction signals — expecting further downside!
📢 BYBIT:BAKEUSDT.P saw a vertical spike, but the lack of strong buying interest at higher levels suggests potential profit-taking.
📢 If $0.2670 breaks downward, we could see continued selling pressure towards $0.2310.
📢 However, a breakout above $0.2834 could change the scenario, so risk management is crucial.

BAKEUSDT 1WBAKE ~ 1W
#BAKE If you still have Conviction on this coin,. This is a very good support block to start buying again., Target at least 20%+

BAKEUSDT: Smart Entry Opportunity – Blue Box Demand Zone!BAKEUSDT is presenting a golden opportunity for traders with the blue box as a well-defined demand zone. This level is the most rational entry point for those seeking high-probability setups.
Why the Blue Box?
Meticulously Selected: The blue box has been carefully identified using volume footprint, volume profile, cumulative delta volume (CDV), and liquidity heatmaps , ensuring it aligns with high-demand regions.
Confirmation Process: I will validate trades in the blue box using CDV, liquidity heatmaps, volume profiles, volume footprints (ensuring buyers are present), and upward market structure breaks in lower time frames . This ensures entry precision and minimizes risk.
Strategic Risk Management: The current market demands calculated moves. The blue box offers the most logical zone for entry, reducing exposure to unnecessary risks.
What’s Next?
Boost your confidence by trading where buyers are likely to act. If the market follows through, this setup could be a game-changer.
Engage & Share:
If you find this analysis valuable, please boost and leave a comment ! Your support motivates me to keep sharing these high-probability trade ideas.
Learn the Process – For Free!
Want to learn how I identify such precise demand zones? DM me to learn how I use CDV, liquidity heatmaps, volume profiles, and volume footprints . I’m happy to help for free – let’s grow together!
If you think this analysis helps you, please don't forget to boost and comment on this. These motivate me to share more insights with you!
I keep my charts clean and simple because I believe clarity leads to better decisions.
My approach is built on years of experience and a solid track record. I don’t claim to know it all, but I’m confident in my ability to spot high-probability setups.
If you would like to learn how to use the heatmap, cumulative volume delta and volume footprint techniques that I use below to determine very accurate demand regions, you can send me a private message. I help anyone who wants it completely free of charge.
My Previous Analysis (the list is long but I think it's kinda good : )
🎯 ZENUSDT.P: Patience & Profitability | %230 Reaction from the Sniper Entry
🐶 DOGEUSDT.P: Next Move
🎨 RENDERUSDT.P: Opportunity of the Month
💎 ETHUSDT.P: Where to Retrace
🟢 BNBUSDT.P: Potential Surge
📊 BTC Dominance: Reaction Zone
🌊 WAVESUSDT.P: Demand Zone Potential
🟣 UNIUSDT.P: Long-Term Trade
🔵 XRPUSDT.P: Entry Zones
🔗 LINKUSDT.P: Follow The River
📈 BTCUSDT.P: Two Key Demand Zones
🟩 POLUSDT: Bullish Momentum
🌟 PENDLEUSDT.P: Where Opportunity Meets Precision
🔥 BTCUSDT.P: Liquidation of Highly Leveraged Longs
🌊 SOLUSDT.P: SOL's Dip - Your Opportunity
🐸 1000PEPEUSDT.P: Prime Bounce Zone Unlocked
🚀 ETHUSDT.P: Set to Explode - Don't Miss This Game Changer
🤖 IQUSDT: Smart Plan
⚡️ PONDUSDT: A Trade Not Taken Is Better Than a Losing One
💼 STMXUSDT: 2 Buying Areas
🐢 TURBOUSDT: Buy Zones and Buyer Presence
🌍 ICPUSDT.P: Massive Upside Potential | Check the Trade Update For Seeing Results
🟠 IDEXUSDT: Spot Buy Area | %26 Profit if You Trade with MSB
📌 USUALUSDT: Buyers Are Active + %70 Profit in Total
🌟 FORTHUSDT: Sniper Entry +%26 Reaction
🐳 QKCUSDT: Sniper Entry +%57 Reaction
📊 BTC.D: Retest of Key Area Highly Likely
I stopped adding to the list because it's kinda tiring to add 5-10 charts in every move but you can check my profile and see that it goes on..

Bake Long ScalpAdded to longs with tight stoploss.
Expecting a strong rejection from the local support area.
Entered 0.3265.
Stoploss clean breaking below the area around 3230.
Note: Not a Financial Advise.

Bake is about to wake up. 1$This is about to reject sooner and go for the highs.
Bake here is on good price(under 0.3) to build Spot position targeting 1$.
Note: Not a Financial Advise.

$ BAKE | How do I expect to see BAKE in coming weeksBINANCE:BAKEUSDT
Here with another speculation about crypto assets. This time Bakery token with BAKE ticker. Let’s take a look at the project’s information:
Bakery swap is one the DEXes that is active on Ethereum, Base and Binance smart chain and covers token swaps, NFT swaps, pools. Tbh, I couldn’t find any advantages for bakery swap over other DEXes. But the technical perspective makes this token interesting.
$ BAKE
Market Cap: $ 114 m
Market Cap Rank: 479
Market Price: 0.396 $
ATH: $ 8 (-95%)
ATL: $ 0.007 (+5435%)
Technical highlights:
- W1:
Trend: (I believe in channels!)
Price has been in a descending channel for most of its crypto life, but things have changed since last week. The day that the price managed to break the upper bond of its descending channel after 3 time rejection. Currently, with one day left until the weekly candle close, the chart is printing 3 white soldiers. Let's keep this as a positive point for possible uptrend continuation and move for the next hints.
Dec 2023 price made a local high and Nov 2024 was the higher low of this trend.
Price bounced several times from $0.21 to $0.26 to prove it as a good support/demand zone. Not to mention that the first higher low in W1 printed by bouncing from that support.
MA: Price holding above MA20 and A50. In the weekly time frame, MA50 at 0.315 can act as support but since it’s never been tested after breaking, so I cannot rely on that just yet. On the other hand, in the daily time frame, MA20, 50, and 200 are located at almost the same price ($0.28 to $0.32). Now this area gets more interesting to me for possible S/R test level.
RSI: The value is around 62 and is strong in the weekly time frame, which supports the trend direction. The RSI value in the daily time frame is 74 and it's in an overbought condition. So, I think there will be a cooldown soon and the above-mentioned level will be the candidate for the pullback.
Stoch RSI: The Stochastic RSI is in the overbought zone, just like the RSI. That's another reason to expect a retracement.
Volume: The volume is not so good and looks weak. That suggests a retrace in my opinion.
In my point of view, channels play an important role in trend direction and targets. Each time the trend breaks a channel, a move toward the direction of the breakout with the size of the channel will mostly happen.
Supports:
$ 0.315 Ma50 in W1
$ 0.275 Ma20 in W1
$ 0.21 ~ $ 0.26 Demand zone
Resistances:
$ 0.47 ~ $ 0.50 D1 Supply zone
$ 0.90 Range high
$ 1.10 W1 Supply zone
$ 1.45
$ 2.50 Channel upper boundary
$ 2.80 W1 Supply zone
Conclusion:
All these opinions are mine and can be wrong, so please DYOR.
This token is a low cap and low caps are mostly volatile in bull runs. I expect sharp moves in the way to its final targets in both ways. This will make it more of a risky trade. So I will be more cautious and will surely manage my position size according to my strategy. I recommend you to do the same.
**I need more energy to carry on and comes from your support!. don't forget to hit boost, share and comment your point of view with me**
My strategy goes as below:
🛒 Pair: BAKE/ USDT 🛒
👑 Bitcharge 👑
🕰 07/12/2024 🕰
POSITION: 🟢"Buy"🟢
2 % of capital
🛒 Buy: $ 0.270 – $ 0.315 🛒
👉Sell Targets👈
🎯TP1: $ 0.36 🥉
🎯TP2: $ 0.39 🥈
🎯TP3: $ 0.46 🥇
🎯TP4: $ 0.52 🚁
🎯TP5: $ 0.65 ✈️
🎯TP6: $ 0.72 🚀
🎯TP7: $ 0.89 🛰
🎯TP8: $ 0.96 🛰
🎯TP9: $ 1.05 ✨
🎯TP10: $ 1.25 ⭐️
🎯TP11: $ 1.45 💫
🎯TP12: $ 2.10 🪐
🎯TP13: $ 2.80 🌞
⛔️ SL: $ 0.1950 ⛔️ by closing D1 Below
--Stay rich--

BAKE seems readying for a massive rally$BAKE #bake token price very well accumulated for long time. If #bakeryswap makes a breakout here, then a massive rally is expected due to upcoming big news of #baketoken

BAKE NEW UPDATE (1D)This analysis is an update of the analysis you see in the "Related publications" section
Given the positive news in the crypto market, the diametric scenario and further time-price correction seems to be canceled, and instead of the diametric, we now have a triangle.
As long as it maintains the green zone, it can move towards the targets.
Closing a daily candle below the invalidation level will invalidate this analysis.
For risk management, please don't forget stop loss and capital management
When we reach the first target, save some profit and then change the stop to entry
Comment if you have any questions
Thank You

BAKEUSDT 1WBAKE ~ 1W
#BAKE forming a bullish pattern. And now retest this support block. If you have Conviction on this coin,. buy in stages from here. with a minimum target of 20%++

BAKE is readyBAKE has strong bullish formation on weekly chart. Maybe one more stophunt will be there before the run begins. Playing spot, few entries. Target 100% and more.
Manage your risk and use stoploss always. This is not a financial advice.

What will happen to BAKE?From the place where we placed the red arrow on the chart, it seems that the BAKE correction has occurred.
This correction looks like a diametric as we are now in wave E of this diametric.
In the green range, wave E is expected to end and then we enter wave F.
We are looking for buy/long positions in the green range.
Closing a daily candle below the invalidation level will violate this analysis
For risk management, please don't forget stop loss and capital management
Comment if you have any questions
Thank You

Bake Swing LongRisk: High
Longed Bakeusdt here if it holds here there is a possibility of a massive move towards 0.6 and 1 levels.
DCA under 0.2720
Stops: 0.2655(Tight) or 0.2600
Very Risky setup but looking at RR it's worth it.
Note: Not a Financial Advise.

BAKEUSDTBAKE ~ 5D ✅
#BAKE If you have Conviction on this coin,. Maybe this support block will be a good buy for now.

#Bake Trade IdeaBake can be a nice trade on the pullback, as setup is shown in the chart. It may take a while to get filled.
