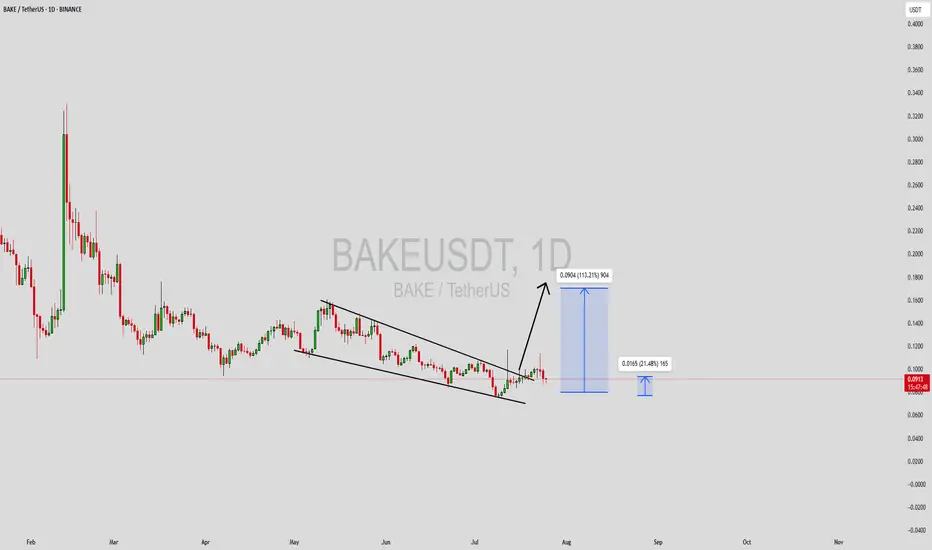
BAKEUSDT Forming Falling WedgeBAKEUSDT is presenting an interesting breakout scenario after forming a clean falling wedge pattern on the daily chart. Falling wedges are typically bullish reversal patterns, especially when confirmed by a breakout with volume. In this case, the wedge appears to be breaking to the upside, supported by a noticeable uptick in buying volume. Technical projections are pointing toward a potential price increase of 90% to 100%+, making this setup a valuable opportunity for swing traders and momentum investors.
BAKE (BakeryToken) remains an integral part of the DeFi and NFT landscape, particularly within the Binance Smart Chain ecosystem. Its utility, paired with renewed market attention and increased community engagement, could act as a fundamental driver behind this projected upward move. With the crypto market gradually rotating back into altcoins, BAKE could benefit from speculative capital flowing into undervalued DeFi assets.
Traders should keep a close watch on key resistance breakouts and continuation volume patterns. A confirmed daily candle close above the wedge resistance would further validate the bullish breakout thesis. Additionally, historical price action shows that BAKE has the potential to move sharply once momentum kicks in, offering a favorable risk-to-reward setup.
Overall, the technicals align well with rising investor sentiment. If the broader crypto environment stays supportive, BAKEUSDT could see a strong recovery rally in the short to mid term.
✅ Show your support by hitting the like button and
✅ Leaving a comment below! (What is You opinion about this Coin)
Your feedback and engagement keep me inspired to share more insightful market analysis with you!
Bakeusdtlong
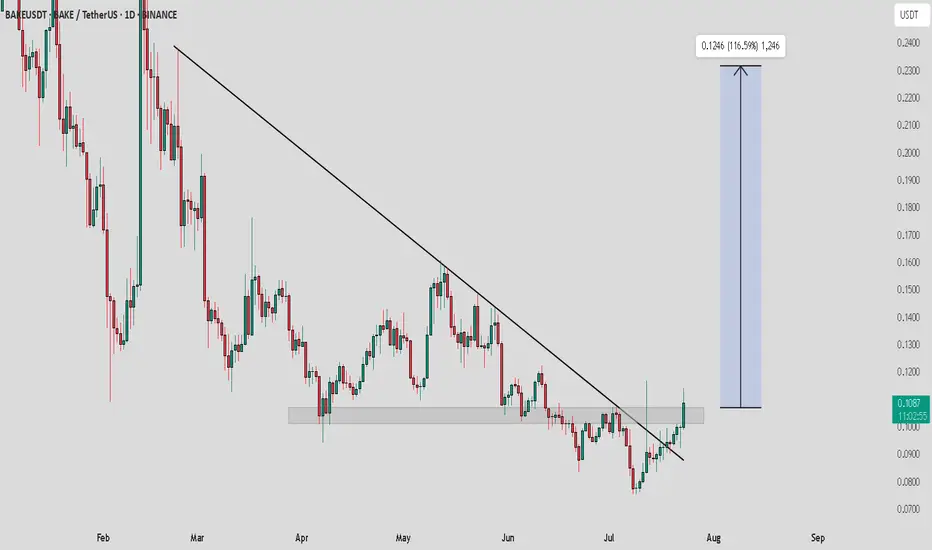
BAKE / USDT : Breakout PotentialBAKE/USDT - Breakout Potential
BAKE/USDT has recently broken above a key resistance zone and is attempting a trend reversal. With the trendline resistance already broken, we are expecting a bullish move towards the $0.124 target, which represents a potential gain of 116.5% from the current price.
Bullish Scenario:
Breakout above the resistance zone confirms the trend reversal, targeting $0.124 with a +116.5% upside.
Pro Tip:
Look for strong volume confirmation during the breakout. Set stop losses just below the breakout level for risk management.
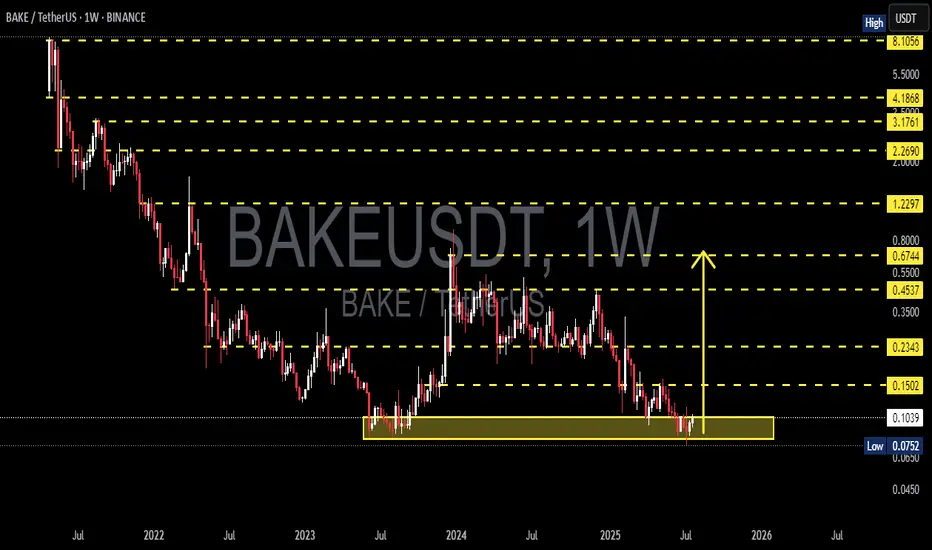
BAKEUSDT Weekly Analysis – Critical Level: Accumulation?🔎 Overview
BAKE/USDT is currently trading within a multi-year demand zone between $0.0752 and $0.1030, which has historically served as a strong support region since mid-2022. This zone has repeatedly triggered major price bounces, making it a high-interest area for traders and investors eyeing a potential trend reversal.
We're potentially witnessing a stealth accumulation phase — a quiet period where smart money begins to build positions before a markup phase, especially if rising volume starts to accompany price stabilization.
🧠 Technical Structure & Price Patterns
📌 Key Demand Zone Support
This zone ($0.0752–$0.1030) has held for nearly 3 years. Price has consistently bounced off this level, suggesting strong institutional or long-term holder interest.
📌 Potential Pattern: Inverse Head & Shoulders / Double Bottom
There's early indication of a potential inverse head and shoulders pattern forming.
Breakout above the neckline (~$0.15) would confirm a bullish reversal with measurable upside targets.
📌 Falling Channel Breakout Potential
BAKE has been moving inside a long-term descending channel. A breakout above the channel resistance could mark the beginning of a major trend shift.
📌 Volume Observation
Volume remains low, but this often precedes a strong move during accumulation. Watch for a volume spike to confirm breakout momentum.
📈 Bullish Scenario (Mid to Long-Term Reversal Potential)
If price holds above the demand zone and breaks through the first resistance at $0.15, the following targets come into play:
Target 1: $0.2343 – minor horizontal resistance
Target 2: $0.4537 – key April 2024 resistance level
Target 3: $0.6744 to $0.8000 – high-volume distribution zone
Extended Target: $1.2297 to $2.2690 – major supply area from early 2022
➡️ Upside potential exceeds +800% from the current levels if the reversal is confirmed.
📉 Bearish Scenario (Breakdown Continuation)
If BAKE breaks and closes below $0.0752, then:
A major structural breakdown would invalidate the accumulation thesis.
Price could drop toward the psychological support around $0.05 or even explore new all-time lows.
This could trigger a panic sell, especially among retail holders who rely heavily on this key level.
🧭 Strategic Takeaway
This zone represents a high-risk, high-reward opportunity.
Ideal for swing or long-term traders aiming to position early at undervalued levels.
However, avoid FOMO. Wait for clear breakout confirmation and volume surge before entering aggressively.
> “Smart money buys in silence — retail buys in headlines.”
#BAKEUSDT #AltcoinSetup #CryptoReversal #DemandZone #AccumulationPhase #BullishSetup #BearishScenario #SwingTradeCrypto #BAKEAnalysis
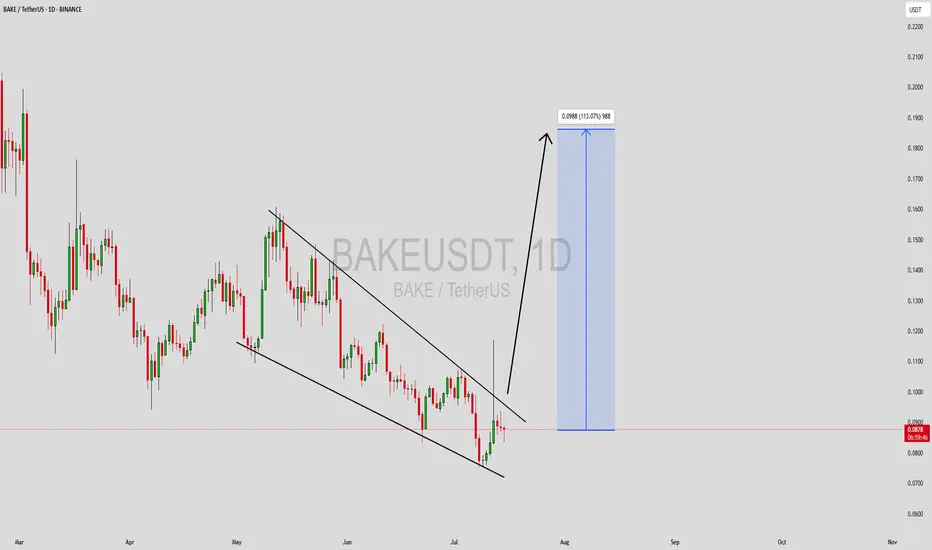
BAKEUSDT Forming Falling WedgeBAKEUSDT is currently forming a promising Falling Wedge Pattern, a classic bullish reversal setup that traders watch for significant upside potential. This pattern, combined with steadily increasing volume, indicates that a major breakout could be on the horizon. Historically, falling wedges often precede explosive price moves, and BAKEUSDT is showing early signs of preparing for just that. Technical traders who spot this formation early can position themselves for the expected 90% to 100%+ gain if the breakout confirms with strong momentum.
Investor sentiment around BAKEUSDT is improving as this project garners more attention from the crypto community. The sustained interest and accumulation phase within the wedge are clear signals that large buyers are preparing for a bigger move. As BAKEUSDT approaches the breakout point of the wedge, traders should closely monitor price action and volume spikes to catch the first wave of upward movement. This makes BAKE one of the top altcoins to keep on your radar right now.
Another reason BAKEUSDT stands out is its healthy trading volume, which supports the likelihood of a successful breakout rather than a false move. The increased liquidity ensures that once the resistance of the wedge pattern is breached, the price can rally with minimal slippage and strong follow-through. With major cryptocurrencies setting the tone for the broader market, high-potential altcoins like BAKE can benefit from renewed bullish momentum across the board.
✅ Show your support by hitting the like button and
✅ Leaving a comment below! (What is You opinion about this Coin)
Your feedback and engagement keep me inspired to share more insightful market analysis with you!
BAKEUSDT 1W AnalysisBAKE ~ 1W Analysis
#BAKE Buy back gradually from here with a short term target of at least 20%+ from this support.

BAKEUSDT 1WBAKE ~ 1W Analysis
#BAKE Buy gradually from here if you still have a Conviction on this coin with a short -term target of at least 20%+.

BAKEUSDT 1WBAKE ~ 1W Analysis
#BAKE Buy gradually from here if you still have a Conviction on this coin with a short -term target of at least 20%+.

BAKEUSDT – Red Boxes Are Strong Resistance Zones!The red boxes on BAKEUSDT represent significant resistance zones where we can expect considerable selling pressure. These levels have shown their strength in the past, and it's crucial to approach them with caution.
🔴 Key Insights:
Strong Resistance: The red boxes are key resistance areas with high potential for price rejection. Sellers are likely to be active here, so don’t rush.
Patience is Key: Always wait for lower time frame (LTF) breakouts with CDV and volume profile confirmation before making any decisions.
Avoid Blind Entries: Trading these zones blindly can be risky. Let the market show you its intention, and only trade with confirmation.
💡 Smart Approach:
Wait for a clear signal before making a move. If the market doesn’t break and retest these red zones with volume, there’s no reason to take unnecessary risks. Your entry should always be backed by proper data and analysis. Patience + Smart Entries = Successful Trades.
I keep my charts clean and simple because I believe clarity leads to better decisions.
My approach is built on years of experience and a solid track record. I don’t claim to know it all, but I’m confident in my ability to spot high-probability setups.
If you would like to learn how to use the heatmap, cumulative volume delta and volume footprint techniques that I use below to determine very accurate demand regions, you can send me a private message. I help anyone who wants it completely free of charge.
I have a long list of my proven technique below:
🎯 ZENUSDT.P: Patience & Profitability | %230 Reaction from the Sniper Entry
🐶 DOGEUSDT.P: Next Move
🎨 RENDERUSDT.P: Opportunity of the Month
💎 ETHUSDT.P: Where to Retrace
🟢 BNBUSDT.P: Potential Surge
📊 BTC Dominance: Reaction Zone
🌊 WAVESUSDT.P: Demand Zone Potential
🟣 UNIUSDT.P: Long-Term Trade
🔵 XRPUSDT.P: Entry Zones
🔗 LINKUSDT.P: Follow The River
📈 BTCUSDT.P: Two Key Demand Zones
🟩 POLUSDT: Bullish Momentum
🌟 PENDLEUSDT.P: Where Opportunity Meets Precision
🔥 BTCUSDT.P: Liquidation of Highly Leveraged Longs
🌊 SOLUSDT.P: SOL's Dip - Your Opportunity
🐸 1000PEPEUSDT.P: Prime Bounce Zone Unlocked
🚀 ETHUSDT.P: Set to Explode - Don't Miss This Game Changer
🤖 IQUSDT: Smart Plan
⚡️ PONDUSDT: A Trade Not Taken Is Better Than a Losing One
💼 STMXUSDT: 2 Buying Areas
🐢 TURBOUSDT: Buy Zones and Buyer Presence
🌍 ICPUSDT.P: Massive Upside Potential | Check the Trade Update For Seeing Results
🟠 IDEXUSDT: Spot Buy Area | %26 Profit if You Trade with MSB
📌 USUALUSDT: Buyers Are Active + %70 Profit in Total
🌟 FORTHUSDT: Sniper Entry +%26 Reaction
🐳 QKCUSDT: Sniper Entry +%57 Reaction
📊 BTC.D: Retest of Key Area Highly Likely
I stopped adding to the list because it's kinda tiring to add 5-10 charts in every move but you can check my profile and see that it goes on..
A tiny part of my runners;
🌊 WAVESUSDT.P: Demand Zone Potential
🟣 UNIUSDT.P: Long-Term Trade
🔵 XRPUSDT.P: Entry Zones
🔗 LINKUSDT.P: Follow The River
📈 BTCUSDT.P: Two Key Demand Zones
A tiny part of my runners;
💼 STMXUSDT: 2 Buying Areas
🐢 TURBOUSDT: Buy Zones and Buyer Presence
🌍 ICPUSDT.P: Massive Upside Potential | Check the Trade Update For Seeing Results
🟠 IDEXUSDT: Spot Buy Area | %26 Profit if You Trade with MSB
📌 USUALUSDT: Buyers Are Active + %70 Profit in Total
🌟 FORTHUSDT: Sniper Entry +%26 Reaction
🐳 QKCUSDT: Sniper Entry +%57 Reaction
j
📌I keep my charts clean and simple because I believe clarity leads to better decisions.
📌My approach is built on years of experience and a solid track record. I don’t claim to know it all but I’m confident in my ability to spot high-probability setups.
📌If you would like to learn how to use the heatmap, cumulative volume delta and volume footprint techniques that I use below to determine very accurate demand regions, you can send me a private message. I help anyone who wants it completely free of charge.
🔑I have a long list of my proven technique below:
🎯 ZENUSDT.P: Patience & Profitability | %230 Reaction from the Sniper Entry
🐶 DOGEUSDT.P: Next Move
🎨 RENDERUSDT.P: Opportunity of the Month
💎 ETHUSDT.P: Where to Retrace
🟢 BNBUSDT.P: Potential Surge
📊 BTC Dominance: Reaction Zone
🌊 WAVESUSDT.P: Demand Zone Potential
🟣 UNIUSDT.P: Long-Term Trade
🔵 XRPUSDT.P: Entry Zones
🔗 LINKUSDT.P: Follow The River
📈 BTCUSDT.P: Two Key Demand Zones
🟩 POLUSDT: Bullish Momentum
🌟 PENDLEUSDT.P: Where Opportunity Meets Precision
🔥 BTCUSDT.P: Liquidation of Highly Leveraged Longs
🌊 SOLUSDT.P: SOL's Dip - Your Opportunity
🐸 1000PEPEUSDT.P: Prime Bounce Zone Unlocked
🚀 ETHUSDT.P: Set to Explode - Don't Miss This Game Changer
🤖 IQUSDT: Smart Plan
⚡️ PONDUSDT: A Trade Not Taken Is Better Than a Losing One
💼 STMXUSDT: 2 Buying Areas
🐢 TURBOUSDT: Buy Zones and Buyer Presence
🌍 ICPUSDT.P: Massive Upside Potential | Check the Trade Update For Seeing Results
🟠 IDEXUSDT: Spot Buy Area | %26 Profit if You Trade with MSB
📌 USUALUSDT: Buyers Are Active + %70 Profit in Total
🌟 FORTHUSDT: Sniper Entry +%26 Reaction
🐳 QKCUSDT: Sniper Entry +%57 Reaction
📊 BTC.D: Retest of Key Area Highly Likely
📊 XNOUSDT %80 Reaction with a Simple Blue Box!
📊 BELUSDT Amazing %120 Reaction!
I stopped adding to the list because it's kinda tiring to add 5-10 charts in every move but you can check my profile and see that it goes on..

Bakeusdt Buy Opportunity Entered DCA leverage long from here cause i see a good buy opportunity from here though its very risky.
RR is good if this holds and Bounce.
Expecting a strong and fast bounce if holds.
entered under 0.1400
will scale out if holds under 0.1385
Targeting 0.1700
Note: Not a Financial Advice

BAKEUSDT 1WBAKE ~ 1W Analysis
#BAKE This is the lowest support for now.
Buy from here if you still have a Conviction on this coin with a short -term target of at least 20%+.

BAKEUSDT 1WBAKE ~ 1W
#BAKE If you still have Conviction on this coin,. This is a very good support block to start buying again., Target at least 20%+

BAKEUSDT: Smart Entry Opportunity – Blue Box Demand Zone!BAKEUSDT is presenting a golden opportunity for traders with the blue box as a well-defined demand zone. This level is the most rational entry point for those seeking high-probability setups.
Why the Blue Box?
Meticulously Selected: The blue box has been carefully identified using volume footprint, volume profile, cumulative delta volume (CDV), and liquidity heatmaps , ensuring it aligns with high-demand regions.
Confirmation Process: I will validate trades in the blue box using CDV, liquidity heatmaps, volume profiles, volume footprints (ensuring buyers are present), and upward market structure breaks in lower time frames . This ensures entry precision and minimizes risk.
Strategic Risk Management: The current market demands calculated moves. The blue box offers the most logical zone for entry, reducing exposure to unnecessary risks.
What’s Next?
Boost your confidence by trading where buyers are likely to act. If the market follows through, this setup could be a game-changer.
Engage & Share:
If you find this analysis valuable, please boost and leave a comment ! Your support motivates me to keep sharing these high-probability trade ideas.
Learn the Process – For Free!
Want to learn how I identify such precise demand zones? DM me to learn how I use CDV, liquidity heatmaps, volume profiles, and volume footprints . I’m happy to help for free – let’s grow together!
If you think this analysis helps you, please don't forget to boost and comment on this. These motivate me to share more insights with you!
I keep my charts clean and simple because I believe clarity leads to better decisions.
My approach is built on years of experience and a solid track record. I don’t claim to know it all, but I’m confident in my ability to spot high-probability setups.
If you would like to learn how to use the heatmap, cumulative volume delta and volume footprint techniques that I use below to determine very accurate demand regions, you can send me a private message. I help anyone who wants it completely free of charge.
My Previous Analysis (the list is long but I think it's kinda good : )
🎯 ZENUSDT.P: Patience & Profitability | %230 Reaction from the Sniper Entry
🐶 DOGEUSDT.P: Next Move
🎨 RENDERUSDT.P: Opportunity of the Month
💎 ETHUSDT.P: Where to Retrace
🟢 BNBUSDT.P: Potential Surge
📊 BTC Dominance: Reaction Zone
🌊 WAVESUSDT.P: Demand Zone Potential
🟣 UNIUSDT.P: Long-Term Trade
🔵 XRPUSDT.P: Entry Zones
🔗 LINKUSDT.P: Follow The River
📈 BTCUSDT.P: Two Key Demand Zones
🟩 POLUSDT: Bullish Momentum
🌟 PENDLEUSDT.P: Where Opportunity Meets Precision
🔥 BTCUSDT.P: Liquidation of Highly Leveraged Longs
🌊 SOLUSDT.P: SOL's Dip - Your Opportunity
🐸 1000PEPEUSDT.P: Prime Bounce Zone Unlocked
🚀 ETHUSDT.P: Set to Explode - Don't Miss This Game Changer
🤖 IQUSDT: Smart Plan
⚡️ PONDUSDT: A Trade Not Taken Is Better Than a Losing One
💼 STMXUSDT: 2 Buying Areas
🐢 TURBOUSDT: Buy Zones and Buyer Presence
🌍 ICPUSDT.P: Massive Upside Potential | Check the Trade Update For Seeing Results
🟠 IDEXUSDT: Spot Buy Area | %26 Profit if You Trade with MSB
📌 USUALUSDT: Buyers Are Active + %70 Profit in Total
🌟 FORTHUSDT: Sniper Entry +%26 Reaction
🐳 QKCUSDT: Sniper Entry +%57 Reaction
📊 BTC.D: Retest of Key Area Highly Likely
I stopped adding to the list because it's kinda tiring to add 5-10 charts in every move but you can check my profile and see that it goes on..

Bake Long ScalpAdded to longs with tight stoploss.
Expecting a strong rejection from the local support area.
Entered 0.3265.
Stoploss clean breaking below the area around 3230.
Note: Not a Financial Advise.

BAKEUSDT 1WBAKE ~ 1W
#BAKE forming a bullish pattern. And now retest this support block. If you have Conviction on this coin,. buy in stages from here. with a minimum target of 20%++

Bake Swing LongRisk: High
Longed Bakeusdt here if it holds here there is a possibility of a massive move towards 0.6 and 1 levels.
DCA under 0.2720
Stops: 0.2655(Tight) or 0.2600
Very Risky setup but looking at RR it's worth it.
Note: Not a Financial Advise.

BAKEUSDTBAKE ~ 5D ✅
#BAKE If you have Conviction on this coin,. Maybe this support block will be a good buy for now.

#BAKE/USDT SPOT LONG ENTRY#BAKE/USDT SPOT LONG ENTRY
Leverage: 3x
Entries: $0.2696
Take profit 1: $0.2788
Take profit 2: $0.2959
Take profit 3: $0.3243
Stop Loss: $0.2555
NOTE: This is just my prediction. Be sure to use STOPLOSS and remember that I am not a financial adviser. your money, your risk!
Thanks
The sroced.
BINANCE:BAKEUSDT

BAKEUSDT Critical Levels to Watch for the Next Big Move! Yello, Paradisers! Are you prepared for the next big shift in #BAKEUSDT? This analysis is crucial if you want to stay ahead!
💎#BAKE appears poised to test its strong demand zone, potentially creating new momentum for a significant upward move. However, success hinges on several key factors:
💎If BAKE reverses from the strong demand zone, it must break through the resistance at 0.3138 to continue its upward trajectory.
💎Should BAKE fail to break the resistance, it might either trade sideways between the strong demand and resistance levels or consolidate further in the order block (OB) area. If the latter scenario holds, it could lead to a robust bullish reversal and eventual resistance breakout.
💎If BAKE fails to rebound at the OB area and remains sideways, it signals trouble. The bullish scenario is invalidated if BAKE breaks the key support and closes below 0.309 daily, increasing the probability of further downward movement.
Treat the market as a businessman, not as a gambler.
MyCryptoParadise
iFeel the success🌴

Bake Long SetupBakeusdt here looks pretty interesting.
Trying to build Leveraged Long under 0.3110 till 0.3070.
Stoping at 0.3050.
Highly Risky because of leverage and tight stop.
But if holds here can produce a nice move.
Note: Not a Financial Advise.


#BAKE/USDT#BAKE
The price was pushed strongly to achieve 1-fold and is currently being corrected
For the rising trend level around the 0.3000 area
It is expected to rise again
First target 0.4217
Second target 0.5657

#BAKE/USDT#BAKE
The price is moving in a downward channel, 4-hour frame
The price adheres to the limits of that channel
We have oversold conditions on the MACD indicator
Current price 0.3047
The first goal is 0.3200
The second target is 0.3366
The third goal is 0.3572

BakeUsdt Breakout Bakeusdt
Breakout confirmed, Incase of successfull retest we can expect a good bullish move .
Not financial advice
