BAND/USDT – Massive Trendline Breakout! Reversal Play!📌 Chart Overview:
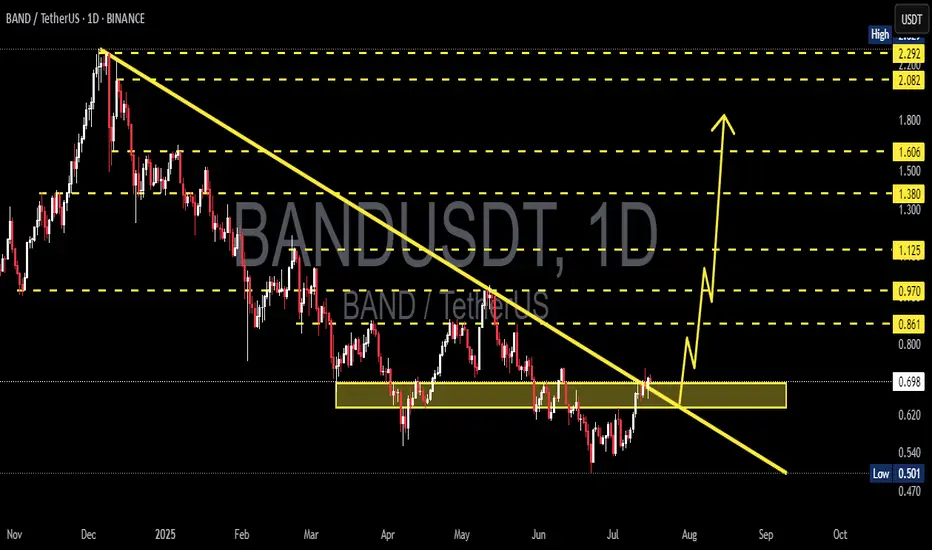
BAND/USDT has officially broken out from a long-term descending trendline that has suppressed price action for over 7 months. This breakout, confirmed with a bullish daily close above a key horizontal resistance zone ($0.68–$0.70), opens the door for a powerful trend reversal.
The structure signals the end of accumulation and the beginning of a potential markup phase, where volatility and volume often expand rapidly.
🔍 Technical Pattern Breakdown:
Falling Wedge Formation: A classic bullish reversal pattern formed after a prolonged downtrend. The wedge narrowed price volatility and concluded with a clean breakout to the upside.
Descending Trendline Breakout: The break of the major trendline marks a shift in control from bears to bulls. Historically, this is one of the strongest technical signals for a trend reversal.
Demand Zone Validation: The $0.60–$0.70 range has acted as a multi-month accumulation zone, with repeated rejections from the downside showing strong buyer presence.
✅ Bullish Scenario:
If BAND holds above the $0.68–$0.70 breakout zone, a strong bullish rally could unfold with the following upside targets:
1. TP1: $0.861 – Minor resistance, potential retest level.
2. TP2: $0.970 – Psychological resistance and historical flip zone.
3. TP3: $1.125 – Major horizontal resistance; a breakout from here could trigger FOMO buying.
4. TP4: $1.380–$1.606 – High-confluence zone from previous consolidation.
5. TP5: $2.08–$2.29 – Ultimate extension target aligned with macro resistance from November 2024 highs.
Each breakout above the target levels could lead to a short squeeze scenario, accelerating momentum.
⚠️ Bearish Scenario:
A failure to sustain above the $0.68–$0.70 level would invalidate the breakout and trap late buyers.
Breakdown back below the yellow zone could push price towards:
$0.60 – Key mid-support
$0.501 – The lowest support on chart; a break here would resume the downtrend.
Watch for volume divergence or fake-out signals on lower timeframes.
🧠 Market Psychology Insight:
This setup reflects a shift in sentiment. After a prolonged phase of apathy and seller exhaustion, smart money appears to be stepping in. The strong rejection from lows and breakout suggests early-stage bullish accumulation transitioning into public participation.
If volume increases along with upward price movement, it may confirm Phase C-D of a Wyckoff Accumulation, suggesting much higher upside.
📆 Timing Note:
Historically, July–September has offered volatility surges across mid-cap altcoins. With BAND breaking structure at this critical timing, early positioning could offer asymmetrical risk-reward.
#BANDUSDT #CryptoBreakout #AltcoinSeason #TrendlineBreak #BullishReversal #TechnicalAnalysis #FallingWedge #CryptoSignals #BANDToken #CryptoTA
Band
Can #BAND Bulls Maintain this Momentum or Will Bears Win? Yello, Paradisers! Is #BANDProtocol breakout from the falling wedge legit—or are bulls walking straight into a trap? Let's dig into the latest setup of #BANDUSDT:
💎After trading for weeks inside a falling wedge, #BAND has finally broken out with solid momentum. The breakout above the resistance trendline at around $0.66 has already occurred, and the price is currently hovering near the $0.72 zone. While this move is promising, it’s now all about whether this breakout can hold or fake out.
💎The structure here is clear: #BANDUSD reclaimed the demand zone between $0.60–$0.66 after bouncing off strong support at $0.504. This zone now becomes the most important area to watch in the short term. A retest of this level would offer a high-probability continuation setup, especially since the 50EMA is now acting as dynamic support beneath the price.
💎If bulls can maintain control, we have a clear path toward the moderate resistance at $0.992. That’s where the next wave of selling pressure is expected. But the real prize is the strong resistance zone near $1.180. That’s the level where major distribution could occur, and it's where we’ll be watching closely for profit-taking signs.
💎However, the bullish thesis breaks down completely if the price drops back below the $0.60–$0.66 demand zone. In that case, our invalidation point sits firmly at $0.504. A close below that support would indicate bears are back in control, and we’d shift to a defensive stance, targeting lower re-entry zones.
Stay patient, Paradisers. Let the breakout confirm, and only then do we strike with conviction.
MyCryptoParadise
iFeel the success🌴

#BAND/USDT#BAND
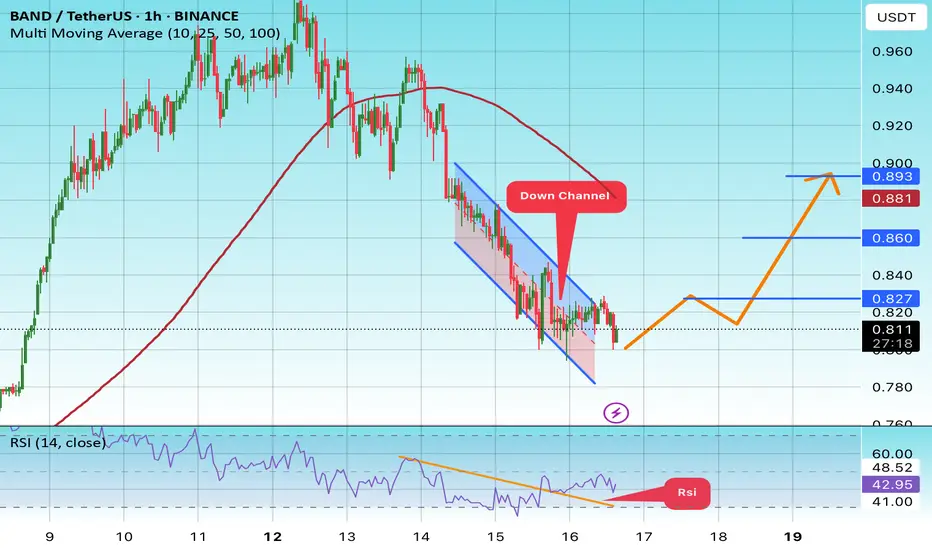
The price is moving within a descending channel on the 1-hour frame and is expected to break and continue upward.
We have a trend to stabilize above the 100 moving average once again.
We have a downtrend on the RSI indicator that supports the upward move with a breakout.
We have a support area at the lower limit of the channel at 0.04400, which acts as strong support from which the price can rebound.
Entry price: 0.810
First target: 0.827
Second target: 0.860
Third target: 0.893
BANDUSDT 1D AnalysisBAND ~ 1D Analysis
#BAND Buy when re -testing this support block with a short -term target of at least 15%+ from here.

BANDUSDT Breakdown or Reversal?
Yello, Paradisers. Have you been watching #BAND lately? The setup is tightening, and it’s only a matter of time before a major move plays out one that could trap both early bulls and stubborn bears. The key now is preparation, not prediction.
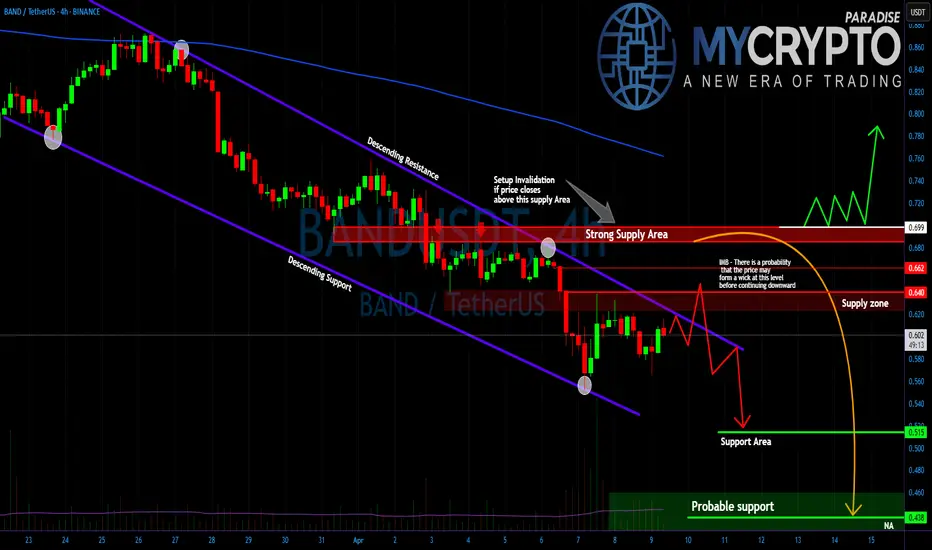
💎#BANDUSDT continues to move within a clean descending channel, respecting both trendline resistance and support. The broader structure shows a clear downtrend, and at this stage, there's a strong probability that price may first push upward with a wick to fill an existing imbalance only to reject and continue lower. These kinds of deceptive moves are common during market weakness and are often designed to trap breakout traders before the real direction is confirmed.
💎#BAND price remains firmly below both the 50 and 200 exponential moving averages, which confirms that the larger trend is still bearish. The 50 EMA is currently acting as dynamic resistance, capping any short-term upside attempts. Meanwhile, the 200 EMA adds further weight to the bearish case, as price has consistently failed to reclaim or hold above it.
💎The most important level to the upside is 0.699. This is a clear supply zone, and unless the price can break and sustain above this level and reclaim both EMAs there will be no real shift in market sentiment. On the downside, 0.515 remains a critical support level. If price holds here, a short-term bounce is possible. However, if 0.515 breaks with momentum, the next key downside target becomes 0.438, marking a deeper markdown phase.
Stay focused, Paradisers. Be the hunter, not the hunted.
MyCryptoParadise
iFeel the success🌴
#BAND/USDT#BAND
The price is moving in a descending channel on the 1-hour frame and is adhering to it well and is heading to break it strongly upwards and retest it
We have a bounce from the lower limit of the descending channel, this support is at a price of 0.926
We have a downtrend on the RSI indicator that is about to break and retest, which supports the rise
We have a trend to stabilize above the moving average 100
Entry price 0.940
First target 0.970
Second target 0.997
Third target 1.038

BANDUSDT 1WBAND ~ 1W Analysis
#BAND If you still have a Conviction on this coin. This support block will be a very good place of buy for now.

Is This the Most Perfect Bollinger Band Breakout Ever?I’ve been keeping an eye on XCN/USDC, and this latest move is something else. After a sharp drop that looked like a liquidity grab, we’ve seen a stunning recovery and breakout above the upper Bollinger Band. Could this be the start of something huge?
This kind of setup has the potential to keep running, and I wouldn’t be surprised if we see new highs soon. Is this the strongest bounce we’ve seen in weeks, or do you think there’s more consolidation ahead?
Drop your thoughts, follow, and share for more insights like this. Let’s see where this takes us!

BANDUSDT Explosive 600% Profit SetupA strong long trade setup has been identified using the Risological Swing Trading Indicator , with a massive 600% profit potential at 10x leverage.
Trade Details:
Entry: $1.541
Stop Loss (SL): $1.389
Targets:
TP1: $1.729
TP2: $2.033
TP3: $2.337
TP4: $2.525
Analysis:
The trade setup shows a breakout signal with clear entry and defined risk. The indicator aligns with a bullish momentum, suggesting potential to reach all target levels efficiently. This setup offers an excellent risk-to-reward ratio, making it a lucrative opportunity for traders.

BANDUSDT 1WBAND Update ~ 1W
#BAND If you still have Conviction on this coin. buy in stages from here. with a minimum target of 20%++, it is only a matter of time until this resistance line is successfully penetrated.

#BAND/USDT#BAND
The price is moving in a descending channel on the 1-hour frame and is expected to continue upwards
We have a trend to stabilize above the moving average 100 again
We have a descending trend on the RSI indicator that supports the rise by breaking it upwards
We have a support area at the lower limit of the channel at a price of 1.80
Entry price 1.95
First target 1.95
Second target 2.08
Third target 2.23

BAND dip entry swing trade opportunity?I know it doesnt seem like much of a dip but in the ascending channel it has assumed, it is a dip to bottom of channel. I have been posting a bunch of momentum trade targets where a resisting trendline is broken and assets break out once they finally break through, but a lot of those can leave you wondering where to exit, best if you can handle it with a trailing stop loss if you have it available to you.
Buying the dip tends to be safer and you have a clear definition of when to accept loss and bail and where about's to exit. I prefer ascending trendlines, I dont like to swing trade a descending trendline though in some market conditions thats all we have, but right now this is a bull market so there are plenty of options.
So here with BAND you see 3 components to my entry
#1 A strong identifiable ascending trendline
#2 We are testing support
#3 We break out of the short term descending resistance that pushed us down to test support, indicating we are switching directions from descent to ascent.
Then where to exit, the easiest way to see where resistance is, copy your Tradingview line and paste it, then move it up, you will find top of channel by moving the line (without changing angle, just moving up or down) to the top of the tallest candle above the trendline. You can also usually find a mid-channel line which will present resistance and support along the way.
This chart infers if we enter here, we might can exit at around $2.70, depending on when we get to top of channel. Of course this hasnt triggered yet, it could break that longer supporting trendline and then it would be bearish and not ideal to trade.
I have numerous assets I am watching that are in this state now, i am currently using 3 commas to monitor the trendline I have #3 pointing to on this (and similar on other assets), if it breaks through, I will pick up the position automatically. I can use an exit signal also via the top trendline though atm I am trying with a loose trailing stop loss.
Orderbooks dont look exciting on BAND atm and volume isnt exciting either, but I think its hard to use those when trying to "buy a bottom", you are trying to buy it in its worst condition as of recently.
Anyway another opp to bring to your attention, another tool you might can use in your toolbelt and of course as usually, DYOR, this write up should not be something you use as the deciding factor to trade an asset. Also as always, sentiment can change any time a trendline is broken so watch the lines and be ready to adapt.

#BAND (SPOT) IN ( 1.000- 1.320) T. (15) SL(.951)BINANCE:BANDUSDT
entry range (1.000- 1.320)
Target1 (1.730) - Target2 (2.100)- Target3 (5.000)- Target4 (7.300)- Target5 (13.000)- Target6 (15.000)
1 Extra Targets(optional) in chart, if you like to continue in the trade with making stoploss very high.
SL .1D close below (0.951)
***This coin on weekly chart is going to give 10X but it may take time to achieve all targets***
______________________________________________________________
Golden Advices.
********************
* collect the coin slowly in the entry range.
* Please calculate your losses before the entry.
* Do not enter any trade you find it not suitable for you.
* No FOMO - No Rush , it is a long journey.
Useful Tags.
****************
My total posts
www.tradingview.com
1Million Journey
www.tradingview.com
www.tradingview.com
********************************************************************************************************************** #Manta ,#OMNI, #DYM, #AI, #IO, #XAI , #ACE #NFP #RAD #WLD #ORDI #BLUR #SUI #Voxel #AEVO #VITE #APE #RDNT #FLUX #NMR #VANRY #TRB #HBAR #DGB #XEC #ERN #ALT #IO #ACA #HIVE #ASTR #ARDR #PIXEL #LTO #AERGO #SCRT #ATA #HOOK #FLOW #KSM #HFT #MINA #DATA #SC #JOE #RDNT #IQ #CFX #BICO #CTSI #KMD #FXS #DEGO #FORTH # AST #PORTAL #CYBER #RIF #ENJ #ZIL #APT #GALA #STEEM #ONE #LINK #NTRN #COTI #RENDER #ICX #IMX #ALICE #PYR #PORTAL #GRT #GMT # IDEX #NEAR #ICP #ETH #QTUM #VET #QNT #API3 #BURGER #MOVR #SKL #BAND .

Band currently retesting neckline as support on invh&sNo guarantee it will hold that support but if it does, the breakout that is triggered afterwards should take us to the target shown here. *not financial advice*

Alikze »» BAND | Descending channel failure🔍 Technical analysis: Descending channel failure
- It has been moving in a downward channel on the daily time frame.
- It is currently in the supply zone with the breakdown of the descending channel.
- In case of a pullback to the broken structure and maintaining the 1.17 area, it can continue its growth until the next supply area of the 1.75-1.95 range.
In addition, in case of failure of the supply zone of 1.75-1.95 range, the upward movement will continue towards the next supply zone, which can touch the 2.60 range.
💎 Alternative scenario: In addition, if the 1.17 range is broken down, the bullish scenario will be invalidated and can continue the correction up to the 0.97 area.
»»»«««»»»«««»»»«««
Please support this idea with a LIKE and COMMENT if you find it useful and Click "Follow" on our profile if you'd like these trade ideas delivered straight to your email in the future.
Thanks for your continued support.
Best Regards,❤️
Alikze.
»»»«««»»»«««»»»«««
BINANCE:BANDUSDT

BANDUSDT Elliott Wave BreakdownIn this video, we conduct an in-depth analysis of BANDUSDT, examining its price action across multiple timeframes. By applying Elliott Wave theory, we aim to map out the potential future price movements and identify key turning points in the market. Additionally, we integrate insights from the Smart Money Concepts indicator, which provides us with a clearer understanding of market dynamics and potential zones of interest. This comprehensive approach allows us to develop a well-rounded trading strategy for BANDUSDT, balancing both short-term and long-term perspectives.

BANDUSDT 300% Potential!BANDUSDT Technical analysis update
BAND's price is bouncing from its major support zone after repeatedly testing the $1.00 support level. It has been trading in the $1.00-$2.50 range for the past 820 days, and a strong bullish move from the current level is anticipated.
Buy zone : Below $1.07
Stop loss : $0.87
Regards
Hexa

BAND looks bearishFrom where we placed the red arrow on the chart, it looks like a BAND correction has started.
BAND seems to be forming a complex diametric which is now in the middle of wave E.
We are looking for sell/short positions in the supply range.
Closing a daily candle above the invalidation level will violate the analysis.
For risk management, please don't forget stop loss and capital management
When we reach the first target, save some profit and then change the stop to entry
Comment if you have any questions
Thank You

BANDUSDT LONG ✉️ Pair: BANDUSDT
📈 Direction: Long
💯 Leverage: Cross 5X - 10X - 20X
📊 Entry 1: 1.550
📊 Entry 2 (DCA): 1.000
✅ Target 1: 2.000
✅ Target 2: 2.500
✅ Target 3: 3.000
⛔️ Stop Loss: 0.950
BAND Analysis:
Previously, #BANDUSDT has been trading within a descending channel on the 1D timeframe. #BAND has broken out of the descending channel and retested the breakout zone. This pattern is often a precursor to a bullish run. Currently, #BANDUSDT is testing a significant resistance level. A break above this could propel the price toward the upper supply zone, with a target around the strong resistance at $2.5.
If the $1.5 support fails, the next major support to watch is $1.0. This area is crucial, packed with liquidity, and could spark a bullish rally if tested.
Entry Strategy:
- Main entry: 1.550
- Additional entry (DCA): 1.000
Monitor volume and breakout confirmations closely. If #BAND breaks above the resistance level with good volume, it is likely to reach the specified resistance levels.
"Manage your risk – never trade with more than 1% of your capital on a single transaction."
DON`T FORGET TO BOOST US :D

BANDUSDT Bullish momentum - get ready for continue upward!Yello, Paradisers! Is #BANDUSDT poised for a significant move upward ? Let's break down the analysis.
💎#BAND has successfully reclaimed support and broken out of its descending pattern. Currently, the price looks to rebound after retesting this support, with a high probability of continuing upward to challenge the resistance at $1.85. A decisive breakout above this resistance could signal a significant upward move, shifting the trend back to bullish momentum and potentially reaching our target strong resistance area.
💎However, if BAND fails to break this resistance, we might see a retest of the support line. In a bearish scenario, a downward move could bring BAND to the demand zone around $1.108.
💎BAND has a strong history at key support levels. In previous instances, whenever the price hit this zone, it rebounded and moved upward. A bounce from this strong demand area would validate the bullish momentum. Conversely, failure to hold this level would invalidate the bullish outlook, increasing the probability of a downward dip.
Remember, consistency and patience are the keys to long-term success in the crypto market.
MyCryptoParadise
iFeel the success🌴

Band Protocol (BAND)Band Protocol chart is simple: an impulse wave followed by a corrective wave. Recently, Band broke the downtrend line and now showing signs of reversal. Let's see what happens.

BANDUSDT 1WBAND ~ 1W
#BAND Must defend this support block, To stop the price decline.
Defending this support block, Bulls will be in control. losing this support Price will visit the nearest support that we have marked

Opportunity to buy in BANDWe have a bullish iCH on the chart and the trigger line has also broken out.
On the demand range, we can look for buy/long positions
The targets are clear on the chart.
Closing a candle below the invalidation level will violate the analysis
Note that the financial market is risky, so:
Do not enter any position without confirmation and trigger.
Do not enter a position without setting a stop.
Do not enter a position without capital management.
When we reach the first TP, save some profit and try to move the stop continuously in the direction of your profit.
If you have any comments please post them, comments will help us improve our performance
Thanks
