BAND/USDTIt is forming an ascending triangle along with a parabolic curve, which usually occurs when a market moves up or down in an exponential type way. These are very rare moves that typically occur from periods of rampant speculation or at the end of bubbles(buying or selling into a parabolic move takes a lot of courage). As more vertical or parabolic the state of the curve, the bigger the resulting price correction usually is.
However, if done correctly, the benefits of trading a parabolic move can be great as they offer rapid profit potential. Prices tend to move very sharply at the end of a parabolic move. It has already formed Base 1 and Base 2 (mentioned in NOTE in green) and now is ready for a crazy move to the upside. Since, we are in an ALT SEASON, every coin is moving wildly. Crazy Market = Crazy Returns.
Resistances/Targets are mentioned in green (Although, it can surge more than that).
Supports in Blue.
DISCLAIMER : I am not your Financial Advisor, this chart is just for educational purposes only (DYOR).
P.S :- Too much information in the chart.
BINANCE:BANDUSDT
Band

#BANDUSDT #4HHi guys..its the latest analyze chart of BANDUSDT in 4H time frame .if you are interested any crypto that you want analyze with me and any questions please do not hesitate and comment below the chart!
if u like it press like-comment and folow me.thx

DeFi crypto markets and why you should invest in themThese charts show an indication why you should invest in DeFi crypto currencies. Here we have 5 different DeFi coins and as you can see they all are following a similar pattern, that being AAVE. The charts are all 1day log charts.
We investigate further into each coin below, starting with the main pattern, AAVE.
AAVE - Came onto market and like most of these coins decreased in price. It was at around $50 and dropped to around $0.34cents before a huge pump up to to $350 USD.
If you look at the EMA's and MA's on the chart you can compare them to the other charts to see they are very similar in how the market reacted. Once the candle crossed above the MA 144 (white line) shown where the white down arrow is it went on a nice move upwards.
BAND - Has crossed the indicator mentioned above as shown where the white down arrow is. Target is the yellow horizontal line.
YFii - As you can see on this chart it has not crossed the MA 144 (white line) where the purple down arrow is. Good time to get in as it looks like it is squeezing between all the MA and EMA's and a nice build up on the LMACD on it's way to 0 and above. Target is the yellow horizontal line.
UMA - Has crossed the indicator mentioned above as shown where the white down arrow is.
CRV - Has crossed the indicator mentioned above as shown where the white down arrow is. Target is the yellow horizontal line.
Happy trading legends!
HTBB
Take a look at my other charts and analysis below to see my unbelievable correct analysis record. If this kind of analysis interests you and you want more than just 1 or 2 correct chart analyses every month or so, check out my website and become a member.

Band Protocol may hit 70 AugustI hope everyone was holding because we had the breakout we were all waiting for! As you Recall from my previous analysis I compared the growth of band protocol to its brother Chainlink. The current way band protocol is growing is very similar to the way Chain grew its first year which can help us make some predictions. More details below:


BAND / USD - Trading Idea>18, TGT - 25-27, SL = Take calculated risk
Wait for candle close above 18.


BANDUSDTBAND is trapped in a parallel channel and is likely fluctuate in the channel and wont break the dynamic support/resistance
IF SO the pullback will be formed and will continue in the direction that break happened
and the parallel channel is bullish ofc . . .


🆓BAND Protocol/USDT Analysis (10/2) #BAND $BANDBAND is stopping at the strong resistance zone at 13-14$, if it surpasses this zone, BAND will increase strongly to 22-23$ by the end of February. But we need to wait for BAND to close a 1D candle above $14
📈BUY
-Buy: 13-14$ if A. SL if B
📉SELL
-Sell: 22-23$. SL if A
♻️BACK-UP
-Sell: 13-14$ if B. SL if A
-Buy: 8.75-9.25$. SL if B
❓Details
Condition A : "If 1D candle closes ABOVE this zone"
Condition B : "If 1D candle closes BELOW this zone"

Order Flow Band/USD TP 1 $50 USDBand is an Ethereum token which brings big data on chain and decentralized to its platform's blockchain. The only other crypto that has the same utility in the main DeFi space is Chainlink, with its Market cap at 10 billion USD.
I am lookin for this coin to go upwards towards $50 and from then on gauge PA and institutional behavior
Leave your comments and ideas below . Thanks !


Band protocol projection (long) squeezing up against key levelI predict Band will begin squeezing against the $13 key level. If we see this followed by a breakout Bands next target should be the $15-16.
If price breaks down below $11.4 the idea is invalid and we may spend some more time accumulating before lift off.


BAND update: BULLISH RETEST! GOOD REENTRY!sorry for messy chart, just wanted to get this out there quick.
BAND seems to have found support at the top of the previous ascending triangle it broke out from. It's now forming another ascending triangle (bullish pattern) before it moves higher. Right now the PA is at the bottom of the new pattern, which is the perfect time to reenter / increase position!
Bullish cross on Stoch RSI 4HR - good indication of a move to the upper area of the triangle (possibly higher) soon.
happy trades,
CD


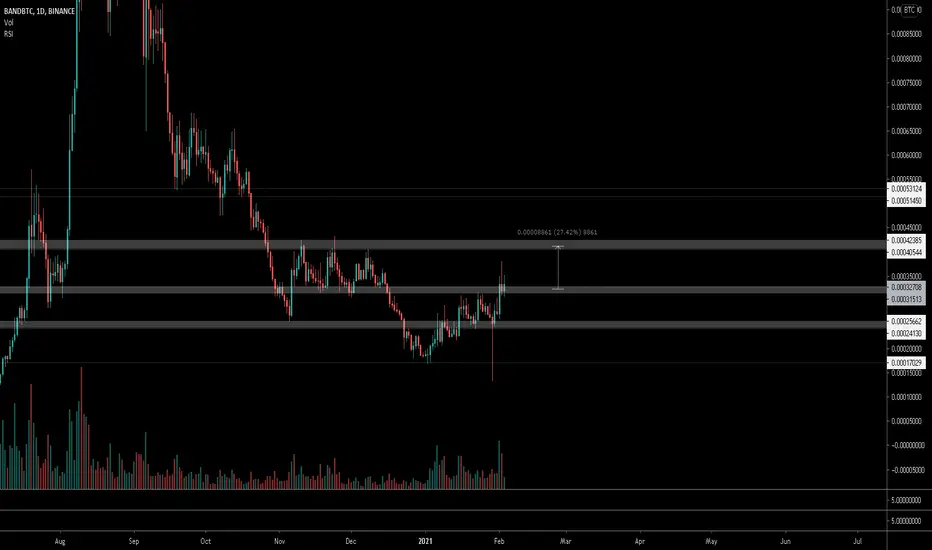
$BAND, Crossing over ~32k sats w/ a potential R/S Flip$BAND
Crossing over ~32k sats w/ a potential R/S Flip on the daily...
If manages to keeps pushing up (looks good), then 42k as 1st target on the way up (~25%)
UCTS Buy signal on the daily.. (usually strong)
Let see how it goes 😏
#BAND
🔥 BAND/USDT Bullish Wedge Break Out: Part 2In my previous BAND post I argued that the break out would lead to a strong bullish move upward. Sadly, the previous idea hit its SL recently. However, that doesn't mean that the trade is invalid. Today's massive candle break out has in my view started a new upward move for this amazing coin.
On the chart I’ve marked two potential areas of resistance, R1 and R2. These areas are based on recent swing highs and round numbers. Do your own due diligence.
Happy trading!

DIa Boom Oracle Defi in the market against Link.
We could to have inverse head shoulder with Ascending triangle :)

BAND/BTC (Harmonic)We see a gartly and prise cross up moving200 1 hour in full frame
Also in the 1-day timeframe based on the USDT currency pair, it is above the Moving 200


