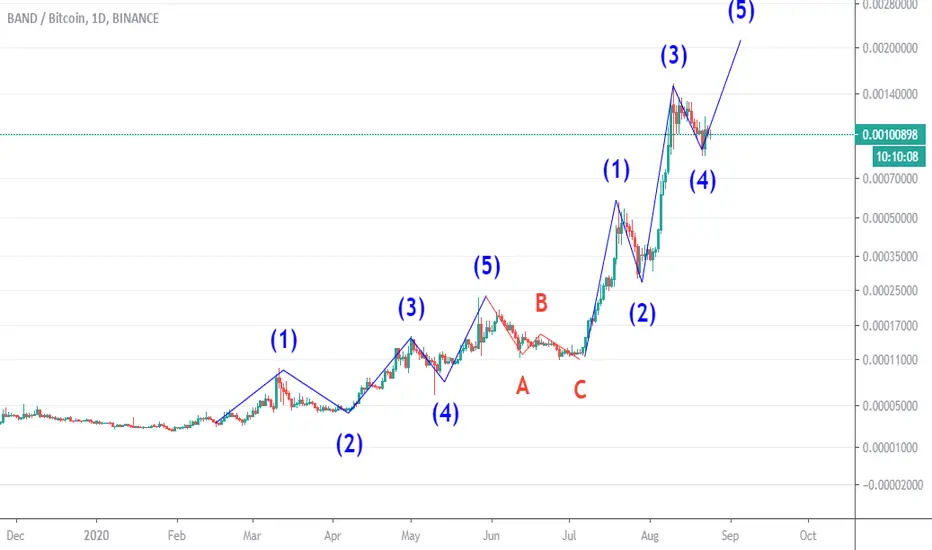
Elliot count on BANDHello, traders.
How far does the BAND can go? We believe that this asset is in on a long-term bullish trend.
We can finish the corrective wave 4 for this asset for the next upcoming days and, we can form another leg up with wave 5.
But be careful, this asset is way oversold on the weekly charts and we can start a corrective movement.
Push the like button and follow us on tradingview.
BANDBTC
BAND TO 3X BAND is the new LINK. Expect BAND to break into the top 10 before EOY. It will continue to remain green as it becomes more and more of a competitor to LINK.

BAND/BTC (Short Term Downtrend?) BAND/BTC
-This coin is on a short term downtrend
-Its value has depreciated by over -40% from the High
-Technically, there is no strong support at current market price
-The area which is likely to react is somewhere around 72350 region
-This is a confluence of Golden Fib level, 200ma support, and previous resistance
-So the chance we might see a bounce up reaction is high
-I recommend opening Buy orders only if there is a bullish rejection
-Because this will give us extra confirmation of support is being built

After More Than 9000% Big Move Band Protocol Formed Bull FlagHey friends hope you are well and welcome to the new update on Band protocol. This token has surged more than 9000%. In today's article we will try to understand how this token completed the bullish setup and what kind of signals we had before this surge and what the price action can do next.
Continuity of bullish harmonic moves can be a strong bullish signal:
Before starting the bullish move the price action of Band protocol formed different harmonic patterns on the daily chart. First it formed bullish BAT pattern then the price action of Band token formed another harmonic Shark pattern. And finally took a powerful bullish divergence and produced more than 9000% rally.
This is same as like the Bitcoin did. The price action BTC formed different harmonic patterns on daily chart from the month of May 2020. And I have been sharing all these patterns in my every article of Bitcoin. And finally in July 2020 the Bitcoin formed a bullish cypher pattern. After entering in the potential reversal zone the BTC started the upside move and spiked beyond 12K. Whenever the price action of any asset starts forming the different bullish harmonic pattern. At least on the daily chart. It can be is very significant signal that the priceline is going to explode soon.
A continuity of different events:
If you have missed the previous rally then no worries. Because the price action has started another bullish rally. As we can see the different events with continuity announced by Band protocol team and the different exchanges as well.
The first announcement was added on 31st of July and if we see the market cap of Band protocol on 31st July then it was 86.7 million dollars and now it is 302 million dollars. So market cap has increased by 248%. If we observe the volume of Band token then on 31st July it was 16.5 million and now it is 124 million dollars. So the volume of Band protocol is also increased by more than 650%. So after watching such a big jump in market cap and the volume as well we can have an Idea how many traders and buyers are interested to buy and hold this token.
The effect on charts:
Now if we take a closer look on the live daily chart then on 31st of July the Band protocol was moving sideways with the lowest price of $3.9 and the highest of 4.36 dollars. Then it started moving up and on 10th of August the price action spiked beyond $17 and surged more than 350% more.
The distance between SMAs and price action:
Now if we place different simple moving averages on the daily chart with the time period of 25, 50, 100 and 200. Then price action is above all these moving averages but there is a big distance between the SMAs and priceline So there can be two possibilities that the priceline may move down to use at least 25 simple moving average as a support before the next rally or the price action will move more up from this level as the way the candlesticks are being consolidated after 10th of August is likely to be a flag. In second case the 25 simple moving average can move up to provide the support to price action.
Symmetrical triangle on 4-hour chart:
If we switch the chart to 4 hour time period in order to take more closer look on it. Then the priceline is in fact moving in a pennant that is more likely to be a symmetrical triangle. The price is at the end of this tringle as it has squeezed so much. Now within next few hours we can see whether the priceline will breakout from the triangle or breakdown the support.
Conclusion:
As the priceline of Band protocol is forming different bull flags on the daily chart since it has started bullish rally after March 2020
But price action has no support of any simple moving average. Therefore there is also a possibility that the priceline won’t form a bull flag and move down to use any of the simple moving average as a support. But the continuity of the bull flags is signaling that the priceline will go for the next bull flag rather to break down the support of the triangle.

BAND Looks Ready to RunClassical pennant setup on the 4H BAND/BTC chart.
Will wait for close above sloping resistance before piling in. I'd be VERY surprised if this broke bearish, considering all the hype there is around oracle coins right now.
Now that Link is testing $20, bulls will be looking to get into BAND as the cheaper alternative. I think big buyers are waiting for a clear breakout signal before jumping back into this, so entering before that will be a gamble but the pay off could be very good.
Set stop losses!

BANDBTCHere we can see a Zigzag pattern and after this light correction we can expect a huge explosion!!

BAND +50% ?BAND has been everywhere lately and it did listed to Coinbase yesterday. Usually when new coin gets listed on Coinbase there is pump and retrace which will lead to new leg upwards. Lets see if this triangle can catch new BAND pump.

ATC vs BAND/BTCHi, today we will look at one of the growth leaders this year.
The last movements were especially good and as we can see the ATS was able to determine start and the end of the trend just in time.
Script settings for 1D timeframe:
· Signal calculation type - "Low"


BANDUSDT long 2x Spot Continuation on 1D/12H/6H BANDUSDT
Target 🎯 1- 6.7
2-7.4
3-8.4
SL 3.85
High Reward low risk
Entry below 6 USDT recommended.
RSI- Continution Bullish / crossing 50 & 60 on 12H and 6H
MACD - Turn around and Bullish bounce 0.0 line
Price Action - Bullish major uptrend
Pattern - Bullish Flag pattern/ Bollinger Bands shrinking
#Goes with BTCUSDT pair but more aggressive and BTCUSDT moving into an uptrend to help move BANDUSDT as well

BAND BTC DEFI TOKEN PULLBACK DUE?These DEFI projects are going crazy and i've been looking for an entry on this one. Maybe this is it if it gives.
We just saw an extension based on Fibs to the 2.618 based off the 10th May low, 26th May high and the 27th June low.
What i'm looking for now is a pull back to the channel high which is confluent with a Daily level, Fib golden pocket and the aforementioned channel top. So around the green box area 28577 sats - ish.
Will i get it? I don't know but the confluence is there for me for at least a decent scalp.

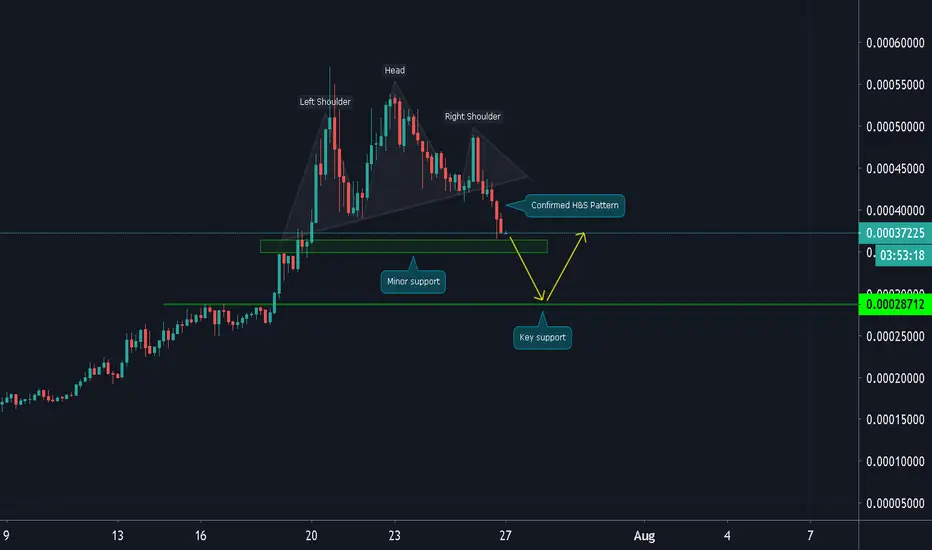
BAND/BTC (Bearish Pattern Confirmed)BAND/BTC
-The bearish H&S pattern has been confirmed after the break of the neckline
-Currently testing the minor support at 37000 range
-The next key support area is located around 28000
-This level is highly potential for Buyers to look for a bounce trade
-I will not catch a falling knife instead let the price come to me
BAND tries to start again BAND tries to push the trend line. Also it printed a hammer candle in 4H time frame. Hope that it's means the end of retracement.
BUT it's still risky cause this coin pumped about 400% this month and it's in the sky now !

Downward MACD, upward pricehi
Simple Moving Average 50 Above Simple Moving Average 100 and Simple Moving Average 100 Above Simple Moving Average 200
Convergence line above base line
High price of conversion line
High price base line
High price of Komo - Converse line above base line
P.S. as I don't use like-bots and other solutions that show great "interest" to my posts, I will be grateful if you support my work by your LIKEs and comment. Of course, if you can do it. The feedback from REAL people is priceless!
Disclaimer!
This post does not provide financial advice. It is for educational purposes only! You can use the information from the post to make your own trading plan for the market. But you must do your own research and use it as the priority. Trading is risky, and it is not suitable for everyone. Only you can be responsible for your trading.


BAND/BTC (Break Key Support?)BAND/BTC
-about to break the support at 12700s area
-if the daily closes a bearish candle
-we will likely see more downward action in the coming days
-a good rebuy zone is between 10500-9700

BAND - BTC My AnalysisI am looking position for bullish on BAND/BTC I am trying to buy between 0.00013450 - 0,000550 BTC Stop Loss : 0,00012000
Potential bullish 0,00014500
Guys don't forget to Click Like button for appreciate me.
Thank you so much.

BANDBTC testing resistance levelBANDBTC close above accumulation level at 13327 sats. Testing resistance at 13800.
Support level: 13189,12600.
Resistance level: 13800, 14400.
Pattern: Breakout of failing wedge.
Indicators: RSI above 50 points + , MACD above zero line +
Moving Averages: above 100 EMA, still bellow 200 MA and 200 EMA.

Band Tries to Break outBand rocket is about to fly ! 4H candle opens above the wedge trend line and if it's staying above that I think it's free too pump. Targets has been shown on the chart. Join this spaceship.

BAND/BTC - 4hr 200ema tap and 3IUBAND is ready to move.
Daily Kijun Bounce, 4hr 200ema tap which is now printing a 3 inside up! Bands gonna make her dance!!
Trade, Chart, Learn, Repeat
Coach K
@coachkcrypto

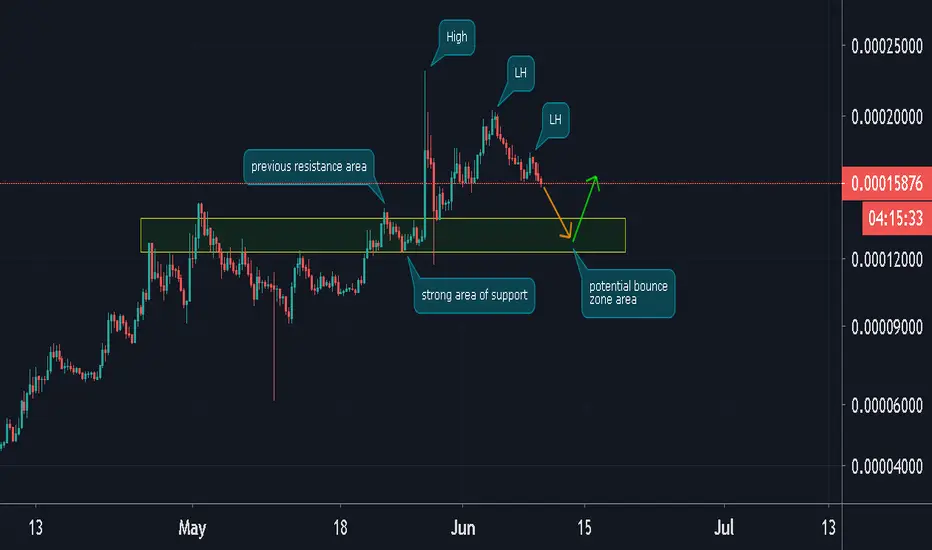
BAND/BTC (Short Term Downtrend?)BAND/BTC
-the price action is currently on a downtrend
-after hitting the top at 23000s
-if this downward action will continue
-the likely support will react is between 14000-12000s
-that's the key support area where potential bounce trade will happen
-if you will play a bounce trade setup
-please make sure to wait for reversal confirmation
-to reduce the risk of trade position
#BAND Looks Promising Bullish #BAND on 4hr Chart Pretty Nice Uptrend Coming to Breakout, targetting 18k and 19k

Band Protocol - Mainnet launch aheadAnother one interesting altcoin with mainnet launch in 2 weeks. Band Protocol’s public Wenchang Mainnet launch is going live on June 10, 2020.
I think in this case it can affect the price as it did in the case of THETABTC.
I'm waiting until price fluctuations become less and try to buy as low as possible, around 0.00016 BTC would be good (assuming BTC isn't falling to $7k at the same time ofc).
Briefly about Band Protocol: Scalable and decentralized real-time cross-chain oracle connecting smart contracts to external data sources. (sounds like Chainlink tbh)
Hit the "LIKE" button and follow to support, thank you.
Information is just for educational purposes, never financial advice. Always do your own research.
