BANDUSD

BAND TO 3X BAND is the new LINK. Expect BAND to break into the top 10 before EOY. It will continue to remain green as it becomes more and more of a competitor to LINK.

The BAND party may not be over yet, but for now it's a shortDisclaimer: This is not financial advice
In high leverage trading your entry is a matter of life or death, you need to have patience and to not let fear of missing out drive you into opening rushed positions. Map out your trades in advance and wait for the right entry. Our aim is to capture quick & safe profits, not to predict the future, this is possible only if we fight for a good entry. So if you're nervous and itching to open a position then take a few deep breaths and don't trade!
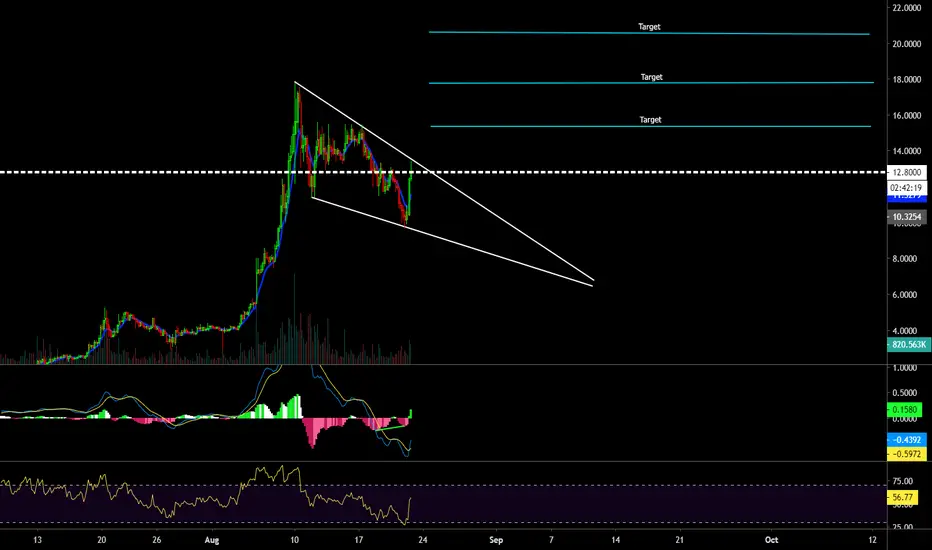
I'm looking at BAND again tonight, I have been bearish on this for a while now and we finally broke down a range where it had been stuck for almost 2 weeks. This 12.2-14.8 range is an important supply area that I don't think we will overcome soon. I think a retest of 12 is likely which would make for some great high leverage shorts. I do not trade the news, I trade the chart. As traders we cannot afford to trade rumors and the chart tells us that right now this is a short with target $7 (which should provide some support) and eventually 4.56 (the upper limit of the previous range). Why isn't the party over yet? Because a wave count suggests we might have just completed a wave 3, this confirms our short term bearish bias but leaves the door open for another ATH as wave 5. Beware though that a truncated wave 5 (very common in crypto, especially after strong pumps) would create a strong reversal signal.
Entry: 10-11 SL: 12 TP1: 7 TP2: 4.6

Band usdt Falling wedge Band usdt falling wedge breakout to the upside targets posted, bullish divergence on Macd
BAND/BTC (Short Term Downtrend?) BAND/BTC
-This coin is on a short term downtrend
-Its value has depreciated by over -40% from the High
-Technically, there is no strong support at current market price
-The area which is likely to react is somewhere around 72350 region
-This is a confluence of Golden Fib level, 200ma support, and previous resistance
-So the chance we might see a bounce up reaction is high
-I recommend opening Buy orders only if there is a bullish rejection
-Because this will give us extra confirmation of support is being built


BAND +50% ?BAND has been everywhere lately and it did listed to Coinbase yesterday. Usually when new coin gets listed on Coinbase there is pump and retrace which will lead to new leg upwards. Lets see if this triangle can catch new BAND pump.

BANDUSDT potential breakout gain of 70% gainBANDUSDT in an upside continuation structure after a massive run to the upside.
Comment, LIKE and Follow


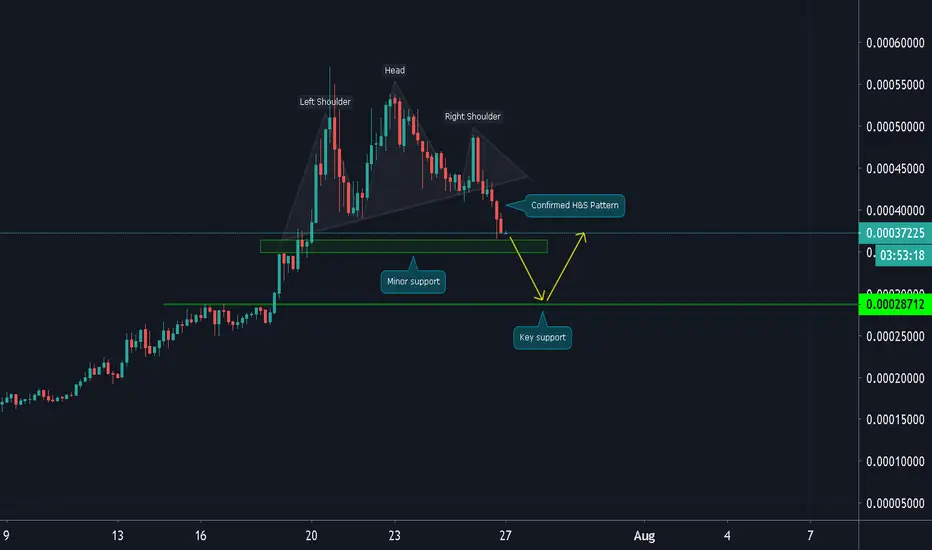
BAND/BTC (Bearish Pattern Confirmed)BAND/BTC
-The bearish H&S pattern has been confirmed after the break of the neckline
-Currently testing the minor support at 37000 range
-The next key support area is located around 28000
-This level is highly potential for Buyers to look for a bounce trade
-I will not catch a falling knife instead let the price come to me
BAND/BTC (Break Key Support?)BAND/BTC
-about to break the support at 12700s area
-if the daily closes a bearish candle
-we will likely see more downward action in the coming days
-a good rebuy zone is between 10500-9700

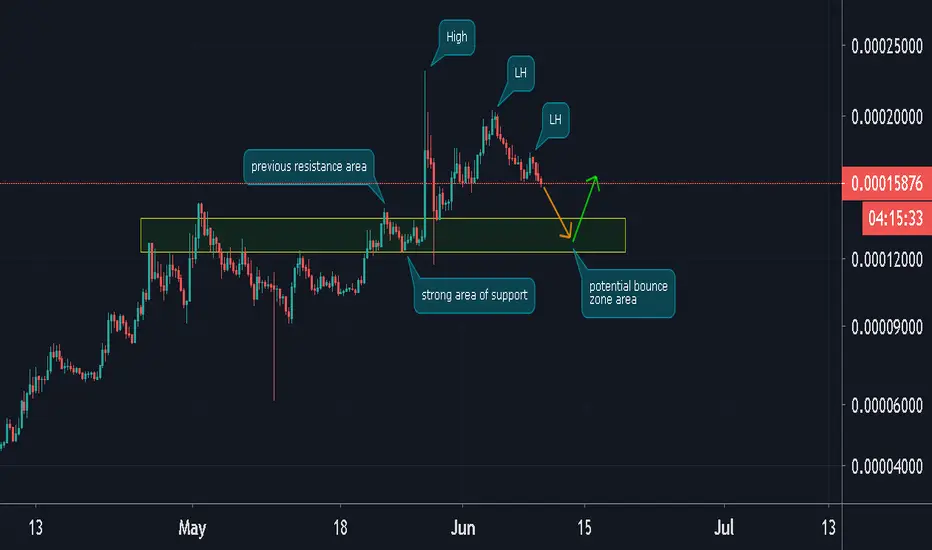
BAND/BTC (Short Term Downtrend?)BAND/BTC
-the price action is currently on a downtrend
-after hitting the top at 23000s
-if this downward action will continue
-the likely support will react is between 14000-12000s
-that's the key support area where potential bounce trade will happen
-if you will play a bounce trade setup
-please make sure to wait for reversal confirmation
-to reduce the risk of trade position
BAND/BTC (Last Pump? Bearish RSI?)BAND/BTC
-last March 6, Cross Ultimate Indicator signal priority is Long
-made another higher high after the breakout of consolidation
-reached previous top price at exchange history
-but the RSI is painting a bearish warning sign
-this could be the last leg before reversal?
-it is still too early to confirm this bear warning
-technically, the market is still rising strong
-I don't recommend to open buy order because it is becoming risky

BANDUSDT formed bullish BAT | Upto 44% expectedIn my previous post of BAND with US dollar pair we have seen that on short term hourly based chart the BAND formed bullish Cypher pattern and as per prediction the priceline took a powerful bullish divergence from buying zone and produced more than 10% profit on this very short term chart.
Formation of new BAT pattern:
Now again on short term 6 hour chart the price action of BAND has formed bullish harmonic BAT pattern and entered in potential reversal zone.
Buying And Sell Targets:
The buying and sell targets according to harmonic BAT pattern should be:
Buy between: $0.8835 to $0.8309
Sell between: $1.0088 to $1.1982
Stop Loss:
The potential reversal zone area that is up to $0.8309 can be used as stop loss in case of complete candle stick closes below this level.
Possible profit and loss ratio:
As per above targets this trade has the profit possibility of 44% and as per above mentioned stop loss, the loss possibility is 6%.
Note: This idea is education purpose only and not intended to be investment advice, please seek a duly licensed professional and do you own research before any investment.

BAND/BTC (Uptrend Still Valid?)BAND/BTC
-The indicator flashes Long Signal meaning priority is up
-the upward trendline is still valid
-minor consolidation is expected
-if current levels will hold
-we could see a retest of recent swing high
-no major red flag yet
-but the things are getting too extended to the upside

BAND/BTC (Sideways action before another leg up?)BAND/BTC
-bounces off at trendline support
-50ma acted as dynamic support
-if the upward trendline will remain intact
-there is a chance we could see another continuation
-break below trendline is our invalidation point

BAND/BTC (Early Sign of Weakness?)BAND/BTC
-the strong parabolic uptrend, over 70% up
-early bearish RSI sign
-approaching Fib resistance at 0.786
-upward trendline support still intact though
-not safe to enter a Long position
-wait for a pullback at key support before considering
-there is a lot of opportunity in this market

BANDUSDT formed bullish cypher | upto 12% move expectedFormation of bullish Cypher:
This time on short term hourly chart the price action of Band Protocol (BAND) has formed bullish harmonic Cypher pattern and entered in potential reversal zone.
Buying And Sell Targets:
The buying and sell targets according to harmonic Cypher pattern should be:
Buy between: $0.3131 to $0.3031
Sell between: $0.3210 to $0.3401
Stop Loss:
The potential reversal zone area which is up to $0.3401 can be used as stop loss in case of complete candle sticks closes below this level.
This idea is for short term traders not a long term idea; I will be keep posting more trading ideas.
Note: This idea is education purpose only and not intended to be investment advice, please seek a duly licensed professional and do you own research before any investment.

BAND/BTC (Bullish breakout?: up to 40% profit)BAND/BTC
BAND broke the descending channel to the upside but not enough follow-through.
But if this is the start of a 4H trend change, its potential upside target is up to 6000 sats area and key stop-loss is below 4200 sat.

