BANDUSDT


#BANDUSDT #4HHi guys..its the latest analyze chart of BANDUSDT in 4H time frame .if you are interested any crypto that you want analyze with me and any questions please do not hesitate and comment below the chart!
if u like it press like-comment and folow me.thx


BAND/USDT In Coming DaysHi every one
BAND / TETHERUS
AB=CD
The ascending triangle is broken and the price is well supported in 7.5 to 8.5 levels and the market is ready for the price pump
Remember that Trend is our friend and we have to hold his hand and go with it.
Traders, if you liked this idea or have your opinion on it, write in the comments, We will be glad.
Things can change...
The markets are always changing and even with all these signals, the market changes tend to be strong and fast
Thank you for seeing idea .
Have a nice day and Good luck.


BAND / USD - Trading Idea>18, TGT - 25-27, SL = Take calculated risk
Wait for candle close above 18.


BANDUSDTBAND is trapped in a parallel channel and is likely fluctuate in the channel and wont break the dynamic support/resistance
IF SO the pullback will be formed and will continue in the direction that break happened
and the parallel channel is bullish ofc . . .

🆓BAND Protocol/USDT Analysis (10/2) #BAND $BANDBAND is stopping at the strong resistance zone at 13-14$, if it surpasses this zone, BAND will increase strongly to 22-23$ by the end of February. But we need to wait for BAND to close a 1D candle above $14
📈BUY
-Buy: 13-14$ if A. SL if B
📉SELL
-Sell: 22-23$. SL if A
♻️BACK-UP
-Sell: 13-14$ if B. SL if A
-Buy: 8.75-9.25$. SL if B
❓Details
Condition A : "If 1D candle closes ABOVE this zone"
Condition B : "If 1D candle closes BELOW this zone"


Band protocol projection (long) squeezing up against key levelI predict Band will begin squeezing against the $13 key level. If we see this followed by a breakout Bands next target should be the $15-16.
If price breaks down below $11.4 the idea is invalid and we may spend some more time accumulating before lift off.

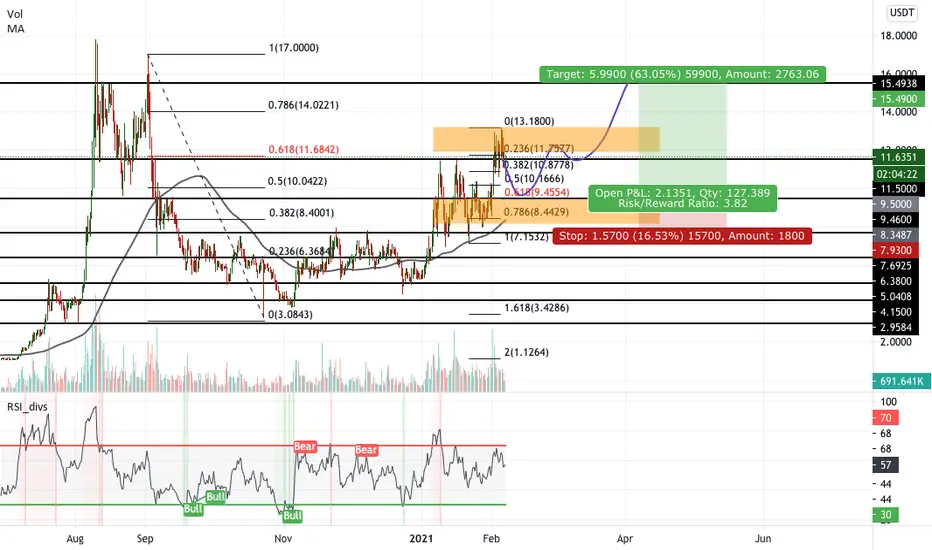
BAND/USDT - Another 63% setup after the correctionHello, Traders!
After an active trading week, the moment of correction is brewing in the market.
We see how the buyers were able to keep the price in their zone of interest between $8.16-9.46.
But from above in the range of $12.00-13.18 sellers are working, which do not allow to pass above their zone of interest.
In case of a correction, we can expect the buyers to defend their position and hence work together with them from buying.
Entry in the deal can be searched in a range of $9.25-9.55.
Stop Loss can be placed under $7.93
Price Targets:
$11.50
$13.15
$14.05
$15.49
Good luck and watch out for the market
P.S. This is not a piece of financial advice but only an idea I would be following myself

BAND update: BULLISH RETEST! GOOD REENTRY!sorry for messy chart, just wanted to get this out there quick.
BAND seems to have found support at the top of the previous ascending triangle it broke out from. It's now forming another ascending triangle (bullish pattern) before it moves higher. Right now the PA is at the bottom of the new pattern, which is the perfect time to reenter / increase position!
Bullish cross on Stoch RSI 4HR - good indication of a move to the upper area of the triangle (possibly higher) soon.
happy trades,
CD


BANDUSDTCup and handle pattern looking bullish
Personally waiting for breakout to enter
###NOT FINANCIAL ADVICE###
