BANDUSDT


BANDUSDT prices continuing upward from a descending triangle and now breaking all time highs supported by a buy2. i suspect a retest of the horizontal line, wait for 1d candle close above support

Don't miss the great buy opportunity in BANDUSDTTrading suggestion:
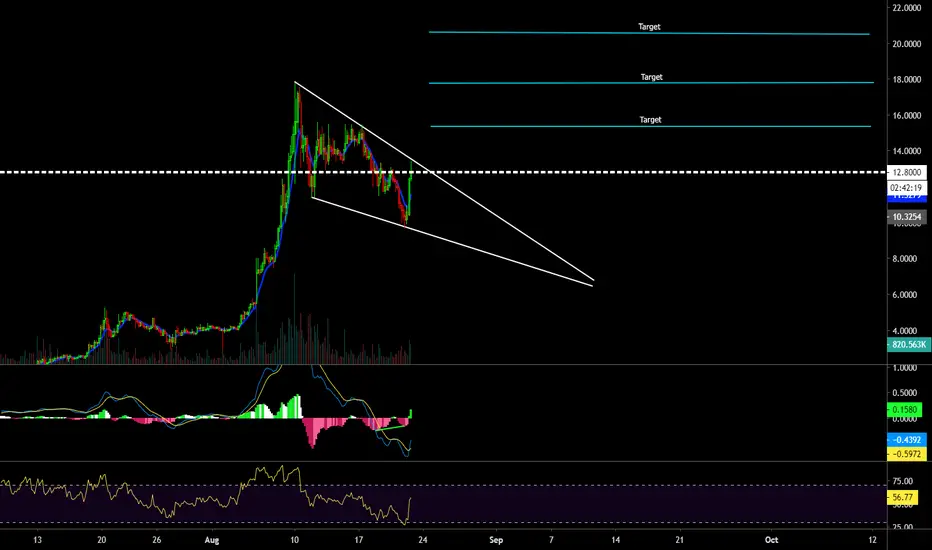
. There is a possibility of temporary retracement to suggested support line (12.68). if so, traders can set orders based on Price Action and expect to reach short-term targets.
Technical analysis:
. BAND/TetherUS is in a range bound and the beginning of uptrend is expected.
.The price is above the 21-Day WEMA which acts as a dynamic support.
. The RSI is at 65.
Take Profits:
TP1= @ 15.47
TP2= @ 17.76
TP3= @ 20.46
TP4= @ 27.15
SL= Break below S3
❤️ If you find this helpful and want more FREE forecasts in TradingView
. . . . . Please show your support back,
. . . . . . . . Hit the 👍 LIKE button,
. . . . . . . . . . . Drop some feedback below in the comment!
❤️ Your Support is very much 🙏 appreciated! ❤️
💎 Want us to help you become a better Forex trader ?
Now, It's your turn !
Be sure to leave a comment let us know how do you see this opportunity and forecast.
Trade well, ❤️
ForecastCity English Support Team ❤️

Don't miss the great buy opportunity in BANDUSDTTrading suggestion:
. There is a possibility of temporary retracement to suggested support line (12.68). if so, traders can set orders based on Price Action and expect to reach short-term targets.
Technical analysis:
. BAND/TetherUS is in a range bound and the beginning of uptrend is expected.
.The price is above the 21-Day WEMA which acts as a dynamic support.
. The RSI is at 65.
Take Profits:
TP1= @ 15.47
TP2= @ 17.76
TP3= @ 20.46
TP4= @ 27.15
SL= Break below S3
❤️ If you find this helpful and want more FREE forecasts in TradingView
. . . . . Please show your support back,
. . . . . . . . Hit the 👍 LIKE button,
. . . . . . . . . . . Drop some feedback below in the comment!
❤️ Your Support is very much 🙏 appreciated! ❤️
💎 Want us to help you become a better Forex trader ?
Now, It's your turn !
Be sure to leave a comment let us know how do you see this opportunity and forecast.
Trade well, ❤️
ForecastCity English Support Team ❤️


$BAND cup and handle playIf this closes above the resistance then it's game day baby. Buy me a coffee ;)

BANDUSDT price action analysisThis is my view on BAND, probable drop to around $8 and then run up to approx $26.
Are you holding Band on your portfolio, if so how much of it? Me I do, around 0.5%
Please let me know whats your view on band and how you trading it, share with your charts
Previous Band analysis on the related links
Comment, LIKE and Follow


BAND SHORT at RESISTANCE$BAND is looking pretty bearish as it hits an area of resistance and might continue it's short term DUMP.
We are still away from a possible triangle break and volume has been steadily falling off since the ATH of August 9th
I'm counting on BAND bouncing down from resistance and moving towards the previous area of support, with the 200 MA acting as further support for this.
Closing and breaking above the trend line will invalide all this of course.

BAND | If This Bull Flag Works Then A Big Rally Can Be TriggeredHi friends, hope you are well and welcome to new update on Band token. In my previous article we have seen that this token has surged more than 9000% after March 2020 up till now. Recently on the 4 hour small time period chart the price action of Band token formed a pennant and finally on 17th of August the priceline has broken down the support of this pennant.
The bull flag is still there:
If we switch on the daily time period chart then the expected bull flag is still there. The price action is likely to move up from 25 simple moving average. This is very positive gesture because before this the price action has been doing the same before the next bullish rally. For example if we watch the previous bull flag then there was a big distance between the price action and the simple moving averages. Then priceline moved little bit down and 25 simple moving average moved up to provide the support to the priceline of Band token. Finally using the support of this simple moving average the price action started the next bullish rally. Same move is likely to happen this time again. The price action of Band token was at high distance from the simple moving averages then it moved bit down and the 25 simple moving average also moved up and provide the support to the priceline. And now we can expect that the price action can start the next bullish rally from here.
Different indicators are turning bullish:
If we place the different indicators like MACD, Stochastic and Momentum on the daily chart. Then it can be easily observed that moving average convergence divergence (MCD) was strong bearish but now it has turned weak bearish. The Stochastic has also given bullish signals by giving bull cross, but the momentum indicator is still strong bearish. Once Momentum will be started turning bullish then it will be confirmed that the price action will start the next bullish rally from this bull flag.
Formation of new channel:
Now if we switch back to the small time period 4 hour chart. Then it can be noticed that after breaking down the support of the pennant the priceline of Band token has formed a new downturn channel. At this time the price action is likely to move to the support of this channel after being rejected by the resistance. Therefore the next few hours are very important, whether the price action will break out the resistance or breakdown the support. So we should keep an eye on the move of Band within this channel for next few hours. Once the price action will be able to breakout the resistance of this down channel then it will be a very strong confirmation for the next bullish rally.
Conclusion:
Even though the priceline of Band token has broken down the pennant on small-time period chart but we should also take care of stop loss. For that purpose we can use a support of the down channel that has been formed on the small time period 4 hour chart. If that support will be broken down then we can expect a powerful rally to the downside.

bull flag break out, ema cross, healthy rsi for growth. it seems like that while the btc bears are taking over band is heading upwards towards the 15.5 resistance on the 4hr chart.


Bull Flag for BANDWe can see a Bull Flag formation after the recent spike in BAND price and price bumped from previous support at 11.45ish.
If price goes down it'll likely retest support levels around 10.03 and 9.65 before going up (sentiment around band is good ATM).
If we break flag it's likely the price will retest resistance levels around 13 to 13,32. If we break resistance then we will likely se a retest at 15,3+ price.
It's noteworthy that Chainlink which is a competitor from BANDhas a similar chart at the moment so i'd keep looking at both charts to see what's going on.
Not financial advice, I started trading 4 months ago.
Comments and teachings/tips from more experienced traders are welcome!

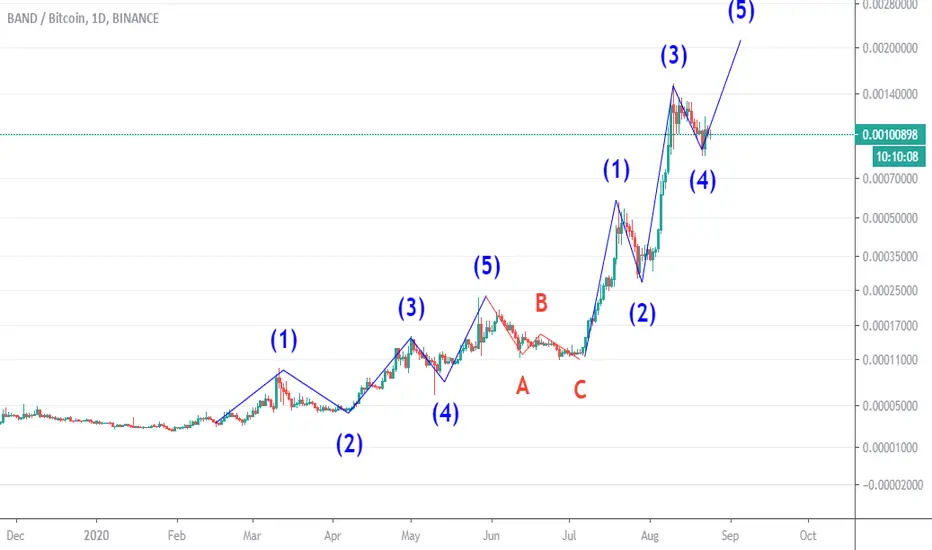
Elliot count on BANDHello, traders.
How far does the BAND can go? We believe that this asset is in on a long-term bullish trend.
We can finish the corrective wave 4 for this asset for the next upcoming days and, we can form another leg up with wave 5.
But be careful, this asset is way oversold on the weekly charts and we can start a corrective movement.
Push the like button and follow us on tradingview.


BAND TO 3X BAND is the new LINK. Expect BAND to break into the top 10 before EOY. It will continue to remain green as it becomes more and more of a competitor to LINK.

Band usdt Falling wedge Band usdt falling wedge breakout to the upside targets posted, bullish divergence on Macd
BAND/BTC (Short Term Downtrend?) BAND/BTC
-This coin is on a short term downtrend
-Its value has depreciated by over -40% from the High
-Technically, there is no strong support at current market price
-The area which is likely to react is somewhere around 72350 region
-This is a confluence of Golden Fib level, 200ma support, and previous resistance
-So the chance we might see a bounce up reaction is high
-I recommend opening Buy orders only if there is a bullish rejection
-Because this will give us extra confirmation of support is being built


