Really quick look at band. Bullish in very short term. The very limited data on Band suggests a decent size spike upwards is going to occur soon.
BANDUSDT

BANDUSDT potential breakout gain of 70% gainBANDUSDT in an upside continuation structure after a massive run to the upside.
Comment, LIKE and Follow

BANDUSDT analysisWe can buy at support and then looking for engineering robo signals for sell decision as the chart is at all time high.

ATC vs BAND/BTCHi, today we will look at one of the growth leaders this year.
The last movements were especially good and as we can see the ATS was able to determine start and the end of the trend just in time.
Script settings for 1D timeframe:
· Signal calculation type - "Low"


$BAND INSANE ALT PUMP | Easy Loot 100% Profit HitInsane trade we hit on BAND/USDT, unfortunately Tradingview posted my orginal idea private. I personally think we still have some room to run, it's alt-season after all.
70% RETURN ON BANG IN TWO DAYS!
This play was signaled 2 days ago inside of our crypto channel. I purchased about $1,000 at $7.313 avg , sitting up around 65-70%, if converted to a main coin will be more toward 100-110%. Doesn't look like BAND is done quite yet, updated my stop loss to guarantee 50% profit realized.
Original Entry: $7.313
Entry Now: $11.544-$11.72
Next TP: 7-8% rip
I myself will just update the stop loss and continue to ride it out.
Do not trade this, you will lose money
DotcomJack | The Michael Jordan of Tradingview


BANDUSDT AnalysisCONGRATULATIONS to people who bought BAND in the beginning of July from MOON signal, enjoy your 210.54% AMAZING PROFIT that you made in 1 month!
There are also green cloud & MA20-MA50 cross strategy present as a BUY signals.
If you bought BAND, do not hurry to sell as long as the candles are above the support level (4.57).
You can wait for EngineeringRobo's sell signals or if the candles open-close below the support level (4.57), you can go ahead and sell it.
If you haven't bought yet, there's a candle open-closed candle above the support level (4.57) & there are 3 BUY signals from Engineeringrobo.
So, I'm bullish and if you haven't bought yet, you can buy right now.

Bearish Crab #Band target 6.7$ BINANCE:BANDUSDT band is making a bearish crab selling at 1.618 fib extension. Hope you guys enjoy and hit the like button and comment

BANDUSDT ANALYSİSNow I have 2 negative 1 positive signals
we can not say anything because of we have no information about that level before. It is unpredictable
It is not a good idea to hold or to buy this coin at the moment
In April Buy2 and Moon signals brought x2 only 15 days and also buy3 did realy good job too
In May Buy3 and Buy2 signals brought %70 profit in 20 days if you followed only moon signal at that time you earned x4
In July Buy2,Moon and Buy3 signals brought x3 profit in 1 month
If you still didn't use EngineeringRobo please dm me .


BANDUSDT long 2x Spot Continuation on 1D/12H/6H BANDUSDT
Target 🎯 1- 6.7
2-7.4
3-8.4
SL 3.85
High Reward low risk
Entry below 6 USDT recommended.
RSI- Continution Bullish / crossing 50 & 60 on 12H and 6H
MACD - Turn around and Bullish bounce 0.0 line
Price Action - Bullish major uptrend
Pattern - Bullish Flag pattern/ Bollinger Bands shrinking
#Goes with BTCUSDT pair but more aggressive and BTCUSDT moving into an uptrend to help move BANDUSDT as well

BANDUSDT.. My first anaysis chart.. Will it go up or down?My first analysis chart.. Will it go up or down? Just having a wee play with the trend analysis tools.. It's hard to work out which way it will go from here. But i think it will follow the channels I've marked down.. I'm hoping it's upwards obviously haha!
Let me know if ya think the potential lines are accurate.. Also, can someone tell me where to find the arrow haha because i couldn't find it.. Cheers :)
Chart is in Month mode..


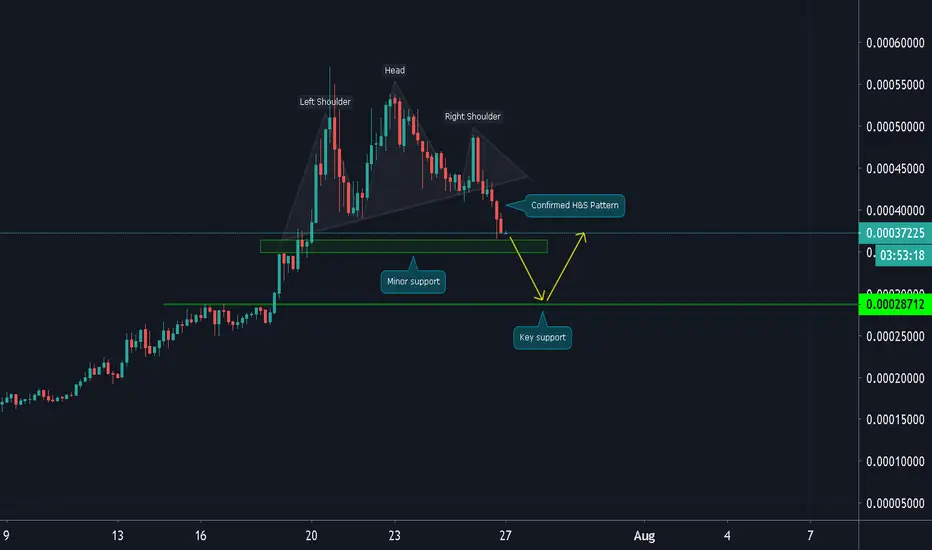
BAND/BTC (Bearish Pattern Confirmed)BAND/BTC
-The bearish H&S pattern has been confirmed after the break of the neckline
-Currently testing the minor support at 37000 range
-The next key support area is located around 28000
-This level is highly potential for Buyers to look for a bounce trade
-I will not catch a falling knife instead let the price come to me
BANDUSDT AnalysisI am mostly positive about BANDUSDT. Engineering Robo 2 is giving a Buy 2 signal. In addition, the MA 20 (blue line) is going over the MA 50 (yellow line) indicating that it is time to buy it. The trend has increased steadily and is currently just below the resistance line. If the candle opens and closes above the resitance line, I will buy it. If the candle goes down and breaks the support line below with an open-close candle, I will sell it.

BANDUSDT ANALYSISI am bullish in this coin. However, the best opportunity is signals of the EngineeringRobo because the last 2 candles passed the last horizontal line.

BAND/BTC (Break Key Support?)BAND/BTC
-about to break the support at 12700s area
-if the daily closes a bearish candle
-we will likely see more downward action in the coming days
-a good rebuy zone is between 10500-9700


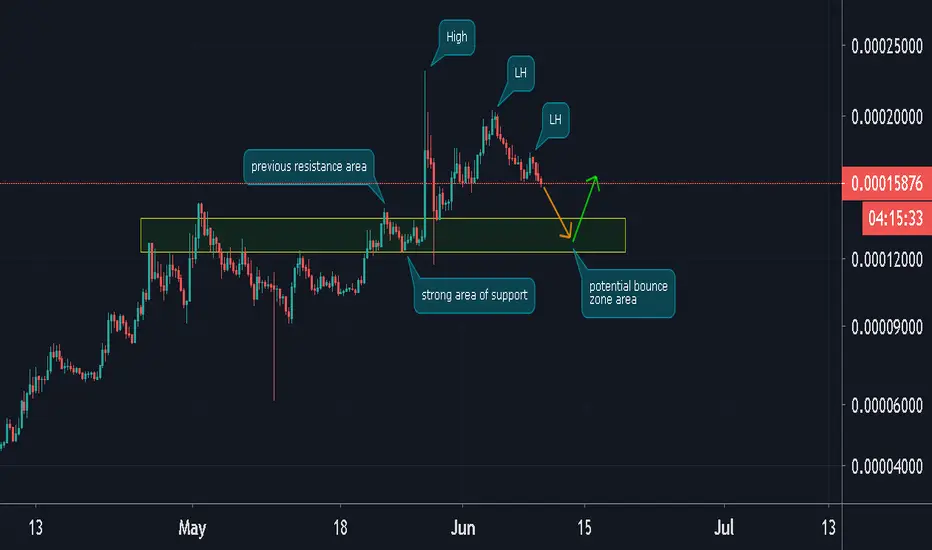
BAND/BTC (Short Term Downtrend?)BAND/BTC
-the price action is currently on a downtrend
-after hitting the top at 23000s
-if this downward action will continue
-the likely support will react is between 14000-12000s
-that's the key support area where potential bounce trade will happen
-if you will play a bounce trade setup
-please make sure to wait for reversal confirmation
-to reduce the risk of trade position