BAND/USDT – Massive Trendline Breakout! Reversal Play!📌 Chart Overview:
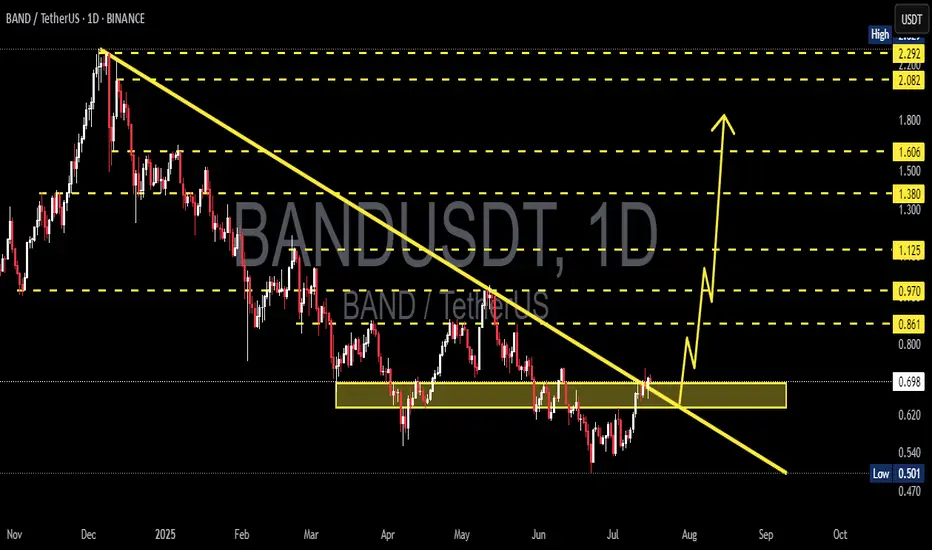
BAND/USDT has officially broken out from a long-term descending trendline that has suppressed price action for over 7 months. This breakout, confirmed with a bullish daily close above a key horizontal resistance zone ($0.68–$0.70), opens the door for a powerful trend reversal.
The structure signals the end of accumulation and the beginning of a potential markup phase, where volatility and volume often expand rapidly.
🔍 Technical Pattern Breakdown:
Falling Wedge Formation: A classic bullish reversal pattern formed after a prolonged downtrend. The wedge narrowed price volatility and concluded with a clean breakout to the upside.
Descending Trendline Breakout: The break of the major trendline marks a shift in control from bears to bulls. Historically, this is one of the strongest technical signals for a trend reversal.
Demand Zone Validation: The $0.60–$0.70 range has acted as a multi-month accumulation zone, with repeated rejections from the downside showing strong buyer presence.
✅ Bullish Scenario:
If BAND holds above the $0.68–$0.70 breakout zone, a strong bullish rally could unfold with the following upside targets:
1. TP1: $0.861 – Minor resistance, potential retest level.
2. TP2: $0.970 – Psychological resistance and historical flip zone.
3. TP3: $1.125 – Major horizontal resistance; a breakout from here could trigger FOMO buying.
4. TP4: $1.380–$1.606 – High-confluence zone from previous consolidation.
5. TP5: $2.08–$2.29 – Ultimate extension target aligned with macro resistance from November 2024 highs.
Each breakout above the target levels could lead to a short squeeze scenario, accelerating momentum.
⚠️ Bearish Scenario:
A failure to sustain above the $0.68–$0.70 level would invalidate the breakout and trap late buyers.
Breakdown back below the yellow zone could push price towards:
$0.60 – Key mid-support
$0.501 – The lowest support on chart; a break here would resume the downtrend.
Watch for volume divergence or fake-out signals on lower timeframes.
🧠 Market Psychology Insight:
This setup reflects a shift in sentiment. After a prolonged phase of apathy and seller exhaustion, smart money appears to be stepping in. The strong rejection from lows and breakout suggests early-stage bullish accumulation transitioning into public participation.
If volume increases along with upward price movement, it may confirm Phase C-D of a Wyckoff Accumulation, suggesting much higher upside.
📆 Timing Note:
Historically, July–September has offered volatility surges across mid-cap altcoins. With BAND breaking structure at this critical timing, early positioning could offer asymmetrical risk-reward.
#BANDUSDT #CryptoBreakout #AltcoinSeason #TrendlineBreak #BullishReversal #TechnicalAnalysis #FallingWedge #CryptoSignals #BANDToken #CryptoTA
Bandusdtanalysis
BANDUSDT 1D AnalysisBAND ~ 1D Analysis
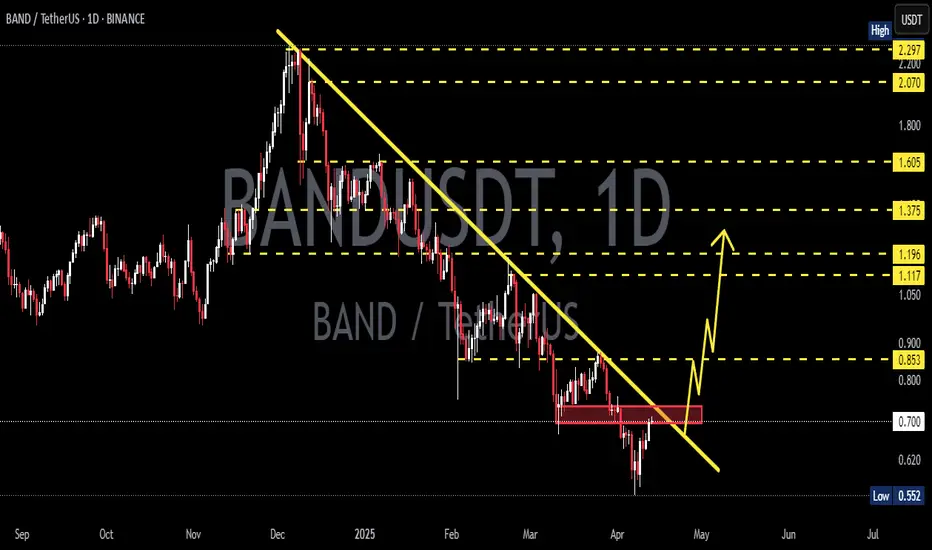
#BAND Buy when re -testing this support block with a short -term target of at least 15%+ from here.

BANDUSDT 1DBAND ~ 1D Analysis
#BAND Buy after successfully penetrating this resistant line with a short -term target of at least 10%+.
BANDUSDT 1WBAND ~ 1W Analysis
#BAND If you still have a Conviction on this coin. This support block will be a very good place of buy for now.

BANDUSDT 1WBAND ~ 1W Analysis
#BAND In Time Frame 1W continues to maintain this support block, buy from here if you still have a Conviction on this Coin with a minimum target of 20%+

BANDUSDT 1WBAND Update ~ 1W
#BAND If you still have Conviction on this coin. buy in stages from here. with a minimum target of 20%++, it is only a matter of time until this resistance line is successfully penetrated.

BANDUSDTBAND ~ 1W
#BAND This is an important support block that needs to be maintained.
If you have Conviction on this coin,. This support block would be a very good buy for now.

BANDUSDT 300% Potential!BANDUSDT Technical analysis update
BAND's price is bouncing from its major support zone after repeatedly testing the $1.00 support level. It has been trading in the $1.00-$2.50 range for the past 820 days, and a strong bullish move from the current level is anticipated.
Buy zone : Below $1.07
Stop loss : $0.87
Regards
Hexa

BANDUSDT 1WBAND ~ 1W
#BAND Must defend this support block, To stop the price decline.
Defending this support block, Bulls will be in control. losing this support Price will visit the nearest support that we have marked

BANDUSD 1WBAND ~ 1W
NASDAQ:BAND Make purchases gradually on this support block. with a minimum target of 15%+. So far this support has been able to hold the price of $BAND.

BAND/USDT It's ready continue upward movement, Perfect retest.💎 BAND has recently exhibited notable market dynamics, experiencing a perfect bounce from the support area around 1.86, which previously acted as resistance.
💎 Currently, BAND the price is climbing upward, with the probability of reaching our target strong resistance area.
💎However, if BAND retraces back to the support zone and fails to bounce, resulting in a breakdown below support, this could indicate weakness in the market. Such a scenario might lead to further downward movement, potentially revisiting the demand area around 1.49 or even the Bullish Order Block (OB) area near 1.31.
💎 if BAND reaches the demand or Bullish OB area, it's crucial for the price to bounce and attempt to break out above the resistance level to sustain upward momentum. Failure to do so could result in continued downward movement, with the price potentially declining even further.

BAND/USDT Breakout and Accumulation Zone BreakoutBINANCE:BANDUSDT
BAND/USDT breakout and accumulation zone breakout
BAND/USDT has broken out of the downtrend line and the accumulation zone, signaling a potential bullish reversal. The price has shown good strength over the past 40 days, trading within a range of 0.95 to 1.17.
This breakout suggests that buyers are gaining control and that the price could move higher in the coming weeks. The immediate targets are 1.27 and 1.40, with a stop loss below 0.96.
However, it is important to note that the cryptocurrency market is volatile and that prices can move quickly in either direction. It is always advisable to do your own research and to trade within your risk tolerance.
Disclaimer: This is not financial advice. Please do your own research before making any investment decisions.

BAND has a very good investment OpportunityHi Everyone;
today we have one of the best risk to reward Investment opportunity
it is more than 757 times the risk and the chart is look very promising.
I expect breaking the previous bear market key point will clear the way to the final target

BAND Token Analysis 10/03/2021we had analyzed this token earlier and capitalized on it. New Update and Positions are taken in this Publication.
Fundamentals:
Band Protocol is a cross-chain data oracle platform that is able to take real-world data and supply it to on-chain applications, while also connecting APIs to smart-contracts to facilitate the exchange of information between on-chain and off-chain data sources.
By supplying reputable, verifiable real-world data to blockchains, Band Protocol unlocks a range of new use cases for developers to explore — since they can now use any type of real-world data as part of their decentralized application (DApp) logic, including sports, weather, random numbers, price feed data and more.
Band Protocol initially launched as an ERC-20 project on the Ethereum blockchain in September 2019, but transitioned to the Cosmos network in June 2020 with the release of Band Protocol 2.0. The new protocol is built on BandChain using the Cosmos SDK. Oracle nodes on BandChain not only relay data but are also involved in block production/validation, giving them a dual role.
BAND is the native token of the Band Protocol ecosystem and is used as collateral by validators involved in fulfilling data requests, as well as the main medium of exchange on BandChain — being used to paying for private data.
Band Protocol is designed to be faster and more efficient than competing oracle solutions and is also compatible with most blockchain and smart contract development frameworks — ensuring reliable data can be fed to and from multiple different blockchains.
To achieve its cross-chain data transfer, Band Protocol plans to leverage Cosmos' still in-development Inter Blockchain Communication (IBC) protocol. It remains unclear how long it will take until the IBC is operational and ready for use.
Band Protocol is designed to offer permissionless oracle creation, allowing anybody to start servicing data requests. It also offers extremely simple smart contract integration, allowing developers to begin using data from Band Protocol oracles with just a few lines of code by calling on a predefined interface.
Band Protocol was founded in 2017 by Soravis Srinawakoon, Paul Chonpimai and Sorawit Suriyakarn.
Soravis Srinawakoon, the current CEO of Band Protocol, is a former software engineer at Ericsson and management consultant at The Boston Consulting Group. Paul Chonpimai, on the other hand, is Band Protocol's CPO, and a former web developer at Turfmapp and engineer at Tripadvisor. Lastly, former software engineer at Dropbox and Quora Sorawit Suriyakarn is Band Protocol's current CTO and a gold medalist competitive programmer.
In addition to the founding team, the Band Protocol LinkedIn page currently lists a total of 20 additional employees, most of which are scattered throughout Asia, and include designers, developers and engineers. The platform is also supported by major global investors, including Sequoia Capital, Dunamu & Partners, Spartan Group and Binance.
Technical Analysis:
as earlier we had 3 Targets and the price as Triggered our 2 TP which is the 161.8% (Extension) Zone of Fibonacci Projection of the initial Impulsive wave after the Accumulation Phase.
it means now we have the confirmation of our past 3TP and current 2TP (25.5$,)which is 261.8% of the same Fibonacci Projection.
currently we have 3 targets
1TP: 18.5USD
2TP: 25.5USD
3TP: 32.33USD
we may have some price correction and Retracements after achieving 2TP, before the price start rallying to the 3TP.

Band 100% Bullish Move Loading Bandusdt
Band Usdt Symmetrical Triangle Pattern Breakout Already Confirmed on 4h timeframe
Higher time-frame descending channel breakout & retest already done
Expecting 100-300% Bullish Move Incoming Days
Manage risk & do your own research
If you are satisfied with our work join

BAND USDT inverted cup and handle pattern 1 Hr TF. BINANCE:BANDUSDT As per my analysis, an inverted cup and handle pattern was formed in 1 hour of time.

BAND Protocol. Target for price growth 100+%Soon, the crypto market will enter a period when altcoins will start shooting up so much that it will be very difficult to keep up with buying them all.
Consolidation is a long position (either short or long). Given the fact that the downward trend in the crypto market has been going on for almost 2 years, the assumption that a global trend reversal is now taking place is more than realistic.
In our opinion, it is worth paying attention to altcoins whose price charts are undergoing prolonged consolidation and are nearing their logical conclusion.
For example, a quick analysis of the BANDUSDT chart:
1. The first powerful upward shot of the price was back in November 2022, a month before the entire crypto market started to grow. So there are buyers, they are strong and aggressive.
2. The protracted consolidation has been going on for almost 5 months, at the theoretical bottom of the trend. This means that the realization of such a long accumulation will be upward.
3. The ideal level for buying BAND is $1.50. The safe level for buying BAND is $1.70 (after the consolidation is over)
4. The medium-term resistance level is $3.30, the long-term target, where it would be cool to sell BAND at $7-8.50
How do you analyze projects?
What trades are you interested in: short-term trades for 5-10%, medium-term trades for 20-100%, or long-term investments with a 100%+ return?
What ideas are more interesting to you: with text or just with arrows where to buy and where to sell?
Share your thoughts in the comments
_____________________
Did you like our analysis? Leave a comment, like, and follow to get more

Band USDT Double Bottom After Bearish Trend end in 4 hr ChartBINANCE:BANDUSDT Band USDT Double Bottom After Bearish Trend end in 4 hr Chart. Long Trade Setup After Break of L.H.

Bandusdt | Ready For Breakout | Want Complete Entry ?Bandusdt
Getting Ready For Breakout Incase Of Successful breakout expecting good bullish move , wait for confirmation & Always Look For Perfect Entry
Dyor
Trade With Your Oun Research

BAND protocol formed bullish Gartley for upto 95% pumpHi dear friends, hope you are well and welcome to the new trade setup of BAND protocol token.
Our last harmonic trade setup of BAND was as below:
Now after a long-trim, on a daily time frame, BAND has formed a bullish Gartley pattern.
Note: Above idea is for educational purpose only. It is advised to diversify and strictly follow the stop loss, and don't get stuck with trade

BANDUSDT Bouncing From The Major Support Zone.BANDUSDT Technical Analysis Update.
BAND price multiple times touches it's support zone, now reversing from the support zone.
Buy zone : $1.26 - $1.285
Stop loss : $1.149
TP 1 : $1.39
TP 2 : $1.510
TP 3 : $1.64
Always keep stop loss
Thanks
Hexa

BANDUSDT - Falling Wedge PatternBANDUSDT (1D Chart) Technical analysis
BANDUSDT (1D Chart) Currently trading at $5.5
Buy level: Above $5.5
Stop loss: Below $3.2
Target 1: $7
Target 2: $10
Target 3: $15
Target 4: $23
Max Leverage 2x / Spot market
Always keep Stop loss
Follow Our Tradingview Account for More Technical Analysis Updates, | Like, Share and Comment Your thoughts

BAND USDT CHANCE FOR BUYINGThere is a chance for taking a buy position on Band/USDT, Band price has broken the blue trendline, this means the downtrend is weaker right now, the red horizontal line is invalidation point for buying, this means we should cancel buy position if Band price break the break and close beneath the invalidation point, the short term target is target 1, the mid term target is target 2 if Band still on uptrend, we should take this opportunity because the risk is smaller then the reward, if there is a comment or suggestion please comment below, I am open to learn
