BANK
Buy GJ!! 100 Pipsclearing have broken and trading above quarter points and have a deep C retrecemnt which will lead us to a shorter D retracement at -.27 which coincides with a MAJOR QP. trendiness have been broken on lower time frames to confirm. Bullish engulfing with minimal draw back would be even more confirmation.
CWB: Upside Canadian Bank; Look Hard for Value in 2020CWB is mostly an "unheard-of" Canadian bank, but still 'big enough' to offer shareholders decent gains and capital appreciation. In-fact, it ranks as one of the top consistent dividend hiking companies with a streak spanning near 30 years - far better than any other bank in Canada/USA!
2020 will be a year where looking for value will be harder and harder as P/Es approach a whopping 30-50 on average for many companies, and P/Bs surge into double digits.
Some of my top value stocks include CWB, CU, Canadian Energy (SU, CNQ, ENB, TOU) and US Energy (FANG) and many precious metals stocks (or etfs, or the physical).
With low interest rates here to stay, I am not big on the financial sector, however, I believe investors will slowly realize soaring government debt will remain a disaster and never be paid back - as such, yields will rise, DXY will fall, precious metals and commodities will rise, and treasury influxes will decline. This should keep financials relatively stable in 2020 with perhaps a 5% gain (after we get out of the 2020 early short). This will also be the catalyst to let precious metals soar from 2020 and onwards, and allow energy stocks as a whole to rebound quite heavily in 2020/2021.
--
Happy New Year Everyone! Invest smart and look for value.
- zSplit
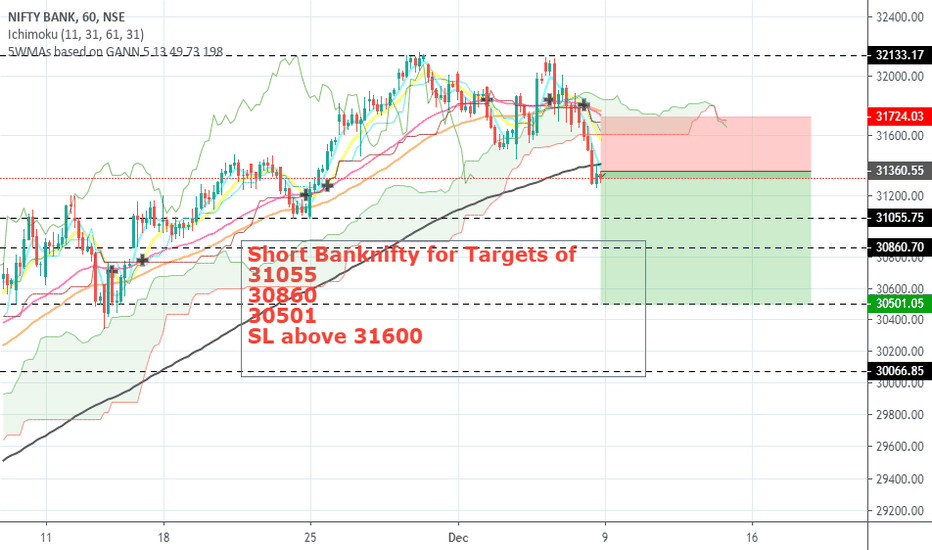
BANK NIFTY BEARISH CRAB PATTERN FORMED IN 1 HRHI EVERYONE!
MY VIEW ON BANK NIFTY IS FORMED BEARISH CRAB PATTERN FORMED IN 1 HR
TARGET 26920 IT WILL ACHIEVE WITHIN THIS OCT MONTHLY EXPIRY
GO FOR SELL
I RECOMMEND DO THIS TRADE IN OCT MONTH PE OPTIONS..LESS INVESMENT HUGE PROFIT IS THERE!
LET"S WE WAIT FOR 26920
THANK YOU EVERYONE..!
KEEP SUPPORTING..!
BANK NIFTY SPOT CHART BEARISH BAT FORMATION IN 4 HR TIME FRAMEHI EVERYONE!
MY VIEW ON BANK NIFTY SELL DUE TO BEARISH BAT PATTERN FORMATION IN 4 HR TIME FRAME
GO POSITION BANK NIFTY FUTURES SELL ORELSE BANK NIFTY MONTHLY EXPIRY ATM PE OPTION STRIKE PRICE BUY
TARGET 1-28800
TARGET 2-27700
THANK YOU!
KEEP SUPPORTING!!
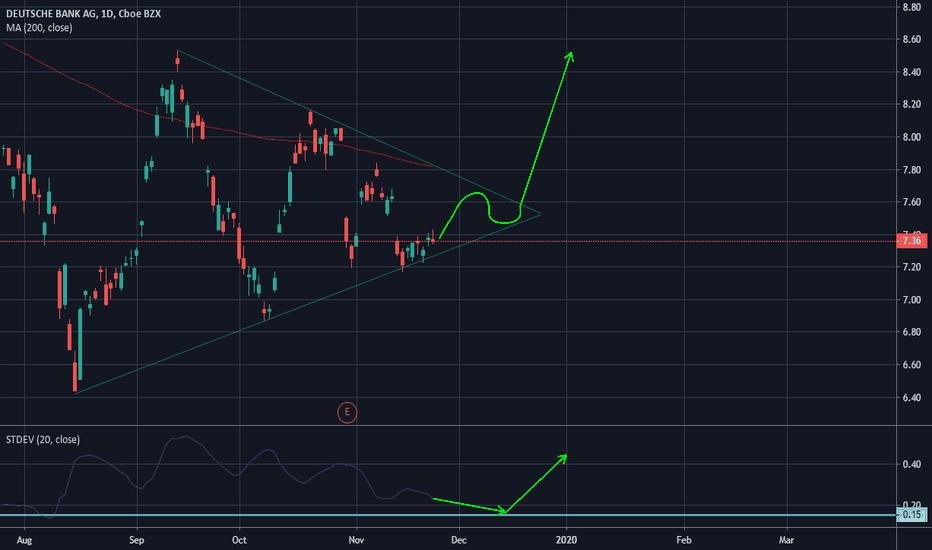
Is DB Possibly Bullish?Hmm, I am interested to see how this idea is received. I do think there is a possibility it moves back down, but what I know for sure is that there is going to a decent move as volatility is low. It has spent an extensive time below the 200-day avg, but the fundamentals aren't completely in its favor so that is for good reason. If it does move Long, I think that it would be purely based on sentiments of the new vision that the bank has for itself.
Siauliu Bank Long?Attention!
-SAB1L 200MA getting closer to 50MA
+Last time 50MA was above 200MA for nearly 3.5 years, now it is about 0.5 year
+RSI is at the lowest level during this year
+P/E at 5.46 is one of the lowest in NASDAQ Baltic
+ Price to Book value 1.09
Possibly good entrance point?
My guess is YES, keeping in mind last dividend yield of 6%
Deutsche Bank LongNYSE:DB
Entry - $7.60
Target 1 - $8.30
Target 2 - $9.65
Target 3 - $12
Stop loss - $6.79
DB is at an important Fib level as well as showing Bullish Divergence.
Be aware that this is a contrarian play and a countertrend trade. However, this area has a good chance of being a medium term bottom and we might be catching a trend reversal here which can be very powerful.
I plan on taking a 100 share position and selling calls against it on the way up as we hit important fib levels/moving averages.
Trade at your own risk and remember, this is not financial advice and I am not a financial advisor. Do your own research and due diligence.
LET THE MARKET SHOW YOU WHERE TO GONotice the 5 touches of previous resistance marked by the blue arrows. This "strong level" entices people to sell and place their stops just above the level. See how price begins to fall from this level marked at the red arrow? This also draws more sellers into the market; people don't want to miss out; then BOOM! Price breaks the level and wipes out everyone who shorted earlier. The banks know people place stops here. It is great liquidity for them to take then drive price further down. Think of it like this, if you could enter above the level with a sell order you are already getting a better entry price. Currently CHF and JPY are strong as they are safe haven currencies, so it is a good time to short commodity currencies against them. I'm in this trade. Results to follow.
SEB (SEB_A) | Money-Laundering Concerns! Keep an eye on ~60!Hi,
Shares of SEB' AB (Skandinaviska Enskilda Banken AB provides corporate, retail, investment, and private banking services in Sweden and internationally) fell by more than 14% (on Friday) as investors worried that another Nordic bank will be dragged into the scandal over money-laundering. It is hard to say, how the following weeks/months may affect the SEB price (investigations are ongoing) but anyway, I would like to point out a technically strong price level which should play an important role in further price action.
Currently, I can only recommend - stay away from it. The price can get more hits during the investigations, especially when these stories get firmer confirmations.
To talk about that price level - my eyes are pointed around 60. It needs to fall another ~25% to the mentioned level and definitely, it is doable. I don't want bad but as an investor and trader, I'm looking forward to this level because technically, it is a pretty strong and clean one.
Two other major Scandinavian banks, Swedbank and Danske, had already been subject to major investigations in large-scale money laundering activities and I would like to share a comparison with Swedbank, who has already gone through it (almost):
As you see, the historical similarities have been pretty amazing. Now, we can take this Swedbank price movement as an example (Swedbank price is the orange line) and it is pointed also to my mentioned "keep-an-eye" level 60. Let's count the other criteria which should act as support levels:
1) Okay, the comparison with Swedbank is pointed to the marked area.
2) 2000/01, 2011 clean resistance levels start to work as a support level.
3) The middle number 60 itself should work as a tiny support level.
4) Channel projection bottom trendline may push the price upwards from the green area.
5) Different Fibonacci Extensions are adding strength to the shown area.
6) Fibonacci retracement 50%. Pulled from 2009 low to 2015 high.
7) AB=CD
8) If the price reaches to the shown area, then it has fallen from the 2015 high at 111.50 to the ~55, which is 50% from the recent high and pretty often stocks make a bounce after they have fallen approximately 50%. So, it matching perfectly with our mentioned area.
9) Obviously, perfect would be a bullish Weekly or Monthly candlestick pattern formation around the green area!
Summary: As said, stories around the SEB' stock are serious which makes this stock extremely risky to invest/trade at the current price levels.
Be patient, wait for conclusions and if the conclusions are enough for you to be satisfied (after the price has reached ~60) then this could be a perfect spot and timing to invest or reinvest to SEB'.
What if it doesn't reach to the mentioned area? Nothing(!), the situation around Nordic banks is highly risky and I search only high-probability investment setups, not the mediocre ones. Mediocre setups can easily damage my success rate, especially under such conditions.
If it was helpful then take a second and support my effort by hitting the "LIKE" button, it is my only fee from You!
Regards,
Vaido


