SBK Corrective Structure - Effort To BreakStandard Bank Group Ltd. is the ultimate holding company for the group’s interests and is a leading African financial services group with South African roots. The group is South Africa’s largest banking group by assets and currently operates in 20 countries in sub-Saharan Africa. Their strategic position enables them to connect Africa to other selected emerging markets and pools of capital in developed markets.
Technicals
Weekly: A predominant uptrend on SBK has been evident for a few decades now although there have been a few significant pullbacks. The current structure formation leads me to believe that we are in a large correction at this point in time. I expect some recovery soon and then will be looking for wave 3 of the correction to the downside. I expect this wave to complete on the support of the underlying trend where I will be looking for a reversal to enter the long.
Daily: There has been a break of the downward trendline but I am not convinced of the reversal as yet. I will wait for a confirmation structure on a smaller time frame before entering the long for wave 2 on the weekly time frame.
BANK

Buy AUD/JPY 82.34 Pending Order:
Buy AUD/JPY: 82.34
TP: 82.46
SL: 82.22
Please follow me to see more quality trades analyzed.


How do you breakdown your chart?Hopefully, my annotations are simple enough. It is classic Sam Seiden but with a twist from my own experiences as a trader. I entered this trade when price was in the supply zone and i will be looking to close it in the next 2 hours...depending on the candle formation.

25630-25730 may act as resistance zone25630-25730 may act as resistance zone
Bullish Trend only above 26000

Shorting GBP/CAD on 4 H !!!Shorting GBP/CAD on 4 H. Financial markets will focus on political events, such as the Brexit negotiations.


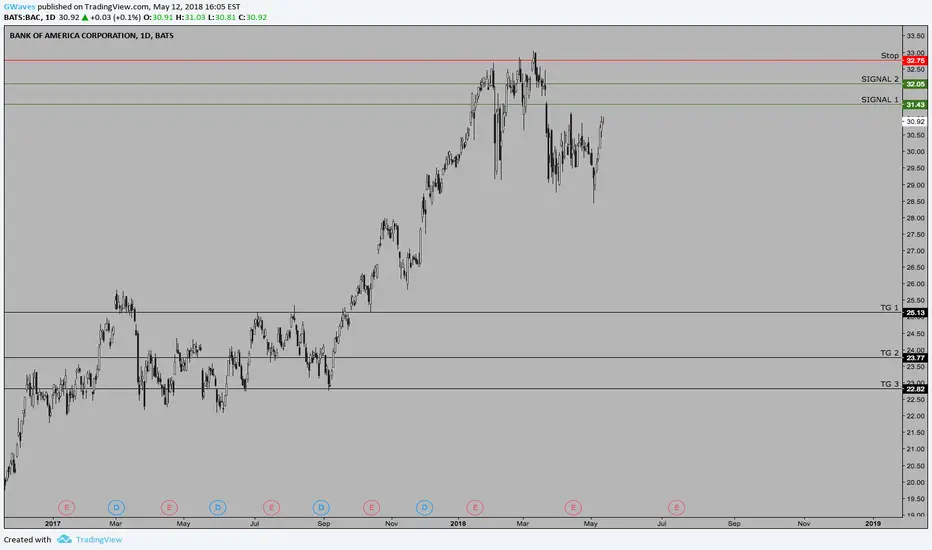
Cash it with BAC
With interest rates rising — and deposit rates staying at low levels — the company has been able to generate substantial profits
Net income jumped by 33% to $6.8 billion in the last quarter
"Yet it seems like a good bet that the momentum will continue. The Federal Reserve has indicated there will be two rate increases this year and another three in 2019"
Target price according to fundamentals - $34.57 per share


Another triangle!, Eyes on ECB 7-23-18Any surprises at the ECB policy meeting and press conference in Frankfurt on 7-26-18 could send EUR/USD rocketing in one direction or another. Also of intense interest is what the dollar is doing obviously, it is still range bound as shown in the attached idea.

Bank of America Short signalTriangle has been completed for BAC since the beginning of the year. Price broke MA 200 which has represented a prominent support so far. MA 50 and MA 200 are close to each other. MA 20 broken with volatility stop on negative configuration. Due to the restricted volatility accrued since the beginning of the year strong price movement will be expected!

Shortsqueeze in JPM.We are approaching sellers, I'd like to see their hand before I put my chips on the table.
This happened after earnings which makes it significant.


SING, Singlepoint INC. High Risk Trading, Massive potential.Lets keep this one kinda simple.
I've been watching SING for quite some time now, and before I started charting, had seen the last rise from 250 to 600, which has lead me to start charting this as well for future reference.
Some things to note, this year SING has been fairly active, with a soon to be Crypto wallet release and MMJ -3.12% involvement along with recent news of their delivery system.
If you zoom out, we can see a semi weird chart, and a huge "wedge". I've drawn a wedge inside the bigger wedge for a potential breakout to the top area of the wedge , or failed breakout to the bottom of the wedge where I've labeled a safer green buy zone.
We have some buy signals on the 4 hr 0.56% , but nothing to be buying on. You can also see the Ichimoku crossing bullish for a moment, and now directing to a bearish cross once again, but not yet.
This is a short trade, as I wouldn't hold this for longer then it takes to reach its wedge walls, with possible 50% to 350% gains from the buy zone to top of wedge .
This is not a trade I would recommend since you could loose just as much as you gain, I play with this one for fun, fun coupons!

EURUSD Pt 2.Take a look at my previous EURUSD analysis to undertsand my targets and S/R :)
Take your own position and respect your money management

Lagging span line (Chikou span) still testing 16.924 resistanceThe price of $16.924 is still resisting (is a resistance).
The lagging span (and so the price) is actually testing this resistance.
There is still a high probability of having the price getting over this resistance.
That would confirm the uptrend in daily timeframe.

Forecast for Bitcoin Ft. XRPUSDT THOUGHTS?!
Thoughts? Hyperbolic state coincedentally occurs on jun 12/13 NK + SEC summits?!?! Hmm.. McAfee's shilling expo on the 6th .. interesting

CBA - Time for an accumulation?The price has been falling since early 2017 from the peak around $88.00.
This drop has been a "healthy" one as we are seeing this as a correction for a longer term accumulation to the upside.
Some quick fundamentals to support the upside -
1) Revenue has been increasing for the past 5 years;
2) Net income has been increasing for the past 5 years;
3) Dividends have been increasing for the past 5 years;
4) FCF has been fluctuating up and down, but has greatly increased for the TTM; and
5) Net margin has been increasing for the past 5 years.
On the technical side of analysis, $66.50 to $68.62 present a very decent area for accumulation, potentially towards $75.59 and $77.23.
We are looking at this setup as a potential dividend play trade as well, which mean we are interested to hold on to this trade for a longer term.
**This analysis alone DOES NOT warrant a sell trade immediately. Before you enter any trade in the financial market, it is very important that you have a proper trading plan and risk management approach.
The sharing of this idea is neither necessarily indicative of nor a guarantee of future performance or success.


#HSBC is now below its 200EMAHSBC is now below its 200 EMA
It still has to break 705 though and horizontal resistance will be stronger.
Also it's weekly chart is still in an uptrend.
Wait and see.
