Review and plan for 21st April 2025Nifty future and banknifty future analysis and intraday plan in kannada.
Quarterly results.
This video is for information/education purpose only. you are 100% responsible for any actions you take by reading/viewing this post.
please consult your financial advisor before taking any action.
----Vinaykumar hiremath, CMT
BANKNIFTY

Nifty Closes 1000 Points Higher – Will It Catch Up with BNFIn a strong move, Nifty 50 surged by 1000 points to close at 23,851, compared to last week’s close. The index made a weekly high of 23,872 and a low of 23,207. As highlighted in last week's analysis, a breakout above 23,400 could push Nifty toward 23,900 — a target it missed by just 23 points.
However, an intriguing divergence has emerged between Nifty and Bank Nifty. While Bank Nifty has scaled a new all-time high, Nifty still trades significantly below its previous all-time high of 26,277. This sets the stage for an interesting dynamic: Will Nifty rally to close the gap, or will Bank Nifty face a correction?
What to Expect Next Week?
For the upcoming week, Nifty is expected to trade in a range between 23,200 and 24,414. Despite the bullish signals on the daily and weekly timeframes, the monthly chart remains weak, indicating that volatility is likely to persist until a broader trend confirmation.
S&P 500 Outlook: Bounce or Breakdown?
The S&P 500 index saw a mild pullback, closing around 80 points lower from the previous week’s close of 5,363. Our “sell on rise” strategy mentioned last week worked well, as the index dipped post-rally.
Now, things get technically interesting. On the weekly chart, the S&P 500 is forming a potential bullish W pattern and an inside bar. A breakout above the previous week's high of 5,481 could trigger upward targets of 5,551, 5,637, and 5,679.
However, on the downside, a break below 5,115 would reintroduce bearish pressure, which could have negative ripple effects across global markets.
Key Market Takeaways:
Nifty 50: Strong rally, but still below ATH. Watch 23,200–24,414 range next week.
Bank Nifty: At ATH, diverging from Nifty – crucial to monitor.
S&P 500: At a technical crossroads – potential for breakout or breakdown

SBI: Inverse H&S BreakoutThe Inverse Head and Shoulders pattern is a bullish reversal chart pattern that signals a potential trend reversal from bearish to bullish. It consists of three key components:
Structure of the Pattern:
Left Shoulder: A price decline followed by a temporary rally.
Head: A deeper decline forming the lowest point, followed by another rally.
Right Shoulder: A decline similar in size to the left shoulder but not as deep as the head, followed by a move higher.
Neckline: A resistance level that connects the highs of the two rallies after the left shoulder and head.
The Inverse Head and Shoulders pattern in SBI, with a neckline at ₹783, indicates a potential bullish reversal. The stock has formed a well-defined left shoulder, head, and right shoulder, suggesting that selling pressure is weakening. The target price for this breakout is ₹900 calculated by measuring the distance from the head’s low to the neckline and projecting it upwards. If the stock sustains above the neckline, it could gain further momentum. However, traders should consider placing a stop-loss at 730 to manage risk in case of a failed breakout.

[INTRADAY] #BANKNIFTY PE & CE Levels(17/04/2025)Today will be gap down opening expected in index. After opening if banknifty starts trading below 52950 level then downside movement possible upto 52550 level. 52550 level will act as a strong support for today's session. Any downside rally can be reversal from this level. Upside rally expected if banknifty starts trading and sustain above 53050 level. This upside rally can goes upto 53450+ level.

Review and plan for 17th April 2025Nifty future and banknifty future analysis and intraday plan in kannada.
Result stocks, swing ideas.
This video is for information/education purpose only. you are 100% responsible for any actions you take by reading/viewing this post.
please consult your financial advisor before taking any action.
----Vinaykumar hiremath, CMT

Review and plan for 16th April 2025Nifty future and banknifty future analysis and intraday plan in kannada.
Result stocks.
This video is for information/education purpose only. you are 100% responsible for any actions you take by reading/viewing this post.
please consult your financial advisor before taking any action.
----Vinaykumar hiremath, CMT

Nifty Bank Index Chart Observations:
Pattern:
Price has been forming lower highs, suggesting a descending trendline resistance.
There's a visible breakout attempt above this trendline now.
Support Zone:
Strong demand zone between 46,800 – 48,000, which was respected multiple times.
Indicators:
RSI is near the overbought zone, but not showing divergence.
Volume has spiked on the breakout – bullish confirmation.
Heikin Ashi candles are strongly green – good momentum.
✅ Bullish Scenario (If breakout holds):
Entry Zone: On retest of the breakout trendline (around 51,500–52,000).
Target Levels:
Short-term: 53,500
Medium-term: 55,000–56,000
Stop Loss: Below 50,500
❌ Bearish Scenario (If breakout fails):
Invalidation Level: If it closes back below the trendline with high volume.
Re-entry zone: Watch the 48,000 support area again.
Short Target (if breakdown from support): 46,000–45,000
Swing Traders: Wait for a pullback toward the trendline and enter on bullish confirmation.
Positional Traders: Enter partially now, add more on pullback confirmation.
Risk Management: Keep positions light until breakout is fully confirmed.

Review and plan for 15th April 2025Nifty future and banknifty future analysis and intraday plan in kannada.
This video is for information/education purpose only. you are 100% responsible for any actions you take by reading/viewing this post.
please consult your financial advisor before taking any action.
----Vinaykumar hiremath, CMT

[INTRADAY] #BANKNIFTY PE & CE Levels(11/04/2025)Today will be strong gap up opening expected in banknifty. Expected opening above 51000 level. If banknifty starts trading and sustain above 51050 level then expected further upside rally upto 51450+ level and this can be extends for further 400-500+ points if gives breakout of 51550 level. Below 50950 level expected downside movement in index upto 50550 support level.

Review and plan for 11th April 2024Nifty future and banknifty future analysis and intraday plan in kannada.
This video is for information/education purpose only. you are 100% responsible for any actions you take by reading/viewing this post.
please consult your financial advisor before taking any action.
----Vinaykumar hiremath, CMT

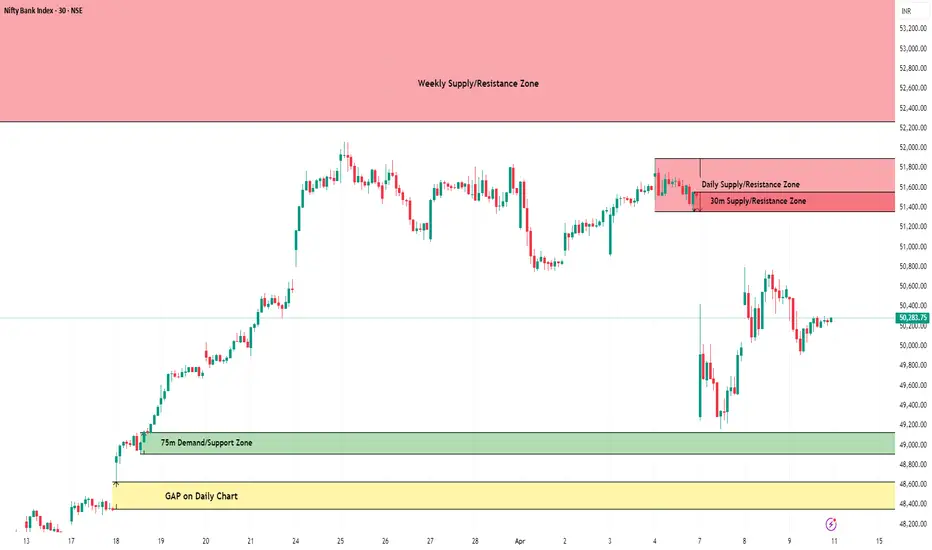
BankNifty Intraday Support & Resistance Levels for 11.04.2025🔄 Quick Recap since the last update (21.03.2025):
BankNifty rallied to a high of 52,063.95 on 25th March, piercing through the earlier mentioned Weekly Supply Zone by 84 points. But the bullish momentum was short-lived. Following Trump’s tariff announcement, BankNifty plunged sharply, dropping over 2,800 points to hit a low of 49,156.95 on 7th April.
🌍 Global sentiment has been shaken, but signs of recovery are emerging. Dow Futures have rebounded 4,000 points (10%), currently trading around 40,700 — a hopeful sign, but volatility remains elevated.
📅 On Wednesday (09.04.2025):
BankNifty opened with a gap-down, hit high of 50,496.90, and made a low at 49,910.85 before settling at 50,240.15, down 271 points for the day.
🔹 Trend Analysis:
Weekly Trend (50 SMA): Sideways
Daily Trend (50 SMA): Sideways
📉 Demand/Support Zones
Near Demand/Support (75m): 49,215.95 – 49,698.05
Gap Support (Daily Chart): 48,354.15 – 48,629.45
Far Support: 47,700 – 47,850 (multiple time tested on Daily Chart)
Major Support: 46,077.85 (Low of 4th June 2024)
Far Demand/Support (Daily): 44,633.85 – 45,750.40
📈 Supply/Resistance Zones
Near Supply (30m): 51,360.40 – 51,559.20 (Inside Daily Supply)
Near Supply (Daily): 51,360.40 – 51,893.60
Far Supply (Weekly): 52,264.55 – 53,775.10
🔍 Outlook:
With both trends turning sideways, BankNifty remains in a consolidation phase. Bulls are currently trapped under a strong resistance zone starting from 51,360, while downside support begins near 49,200.
Considering the volatile global setup, we may see a range-bound move with sharp intraday swings. The index must cross 51,900 decisively for any further upside. Until then, sell-on-rise near supply and buy-on-dip at demand continues to be the approach. Stay cautious. Trade levels, not emotions.
📢 Disclaimer: This analysis is intended for educational purposes only. It is not investment advice. Please consult your financial advisor before making any trading decisions.
Review and plan for 9th April 2025Nifty future and banknifty future analysis and intraday plan in kannada.
This video is for information/education purpose only. you are 100% responsible for any actions you take by reading/viewing this post.
please consult your financial advisor before taking any action.
----Vinaykumar hiremath, CMT

Nifty Yearly Lows in Place. Time for recovery towards 25000Massive meltdown towards the sellside. Time for all out displacement towards the internal buyside. I feel the yearly lows are in place. Best time to invest for SIP and mutual funds

[INTRADAY] #BANKNIFTY PE & CE Levels(08/04/2025)Today will be gap up opening expected in banknifty near 50500 level. After opening if banknifty starts trading above 50550 level then expected upside rally upto 50950 level in today's session. 50950 will act as a strong resistance. Bullish movement can reversal from this level. In case banknifty starts trading below 50450 then possible further sharp downside rally upto 50050 and this can extend upto 49550 level if index gives breakdown of 50000 level and starts trading below 49950.

Review and plan for 8th April 2025 Nifty future and banknifty future analysis and intraday plan in kannada.
This video is for information/education purpose only. you are 100% responsible for any actions you take by reading/viewing this post.
please consult your financial advisor before taking any action.
----Vinaykumar hiremath, CMT

Review and plan for 7th April 2025Nifty future and banknifty future analysis and intraday plan in kannada.
This video is for information/education purpose only. you are 100% responsible for any actions you take by reading/viewing this post.
please consult your financial advisor before taking any action.
----Vinaykumar hiremath, CMT

Review and plan for 4th April 2025 Nifty future and banknifty future analysis and intraday plan in kannada.
Few stocks analysed.
This video is for information/education purpose only. you are 100% responsible for any actions you take by reading/viewing this post.
please consult your financial advisor before taking any action.
----Vinaykumar hiremath, CMT

Review and plan for 3rd April 2025 Nifty future and banknifty future analysis and intraday plan in kannada.
This video is for information/education purpose only. you are 100% responsible for any actions you take by reading/viewing this post.
please consult your financial advisor before taking any action.
----Vinaykumar hiremath, CMT

Review and plan for 2nd April 2025Nifty future and banknifty future analysis and intraday plan in kannada.
Few stocks too.
This video is for information/education purpose only. you are 100% responsible for any actions you take by reading/viewing this post.
please consult your financial advisor before taking any action.
----Vinaykumar hiremath, CMT

BANKNIFTY : Trading Levels and Plan for 31-Mar-2025📌 BANK NIFTY Trading Plan – 31-Mar-2025
📊 Market Overview:
Bank Nifty closed at 51,552, trading within a consolidation phase near the Opening Support/Resistance Zone (51,552 – 51,564). The price action at key levels will dictate the next move, so we need to be prepared for different opening scenarios.
This plan offers a structured approach to trading at key levels while maintaining a favorable risk-reward ratio.
🔼 Scenario 1: Gap-Up Opening (200+ points above 51,750)
A gap-up above 51,750 suggests bullish momentum, but sustainability above the resistance zone (51,848 - 52,129) is crucial for further upside. If price faces rejection, an intraday reversal is possible.
✅ Plan of Action:
If Bank Nifty sustains above 52,129, expect an up-move towards the next resistance at 52,335. A breakout above 52,335 could trigger a rally towards 52,500+.
If price faces rejection at 52,129 and reverses, expect a retracement towards 51,848 → 51,750. If it fails to hold 51,750, a deeper correction towards 51,552 is possible.
Avoid fresh longs inside 51,848 – 52,129, as this zone could act as a profit-booking area. Wait for a decisive breakout or rejection confirmation.
🎯 Pro Tip: If the gap-up is quickly filled within the first 15-30 minutes, it signals weak buying strength, increasing the probability of an intraday correction.
⚖ Scenario 2: Flat Opening (Within ±200 points, around 51,550)
A flat opening near 51,552 indicates indecision. The market will take direction after the first few candles, so breakouts or breakdowns from key levels should be watched.
✅ Plan of Action:
Upside case: If Bank Nifty breaks and sustains above 51,848, it may head towards 52,129 → 52,335. Observe price action near these resistance levels before entering fresh longs.
Downside case: If Bank Nifty breaks below 51,552, it could test 51,199 → 50,899. A breakdown below 50,899 will shift the trend bearish.
Sideways caution: If the market remains inside the No Trade Zone (51,564 – 51,848), avoid taking trades as volatility could trap both buyers and sellers.
🎯 Pro Tip: In a flat opening, wait for a clear 15-minute candle close above or below key levels before entering trades.
🔽 Scenario 3: Gap-Down Opening (200+ points below 51,350)
A gap-down below 51,350 could signal profit booking or fresh selling pressure. The critical factor will be whether buyers defend key support zones.
✅ Plan of Action:
If price sustains below 51,350, expect a decline towards 51,199 → 50,899. A breakdown below 50,899 may accelerate selling towards the Must Try Zone for Buyers (50,800 – 50,899).
If price finds support at 50,899 and rebounds, it may attempt a recovery towards 51,199 → 51,552. A strong close above 51,552 could shift momentum back to the bulls.
Be cautious of bear traps – If the market gaps down but quickly recovers, it could trigger short covering, leading to an upside reversal.
🎯 Pro Tip: If the gap-down occurs near a strong buyer’s support zone, wait for a bullish price action confirmation before entering long trades.
⚠️ Risk Management Tips for Options Traders
🔹 Avoid over-leveraging – Use proper position sizing to manage risk.
🔹 Theta Decay Awareness – If the market consolidates, option premiums will erode rapidly.
🔹 Use Spreads for Protection – Instead of naked options, use spreads to limit risk and improve probability.
🔹 Trade at Key Levels – Avoid impulsive trades; focus on defined support and resistance zones.
📌 Summary & Conclusion
📍 Key Levels to Watch:
🟥 Resistance: 52,129 → 52,335 → 52,500
🟧 No Trade Zone: 51,564 – 51,848
🟩 Support: 51,199 → 50,899 → 50,800
🔸 Bullish Bias: Above 52,129, targeting 52,335 – 52,500
🔸 Bearish Bias: Below 51,350, expecting a fall towards 51,199 – 50,899
🔸 Neutral/Choppy: Inside 51,564 – 51,848, avoid unnecessary trades
🎯 Final Advice:
Stick to the structured trading plan and execute only at key levels.
Avoid emotional trading—wait for confirmation before entering trades.
The first 15-30 minutes after market open will provide better clarity—observe price action before committing to a trade.
📢 Disclaimer
I am not a SEBI-registered analyst. This trading plan is for educational purposes only. Please conduct your own research or consult a financial advisor before making any trades.

Review and plan for 1st April 2025Nifty future and banknifty future analysis and intraday plan in kannada.
This video is for information/education purpose only. you are 100% responsible for any actions you take by reading/viewing this post.
please consult your financial advisor before taking any action.
----Vinaykumar hiremath, CMT

BANKNIFTY - Trading Levels and Plan for 28-Mar-2025📌 BANK NIFTY Trading Plan – 28-Mar-2025
📊 Market Overview:
Bank Nifty closed at 51,534, consolidating within a No Trade Zone after a sharp rally. The index is currently at a decision point, where price action at key levels will determine the next move.
This structured plan will help you trade effectively under different opening conditions.
🔼 Scenario 1: Gap-Up Opening (200+ points above 51,750)
A gap-up opening above 51,750 would place Bank Nifty near the Opening Resistance Zone (51,851). The key focus should be on whether the index sustains above resistance or faces rejection.
✅ Plan of Action:
If Bank Nifty sustains above 51,851, it could trigger a rally towards the Profit Booking Zone (52,185 – 52,335). A breakout above this level may extend gains to 52,500+.
If price faces rejection at 51,851 and reverses, it could lead to a pullback towards 51,593 → 51,534. Watch for support confirmation before taking any long positions.
Avoid aggressive longs inside 51,750 – 51,851, as this area could witness profit booking. Wait for a proper retest before entering trades.
🎯 Pro Tip: If the gap-up gets filled within 15 minutes, it signals weak buying strength and may lead to intraday correction.
⚖ Scenario 2: Flat Opening (Within ±200 points, around 51,534)
A flat opening suggests that market participants are waiting for confirmation before taking decisive action. In such cases, it's best to trade only at key breakout/breakdown levels.
✅ Plan of Action:
Upside case: If Bank Nifty breaks and sustains above 51,593, it could move towards 51,750 → 51,851. Observe the price action at these levels before deciding on further longs.
Downside case: If Bank Nifty breaks below 51,534, it could test 51,388. A breakdown below 51,388 may trigger selling towards 51,205.
Sideways caution: If the index trades between 51,534 – 51,593, it indicates a choppy market. Avoid trading inside this range unless there is a clear breakout.
🎯 Pro Tip: In a flat opening scenario, wait for at least one 15-minute candle close to confirm the direction before entering a trade.
🔽 Scenario 3: Gap-Down Opening (200+ points below 51,334)
A gap-down below 51,334 could indicate weakness and profit booking, bringing the index closer to key support zones. The next move depends on whether buyers defend these supports.
✅ Plan of Action:
If price sustains below 51,334, expect a decline towards 51,205. A breakdown below 51,205 could lead to a deeper correction towards the Buyer’s Support Zone (50,987 – 50,891).
If price rebounds from 51,205, it may attempt a recovery towards 51,388 → 51,534. A strong close above 51,534 could invalidate bearish sentiment.
Be cautious of bear traps – If price quickly recovers after a sharp gap-down, it may indicate short covering, leading to an upside reversal.
🎯 Pro Tip: If the gap-down occurs near a strong buyer’s support zone, look for signs of reversal before initiating new shorts.
⚠️ Risk Management Tips for Options Traders
🔹 Avoid over-leveraging – Stick to a fixed capital allocation per trade to reduce risk.
🔹 Theta Decay Awareness – If the market consolidates, option premiums will decay rapidly, impacting option buyers.
🔹 Use Spreads for Protection – Instead of naked options, use spreads to control risk.
🔹 Trade at Key Levels – Avoid random trades; enter only near strong support and resistance zones.
📌 Summary & Conclusion
📍 Key Levels to Watch:
🟥 Resistance: 51,851 → 52,185 → 52,335
🟧 No Trade Zone: 51,534 – 51,593
🟩 Support: 51,388 → 51,205 → 50,987
🔸 Bullish Bias: Above 51,851, targeting 52,185 – 52,335
🔸 Bearish Bias: Below 51,334, expecting a fall towards 51,205 – 50,987
🔸 Neutral/Choppy: Inside 51,534 – 51,593, avoid unnecessary trades
🎯 Final Advice:
Stick to the structured trading plan and execute only at key levels.
Avoid FOMO trades—wait for confirmation before entering.
The first 15-30 minutes after market open will give a clearer direction—observe price action before committing to a trade.
📢 Disclaimer
I am not a SEBI-registered analyst. This trading plan is for educational purposes only. Please conduct your own research or consult a financial advisor before making any trades.

Review and plan for 28th March 2025Nifty future and banknifty future analysis and intraday plan in kannada.
This video is for information/education purpose only. you are 100% responsible for any actions you take by reading/viewing this post.
please consult your financial advisor before taking any action.
----Vinaykumar hiremath, CMT
