Banknifty Prediction for tomorrow 11 Mar (Monday)Hello traders, As we discussed in our last analysis, the market took resistance from the resistance zone, and the result was sideways.
If we look at the chart data now:
The market is taking resistance at 48119. (Why this resistance looks like my last bank nifty analysis). The market is trading at the resistance zone right now. Also, there has been a good momentum without consolidation. There can be a fallback till 47230 or 200 EMA.
There are multiple support points lower side -> 200 EMA, Price action support, Fibonacci 0.38 Level.
If we look at the OI data:
PCR = 0.88 shows bullish sentiments. But if. we look at the change from the previous day, 1.28 - 0.88, it shows bears are continuously increasing their position in the market. Also, there has been a Huge surge at 48000 CE OI, which is going to provide good resistance.
FII and DII data do not show much of the information except that the market might open a small gap-down.
I am expecting the market to get consolidated.
Case 1 : Market takes fallback till 200 EMA.
Case 2: Market consolidation in the range 47750 - 48119.
Reasons:
Price taking support 47750 & resistance at 48100. which might lead to sideways behavior.
RSI < 50 falling shows weak bulls. That might lead to a fall if RSI goes below 40.
RSI is having hidden bullish divergence. RSI is making LL, and the price is making HH.
PCR change from 1.28 - 0.88 shows strong power of Bears. Also, there is less PE writing than CE writing.
Verdict : The market is in consolidation mode.
Sideways or Bearish
Plan of action:
Case 1: Sell 47700 CE (Hedge it with 20 rs CE).
Case 2 : Iron condor in range 47750 - 48119.
Bankniftyanalysis

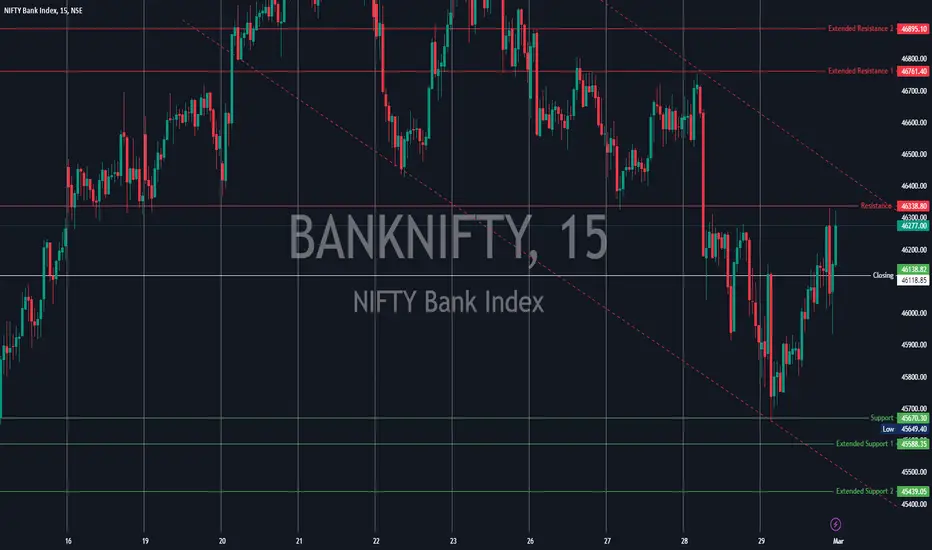
NiftyBank key levels for March 6, 2024Stay ahead of the curve with our daily Bank Nifty key levels!
NiftyBank key levels for March 6, 2024
Overview:
Today's trading session presented significant opportunities within the Bank Nifty index and we executed the trades based on the levels published yesterday on tradingview and we were able to capture the fall of 180 points in BankNifty on March 5
Here are the key levels to watch for potential entry and exit points in NSE:BANKNIFTY
Resistance Levels:
- Refer the Red line on the chart
Support Levels:
- Refer the Green line on the chart
Trading Strategy:
- Long Position:
Consider initiating long positions near support levels only after reversal confirmation for potential upside movement.
- Short Position:
Consider initiating short positions near resistance levels only after reversal confirmation for potential downside movement.
Risk Management:
- Always use stop-loss orders to protect against adverse market movements.
- Consider position sizing based on risk tolerance and account equity.
Disclaimer:
These levels are provided for informational purposes only and should not be considered as financial advice. Trading involves risk, and past performance is not indicative of future results. Always conduct your own research and consult with a qualified financial advisor before making any investment decisions.
Thanks

GBPUSD trade idea Possible GBPUSD trade scenario Enter with confirmation on ltf
Manage risk if Direct entry on 4hr zone
1:2-3 Rr
Indicator based SMC approach
Follow and like for more setups

BANKNIFTY--@Trendline ResistanceA strong bullishness is observed in BANKNIFTY index, now it is at one more crucial stage
this time will this breaks the trendline or fails to break this line.
if price failed to make a break above this will observe a one more fall in Bank Nifty.
On bottom side we have liquidity lies below 44600 levels...
Wait for the price to break the trendline and sustain otherwise fall happens.
This is the place to book all longs for now.

BANKNIFTY--S/R Levels??I am sharing the important levels of Support and Resistance. These levels plays a crucial role in trading decisions, as they act as reliable markers of price movements.
------>>Support levels are price points where an asset tends to find buying interest, preventing it from falling further.
---->Resistance levels, on the other hand, are points where selling pressure typically prevents the asset from rising higher.
Take a look at these levels and trade accordingly. Recognizing and respecting these support and resistance levels can help traders make informed decisions and manage risk effectively. They serve as key reference points for technical analysis and are vital tools in successful trading strategies.
------------------------------------------------------------------------------------------------------------
keep in long side as long as price is above the trendline. will go for short once price breaks and retest of trendline.

[INTRADAY] #BANKNIFTY PE & CE Levels(06/03/2024) Today will be gap down opening in BANKNIFTY. After opening if banknifty start trading below 47450 level then possible downside rally of 400-500 points upto 47050 Level in todays session.Any Major upside only expected in case banknifty starts trading above 47550 level upto 47950 level & this rally can extend another 400 points if market gives breakout 48050 level.

[INTRADAY] #BANKNIFTY PE & CE Levels(04/03/2024) Today will be gap up opening in BANKNIFTY. After opening if banknifty sustain above 47050 level then possible upside rally of 400-500 points upto 47450 level & this rally can extend another 400 points if market gives breakout 47550 level in todays session.Any Major downside only expected in case banknifty starts trading below 46950 level.also possible Reversal Downside 47450 level.

[INTRADAY] #BANKNIFTY PE & CE Levels(02/03/2024) Today will be gap up opening in BANKNIFTY. After opening if banknifty sustain above 47050 level then possible upside rally of 400-500 points upto 47450 level & this rally can extend another 400 points if market gives breakout 47550 level in todays session.Any Major downside only expected in case banknifty starts trading below 46950 level.

BANKNIFTY--Support ?? Resistance??Bank nifty index is taking the support multiple times from the level @46400 levels.
this is the crucial level to see it will break the trendline to move upside or by facing the resistance in the form of support and falls back to below levels and continue to move down. even though price breaks the trendline we have to wait for bullish continuation.

[INTRADAY] #BANKNIFTY PE & CE Levels(01/03/2024) Today will be gap up opening in BANKNIFTY. After opening if banknifty sustain above 46050 level then possible upside rally of 400-500 points upto 46450 level & this rally can extend another 400 points if market gives breakout 46550 level in todays session.Any Major downside only expected in case banknifty starts trading below 45950 level. also possible reversal downside 46450 level.

NiftyBank key levels for March 1, 2024Stay ahead of the curve with our daily Bank Nifty key levels!
NiftyBank key levels for March 1, 2024
If you feel that this analysis helps you, Do Follow Us for more insights & Do Boost the post
Overview:
Today's trading session presented significant opportunities within the Bank Nifty index and we executed the trades based on the levels published yesterday on tradingview and we were able to capture the fall of 700 points in BankNifty
Link for yesterday’s levels, you can check it yourself :-
Here are the key levels to watch for potential entry and exit points in
BANKNIFTY
Resistance Levels:
- Refer the Red line on the chart
Support Levels:
- Refer the Green line on the chart
Trading Strategy:
- Long Position:
Consider initiating long positions near support levels only after reversal confirmation for potential upside movement.
- Short Position:
Consider initiating short positions near resistance levels only after reversal confirmation for potential downside movement.
Risk Management:
- Always use stop-loss orders to protect against adverse market movements.
- Consider position sizing based on risk tolerance and account equity.
Disclaimer:
These levels are provided for informational purposes only and should not be considered as financial advice. Trading involves risk, and past performance is not indicative of future results. Always conduct your own research and consult with a qualified financial advisor before making any investment decisions.
Thanks
BANKNIFTY--Rally Base Rally or Reversal??A strong bullish momentum is observed from double bottom levels,
now price is near to the previous strong resistance area, if these resistances acts as support then only will see an upside momentum...if they failed to push, it will continue its momentum towards below levels...
CASE 1::
Rally Base Rally
If it is a rally base rally price will take the support of 45600 levels...and it will continue to move upside above 47600 levels.
keep an eye on trendline, if breaks will look for long on retracement.
Case 2::
Reversal
If we observe a consolidation on bottom side @ double bottom levels..
it will go down and reversal may happens from 44000 levels...

BANKNIFTY--@Trendline Resistance??BANKNIFTY Index is showing bearishness from 47200 levels...
On top side price created a trendline...now until price breaks the trendline keep ur view to short only..
failed to consolidate on topside..to move upside..
so its time to look for short near the trendline...
tomorrow chance of upside and test the trendline and again turned to bearish again...
to grab the liquidity below the demand zones. on bottom side we have supports at 46200 and 45800 levels
wait for the price to come to these zones, enter here to continue long side again.

[INTRADAY] #BANKNIFTY PE & CE Levels(27/02/2024) Today will be gap down opening in BANKNIFTY. After opening if banknifty start trading below 46450 level then possible downside rally of 400-500 points upto 46050 Level in todays session.Any Major upside only expected in case banknifty starts trading above 46550 level.

BANKNIFTY--Inverse Head & Shoulders??Bank nifty index is showing strong bearish pressure after the liquidity grab above 47200.
price tested the demand zones on bottom side and now facing resistance at trendline.
we have a chance of inverse head and shoulder pattern, to test the ATH levels.
If consolidation happen above neckline will have a chance of testing the ATH is more.

[INTRADAY] #BANKNIFTY PE & CE Levels(26/02/2024) Today will be gap down opening in BANKNIFTY. After opening if banknifty start trading below 46950 level then possible downside rally of 400-500 points upto 46550 Level & this rally can extend another 400 points if market gives breakdown 46450 level in todays session.Any Major upside only expected in case banknifty starts trading above 47050 level.

BankNifty Key Lelevs for 26 Feb, 2023📈 Stay ahead of the curve with our daily Bank Nifty key levels! 🚀
#NiftyBank key #levels for 26th Feb, 2024
Look for the support and resistance lines and trade only at confirmation of reversal.

What Stopped the recovery of Bank Nifty? (Educational Post)How to read a chart and make one is an art which one can master by practicing, understanding the patterns and applying logic in addition to reasoning. Today we will try to master this art with the help of below chart of Bank Nifty. Let us analyze it togther. After reading each paragraph try to look at the chart again for understanding it better. Look at the chart of Bank nifty above.
As you can see in the chart Bank Nifty is moving in a parallel channel like a canal since more than 1 year and 3 months or so. After making a high above 48.6K Bank Nifty formed a bottom near 44833 which was a 200 days EMA support, Bank Nifty consolidated and then started surging ahead. Now something happened on Wednesday which hampered the progress.
The progress was stopped by the trendline resistance indicated by the blue line. Facing the heat of the resistance Bank Nifty plunged down only to be supported by support zone between 46219 and 46418. This support zone as you can see in the chart consist ot bottoms and tops of few candles ranging from 4th December 2023 to 20th February 2024 and 50 days EMA which is currently at 46219. This can be the future support zone in case Nifty does not recover from this level.
Again after taking this support Nifty tried to surge ahead again but was again stopped by the same trend line which cam to effect on Wednesday. Start of this trend line can be seen on the candle of 16th January. This is how Technical analysis works.
Can we predict future of Bank Nifty with the help of this chart? Predicting future moves is always risky and is full of assumptions but what we can see here indicates that crossing the resistance zone of 47091 (Trendline resistance) and High of Wednesday 47352 will be a tough task for Bank Nifty. But if Bank Nifty crosses this zone the next levels/ resistances will be near 47670 or 47906. Crossing and closing above 47906 the Nifty can reach the next resistance levels of 48303 or 48595.
This is how you can analyse a chart. By applying logic you will gain experience. By applying experience and reasoning you will gain wisdom. Wisdom will help you in chartering your path through the maze of Wealth creation. Charts are nothing but mathematical representation of how investors/speculators behave at particular levels and in particular zones. With the help of charts you can understand paths, patterns and future and past directions of how markets/indices/stocks behave. If you become an expert by watching/drawing 100 charts every day, you can even predict future levels of markets/indices/stocks.

BANKNIFTY--Case1 or Case2??BANKNIFTY Index is showing bearish pressure after the liquidity grab above 47200 levels,
tomorrow we have a chance of price trading in a channel and likely to test the demand zones at
46500 levels...
these two possible cases may happens ::
Case1::Rally base Rally
A strong rise is observed from the demand zone at 46500 levels, by creating a bearish channel price may test this demand and again be bullish.
on topside if rally base rally happens the next resistance is 47600-47700.
So take care of your trades.
Case 2:: Rally Base Reversal
On topside we have a triple top, which is a strong resistance so, we can expect a break below the the demand zone and it will continue its movement towards bottom side.
Look for buy if the price grabs the liquidity on below the demand zones and keep in long side from demand zones.

BANK NIFTY INTRADAY SETUP 23 FEB 24Bank Nifty Is super strong than nifty. There is a buying opportunity to go long
1. Previous Day's closing bullish
2. Trading above previous Day's High
3. Broke 1st Bearish candle on 5Min TF
4. Took Support From & Buy Signal on 5 Min TF from the marked Zone as demand & Support level.

[INTRADAY] #BANKNIFTY PE & CE Levels(23/02/2024) Today will be gap up opening in BANKNIFTY. After opening if banknifty sustain above 47050 level then possible upside rally of 400-500 points upto 474550 level & this rally can extend another 400 points if market gives breakout 47550 level in todays session .Any Major downside only expected in case banknifty starts trading below 46950 level. also possible reversal downside 46950 level.

BankNifty crashing soon?Banknifty looks like going down with Head and shoulder pattern. Its an hourly chart and provided clear indication on whats happening in banknifty.

BANKNIFTY ANALYSISNo Trading Reversal Zone:
Range: 46,662 to 46,800
Analysis: The market has established a no trading reversal zone in the range of 46,662 to 46,800, suggesting a period of consolidation or indecision. Traders should exercise caution within this range, awaiting clearer signals before making significant trading decisions.
Previous Day High and Open Interest (OI) Resistance:
Previous Day High (PDH): 47,020
OI Resistance Zone: 47,020 to 47,110
Analysis: The PDH at 47,020 serves as a critical level. If the price surpasses this point, it may encounter resistance within the OI resistance zone from 47,020 to 47,110. Traders should closely monitor price action in this area for potential breakout opportunities.
Previous Day Low and OI Support:
Previous Day Low (PDL): 46,350
OI Support Zone: 46,350 to 46,440
Analysis: The PDL at 46,350 acts as a key reference point. If the price approaches this level, it may find support within the OI support zone ranging from 46,350 to 46,440. Traders should observe how the market reacts around this area, as a bounce or breakdown could indicate potential future movements.
Profit Booking Zone for Longs:
Profit Booking Zone: 47,270 to 47,400
Analysis: Traders holding long positions may consider booking profits in the zone from 47,270 to 47,400. This area represents a potential region where bullish momentum could face resistance, and profit-taking becomes a strategic consideration.
Overall Analysis:
The market is currently within the no trading reversal zone, suggesting a lack of clear direction.
Traders should closely watch the PDH, OI resistance zone, PDL, and OI support zone for potential breakout or breakdown signals.
The profit booking zone for longs provides a strategic area for traders to consider securing profits from bullish positions.
Key Takeaways for Traders:
Caution: Exercise caution within the no trading reversal zone and wait for clearer signals.
Breakout/Breakdown Opportunities: Monitor the PDH, OI resistance, PDL, and OI support for potential breakout or breakdown opportunities.
Profit Booking: Traders with long positions may consider booking profits in the specified profit booking zone.
This analysis provides a framework for traders to navigate potential market movements based on historical price levels and open interest data. However, it's crucial to use additional technical indicators, real-time data, and risk management strategies for a comprehensive trading approach. Stay informed about external factors and market news that could impact Bank Nifty's movements.
