BANKNIFTY : Trading levels and Plan for 26-may-2025📊 Bank Nifty Trading Plan – 26-May-2025
Timeframe: 15 Min | Reference Spot Price: 55,389
Gap Opening Threshold: 200+ Points
🚀 Gap-Up Opening (Above 55,589) – 200+ Points
If Bank Nifty opens above 55,589, it will directly enter or hover near the crucial Opening Resistance Zone of 55,417–55,510 and potentially head toward the upper Profit Booking Zone: 55,834–55,999.
🟥 This zone has shown signs of supply in the past and may act as a trap for early breakout buyers if price action isn't strong.
✅ Plan of Action:
– Avoid aggressive longs immediately after the gap-up.
– Wait for price to sustain above 55,510 and then break and close above 55,834 on a 15-min candle to confirm strength.
– If this happens, you may look for long entries targeting 55,999 – 56,065 with stop loss just below 55,700.
– However, if Bank Nifty faces rejection in the red zone (55,834–55,999), then Sell-on-Rise opportunity can be considered with a downside target back to 55,510 – 55,417 and eventually 55,136.
– Use a bearish reversal pattern (like Evening Star or Engulfing) in the red zone to trigger shorts.
🎓 Educational Insight: A gap-up into resistance often gives a false breakout if momentum and volume are not supportive. Always wait for confirmation before going long.
📈 Flat Opening (Between 55,189 – 55,589)
This keeps Bank Nifty between the Opening Support (55,136) and the Opening Resistance Zone (55,417–55,510).
🟧 This is the choppy zone. Expect mixed emotions in the market during the first 15–30 mins.
✅ Plan of Action:
– Avoid early trades in the first 15–30 mins.
– Wait for directional cues.
– If price holds above 55,417 and gives a strong bullish breakout above 55,510, you can ride a potential move toward 55,834–55,999.
– On the downside, if price slips below 55,136, expect momentum to pick up toward 55,005 and possibly 54,758.
– Only trade if clear breakout or breakdown candle appears with volume support.
🎓 Educational Insight: Most fake breakouts happen in flat openings. Let the market show its hand—follow only when structure and strength align.
📉 Gap-Down Opening (Below 55,189) – 200+ Points
A gap-down below 55,189 would bring prices near key demand zones: Opening Support: 55,136, Intraday Support: 55,005, and Last Strong Support: 54,758.
🟩 These levels can either absorb the fall and bounce or lead to further decline if broken decisively.
✅ Plan of Action:
– Observe price action near 55,005 and 54,758.
– If bullish reversal candles (like hammer or bullish engulfing) form and price sustains above support, consider a long setup targeting a bounce back to 55,136 – 55,417.
– On the other hand, if price decisively breaks 54,758, then consider short entries with next downside target in swing low regions (can extend 100–150 pts down).
– Stop loss for longs: below 54,700.
– Stop loss for shorts: above 54,850.
🎓 Educational Insight: Gap-downs to support can offer great R:R long entries if price shows strength. But wait for candle structure to confirm reversal before entering.
🛡️ Options Trading – Risk Management Tips
✅ Don’t rush into trades at the open —allow price structure to develop.
✅ Use slightly ITM options instead of deep OTM for better delta movement and less decay.
✅ Don’t overleverage —risk only 1–2% of your capital per trade.
✅ Always define your stop loss based on spot levels , not just the option premium.
✅ Exit after 2 consecutive stop-losses to maintain discipline and emotional stability.
✅ Book partial profits as the trade moves in your favor and trail SL for the rest.
✅ Avoid chasing momentum blindly ; volume and structure confirmation are key.
📌 Summary & Conclusion
🔹 Opening Resistance Zone: 55,417 – 55,510
🔹 Profit Booking Zone: 55,834 – 55,999
🔹 Opening Support: 55,136
🔹 Last Intraday Support: 55,005
🔹 Final Strong Support: 54,758
📈 For Gap-Ups, watch for price rejection near upper zones or breakouts beyond 55,999.
📉 For Gap-Downs, reversal setups at 55,005 or 54,758 are key—don’t short blindly.
🕒 In Flat Openings, let the market settle for 15–30 minutes. Trade only on confirmation.
⚖️ Best trades occur when price moves away from zones with proper volume, pattern, and structure alignment .
⚠️ Disclaimer:
I am not a SEBI-registered analyst. This trading plan is intended purely for educational purposes. Please do your own analysis or consult a SEBI-registered advisor before initiating any trades.
Bankniftyintradaytradesetup

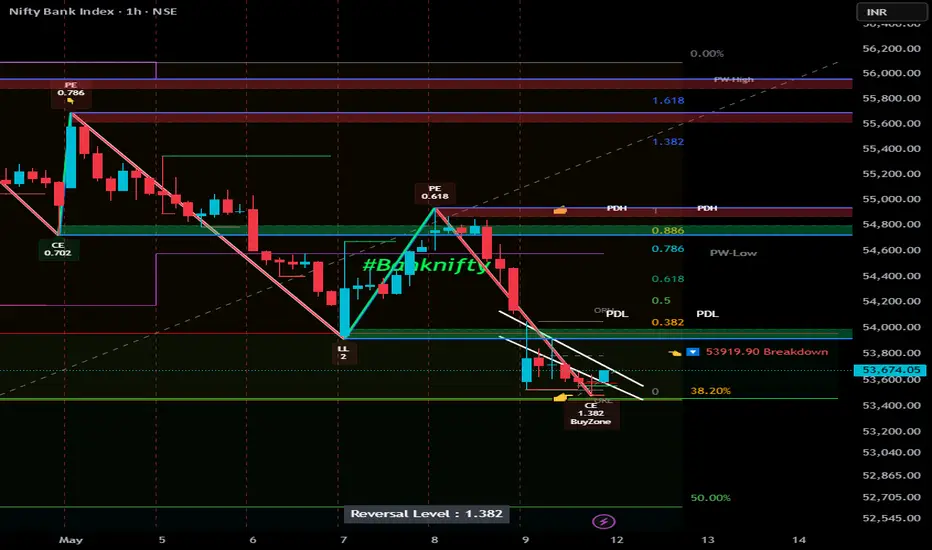
Bank Nifty 54,800–55,600 As we all know, Bank Nifty is highly sensitive and tends to react quickly to news events.
Currently, there is ongoing conflict between India and Pakistan, which has caused Bank Nifty to open with consistent gap-downs, followed by rangebound movement for the rest of the day.
However, recent developments indicate that Pakistan has realized it cannot continue the conflict without risking being removed from the global map. As a result, they are now ready for a ceasefire.
As I said, Bank Nifty is very sensitive, hence we can see a good gap-up opening.
Bank Nifty can jump towards the 0.886 Fibonacci level, which is nothing but 54,800–55,600 zone.
Traders should remain cautious but optimistic, and watch key levels carefully.
[INTRADAY] #BANKNIFTY PE & CE Levels(06/05/2025)Today will be flat opening in index. After opening if banknifty starts trading and sustain above 55050 level then expected upside movement upto 55450+ level in opening session. Major downside expected if banknifty not sustain above level and starts trading below 54950 then possible downside upto 54550 support level.

BANKNIFTY : Trading Levels and Plan for 31-Mar-2025📌 BANK NIFTY Trading Plan – 31-Mar-2025
📊 Market Overview:
Bank Nifty closed at 51,552, trading within a consolidation phase near the Opening Support/Resistance Zone (51,552 – 51,564). The price action at key levels will dictate the next move, so we need to be prepared for different opening scenarios.
This plan offers a structured approach to trading at key levels while maintaining a favorable risk-reward ratio.
🔼 Scenario 1: Gap-Up Opening (200+ points above 51,750)
A gap-up above 51,750 suggests bullish momentum, but sustainability above the resistance zone (51,848 - 52,129) is crucial for further upside. If price faces rejection, an intraday reversal is possible.
✅ Plan of Action:
If Bank Nifty sustains above 52,129, expect an up-move towards the next resistance at 52,335. A breakout above 52,335 could trigger a rally towards 52,500+.
If price faces rejection at 52,129 and reverses, expect a retracement towards 51,848 → 51,750. If it fails to hold 51,750, a deeper correction towards 51,552 is possible.
Avoid fresh longs inside 51,848 – 52,129, as this zone could act as a profit-booking area. Wait for a decisive breakout or rejection confirmation.
🎯 Pro Tip: If the gap-up is quickly filled within the first 15-30 minutes, it signals weak buying strength, increasing the probability of an intraday correction.
⚖ Scenario 2: Flat Opening (Within ±200 points, around 51,550)
A flat opening near 51,552 indicates indecision. The market will take direction after the first few candles, so breakouts or breakdowns from key levels should be watched.
✅ Plan of Action:
Upside case: If Bank Nifty breaks and sustains above 51,848, it may head towards 52,129 → 52,335. Observe price action near these resistance levels before entering fresh longs.
Downside case: If Bank Nifty breaks below 51,552, it could test 51,199 → 50,899. A breakdown below 50,899 will shift the trend bearish.
Sideways caution: If the market remains inside the No Trade Zone (51,564 – 51,848), avoid taking trades as volatility could trap both buyers and sellers.
🎯 Pro Tip: In a flat opening, wait for a clear 15-minute candle close above or below key levels before entering trades.
🔽 Scenario 3: Gap-Down Opening (200+ points below 51,350)
A gap-down below 51,350 could signal profit booking or fresh selling pressure. The critical factor will be whether buyers defend key support zones.
✅ Plan of Action:
If price sustains below 51,350, expect a decline towards 51,199 → 50,899. A breakdown below 50,899 may accelerate selling towards the Must Try Zone for Buyers (50,800 – 50,899).
If price finds support at 50,899 and rebounds, it may attempt a recovery towards 51,199 → 51,552. A strong close above 51,552 could shift momentum back to the bulls.
Be cautious of bear traps – If the market gaps down but quickly recovers, it could trigger short covering, leading to an upside reversal.
🎯 Pro Tip: If the gap-down occurs near a strong buyer’s support zone, wait for a bullish price action confirmation before entering long trades.
⚠️ Risk Management Tips for Options Traders
🔹 Avoid over-leveraging – Use proper position sizing to manage risk.
🔹 Theta Decay Awareness – If the market consolidates, option premiums will erode rapidly.
🔹 Use Spreads for Protection – Instead of naked options, use spreads to limit risk and improve probability.
🔹 Trade at Key Levels – Avoid impulsive trades; focus on defined support and resistance zones.
📌 Summary & Conclusion
📍 Key Levels to Watch:
🟥 Resistance: 52,129 → 52,335 → 52,500
🟧 No Trade Zone: 51,564 – 51,848
🟩 Support: 51,199 → 50,899 → 50,800
🔸 Bullish Bias: Above 52,129, targeting 52,335 – 52,500
🔸 Bearish Bias: Below 51,350, expecting a fall towards 51,199 – 50,899
🔸 Neutral/Choppy: Inside 51,564 – 51,848, avoid unnecessary trades
🎯 Final Advice:
Stick to the structured trading plan and execute only at key levels.
Avoid emotional trading—wait for confirmation before entering trades.
The first 15-30 minutes after market open will provide better clarity—observe price action before committing to a trade.
📢 Disclaimer
I am not a SEBI-registered analyst. This trading plan is for educational purposes only. Please conduct your own research or consult a financial advisor before making any trades.

BANKNIFTY - Trading Levels and Plan for 28-Mar-2025📌 BANK NIFTY Trading Plan – 28-Mar-2025
📊 Market Overview:
Bank Nifty closed at 51,534, consolidating within a No Trade Zone after a sharp rally. The index is currently at a decision point, where price action at key levels will determine the next move.
This structured plan will help you trade effectively under different opening conditions.
🔼 Scenario 1: Gap-Up Opening (200+ points above 51,750)
A gap-up opening above 51,750 would place Bank Nifty near the Opening Resistance Zone (51,851). The key focus should be on whether the index sustains above resistance or faces rejection.
✅ Plan of Action:
If Bank Nifty sustains above 51,851, it could trigger a rally towards the Profit Booking Zone (52,185 – 52,335). A breakout above this level may extend gains to 52,500+.
If price faces rejection at 51,851 and reverses, it could lead to a pullback towards 51,593 → 51,534. Watch for support confirmation before taking any long positions.
Avoid aggressive longs inside 51,750 – 51,851, as this area could witness profit booking. Wait for a proper retest before entering trades.
🎯 Pro Tip: If the gap-up gets filled within 15 minutes, it signals weak buying strength and may lead to intraday correction.
⚖ Scenario 2: Flat Opening (Within ±200 points, around 51,534)
A flat opening suggests that market participants are waiting for confirmation before taking decisive action. In such cases, it's best to trade only at key breakout/breakdown levels.
✅ Plan of Action:
Upside case: If Bank Nifty breaks and sustains above 51,593, it could move towards 51,750 → 51,851. Observe the price action at these levels before deciding on further longs.
Downside case: If Bank Nifty breaks below 51,534, it could test 51,388. A breakdown below 51,388 may trigger selling towards 51,205.
Sideways caution: If the index trades between 51,534 – 51,593, it indicates a choppy market. Avoid trading inside this range unless there is a clear breakout.
🎯 Pro Tip: In a flat opening scenario, wait for at least one 15-minute candle close to confirm the direction before entering a trade.
🔽 Scenario 3: Gap-Down Opening (200+ points below 51,334)
A gap-down below 51,334 could indicate weakness and profit booking, bringing the index closer to key support zones. The next move depends on whether buyers defend these supports.
✅ Plan of Action:
If price sustains below 51,334, expect a decline towards 51,205. A breakdown below 51,205 could lead to a deeper correction towards the Buyer’s Support Zone (50,987 – 50,891).
If price rebounds from 51,205, it may attempt a recovery towards 51,388 → 51,534. A strong close above 51,534 could invalidate bearish sentiment.
Be cautious of bear traps – If price quickly recovers after a sharp gap-down, it may indicate short covering, leading to an upside reversal.
🎯 Pro Tip: If the gap-down occurs near a strong buyer’s support zone, look for signs of reversal before initiating new shorts.
⚠️ Risk Management Tips for Options Traders
🔹 Avoid over-leveraging – Stick to a fixed capital allocation per trade to reduce risk.
🔹 Theta Decay Awareness – If the market consolidates, option premiums will decay rapidly, impacting option buyers.
🔹 Use Spreads for Protection – Instead of naked options, use spreads to control risk.
🔹 Trade at Key Levels – Avoid random trades; enter only near strong support and resistance zones.
📌 Summary & Conclusion
📍 Key Levels to Watch:
🟥 Resistance: 51,851 → 52,185 → 52,335
🟧 No Trade Zone: 51,534 – 51,593
🟩 Support: 51,388 → 51,205 → 50,987
🔸 Bullish Bias: Above 51,851, targeting 52,185 – 52,335
🔸 Bearish Bias: Below 51,334, expecting a fall towards 51,205 – 50,987
🔸 Neutral/Choppy: Inside 51,534 – 51,593, avoid unnecessary trades
🎯 Final Advice:
Stick to the structured trading plan and execute only at key levels.
Avoid FOMO trades—wait for confirmation before entering.
The first 15-30 minutes after market open will give a clearer direction—observe price action before committing to a trade.
📢 Disclaimer
I am not a SEBI-registered analyst. This trading plan is for educational purposes only. Please conduct your own research or consult a financial advisor before making any trades.

BANKNIFTY : Intraday Trading levels and Plan for 25-Mar-2025🧠 Bank Nifty Trading Plan – 24th March 2025 (Educational & Action-Oriented)
Chart Timeframe: 15-Min | Analysis based on key price behavior and support-resistance zones.
🔍
📈 GAP-UP Opening (Above 50,904 – 51,218)
If Bank Nifty opens with a strong gap-up above the Opening Resistance of 50,904, prices will be entering a retracement resistance zone up to 51,218.
✅ Plan of Action:
• Watch for price exhaustion near 51,218 – a zone where sellers may attempt to trap late buyers.
• Avoid aggressive buying at open. Instead, wait for a rejection candle (like an inverted hammer or bearish engulfing) near resistance.
• If reversal signs appear, look for Put Option entries (OTM PE) with tight SL above 51,250 on 15-min close.
• Bullish continuation only above 51,218 with strong volume. That opens upside targets towards fresh highs.
🛑 Avoid chasing CE after gap-up unless there's a retest and breakout above 51,218.
📌 Key Zone to Watch: 50,904 – 51,218
📊 FLAT Opening (Near 50,460 – 50,570)
Opening near the resistance/support band of 50,462 – 50,570 could lead to consolidation initially.
✅ Plan of Action:
• First 15–30 minutes: Let price settle. If it holds above 50,570, we may see an up move towards 50,904.
• If price breaks below 50,462, expect quick profit booking, and the index may fall toward the green support zone (50,111 – 50,216).
• This is a stock-specific intraday day. Avoid index scalping unless directional clarity comes after first 30 min.
💡 Tip: Straddle players may enjoy decay here, but don't hold beyond consolidation breakout.
📌 Key Levels:
Support: 50,462 – 50,216
Resistance: 50,570 – 50,904
📉 GAP-DOWN Opening (Below 50,216 or 50,111)
A bearish open below the Opening Support Zone (50,111 – 50,216) indicates potential for sharp intraday correction.
✅ Plan of Action:
• Immediate demand may be seen around Last Intraday Support (50,111) or deeper at Buyer's Support 49,852.
• Watch for reversal candles near these zones. A bullish engulfing or pin bar here offers good risk/reward Call buying opportunities.
• SL for CE entry should be below 49,800 on 15-min candle close.
• If 49,852 breaks, expect a sharp selloff. Stay away from longs. Look for PE entries targeting 49,500.
🟢 Safer CE trades only if price respects 50,111 or 49,852 with volume spike.
📌 Important Zones:
• Demand: 50,111 & 49,852
• Breakdown Trigger: Below 49,800
🧰 Risk Management Tips for Options Traders:
• Never go all-in at open – wait for confirmation from first 15–30 min candle.
• Use hedged strategies like bull call spreads or bear put spreads to limit loss and reduce theta decay.
• Respect SL strictly based on 15-min closing levels.
• If VIX is high, premiums will move fast. Trade light, exit early.
• Never average losing trades, especially in options.
📌 Summary & Conclusion:
For 24-Mar-2025, Bank Nifty's range has shifted upwards with new key zones in focus.
Watch for reaction near 50,904 & 51,218 for reversal signals.
Support remains strong near 50,111 & 49,852.
Let the market open, show intent, and only then enter. Patience = Profit!
⚠️ Disclaimer: I am not a SEBI-registered analyst. All views shared are for educational purposes only. Please consult your financial advisor before making any trading decisions.

BankNifty Intraday Support & Resistance Levels for 21.03.2025🔎 Market Recap:
On Thursday, BankNifty opened gap-up, dipped to a low of 49,771.65, and then rallied to a high of 50,155.30, penetrating deep into the Daily Supply Zone (49,703.10 - 50,641.75). It closed at 50,062.85, gaining 360 points over the previous close.
📉 Trend Analysis:
Weekly Trend (50 SMA): Turned sideways from negative, but confirmation depends on Friday’s close.
Daily Trend (50 SMA): Sideways.
📉 Demand/Support Zones
Near Demand/Support (15m): 49,394.40 - 49,546.60
Near Demand/Support (15m): 49,249.15 - 49,309.55
Far Demand/Support (75m): 48,908.20 - 49,125.55
Far Demand/Support (125m): 48,288.30 - 48,481.35
Far Support: Around 47,850 (Multiple Daily Chart supports)
Far Support: 46,077.85 (Low of 4th June 2024)
Far Demand/Support (Daily): 44,633.85 - 45,750.40
📈 Supply/Resistance Zones
Near Supply/Resistance (Daily): 49,703.10 - 50,641.75 (Currently trading inside)
Far Supply/Resistance (Weekly): 50,485.05 - 51,979.75 (Tested once)
Far Supply/Resistance (Weekly): 52,264.55 - 53,775.10
💡 Outlook:
BankNifty is now inside a major Daily Supply Zone, making this a key resistance area to watch. If price sustains above 50,641, we could see a continuation toward the Weekly Supply Zone at 51,979. However, failure to break this zone could trigger a retracement toward 49,400 - 49,250.
📢 Disclaimer:
This analysis is for educational and informational purposes only and should not be considered as financial advice. Trading and investing in the stock market involve risk, and past performance does not guarantee future results. Always conduct your own research and consult with a certified financial advisor before making any trading decisions. The author is not responsible for any financial losses incurred based on this analysis.

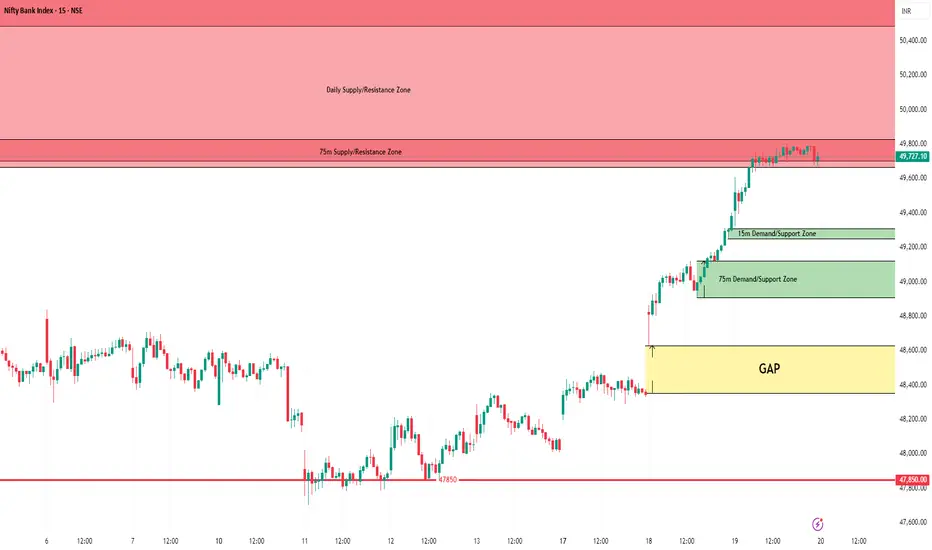
BankNifty Intraday Support & Resistance Levels for 20.03.2025Market Recap:
On Wednesday, BankNifty opened gap-up, dipped to a low of 49,324.80, and then rallied to a high of 49,807.55, entering both the 75m & Daily Supply Zones. It closed flat at 49,702.60, gaining 388 points from the previous close. The Weekly Trend (50 SMA) remains negative, while the Daily Trend (50 SMA) has turned sideways from negative.
Demand/Support Zones
Near Demand/Support Zone (15m): 49,249.15 - 49,309.55
Near Demand/Support Zone (75m): 48,908.20 - 49,121.05
Near Support: Around 47,850 (Multiple supports on the Daily Chart)
Far Support: 46,077.85 (Low of 4th June 2024)
Far Demand/Support Zone (Daily): 44,633.85 - 45,750.40
Supply/Resistance Zones
Near Supply/Resistance Zone (75m): 49,665.95 - 49,829.40 (Tested)
Near Supply/Resistance Zone (Daily): 49,703.10 - 50,641.75 (Tested)
Far Supply/Resistance Zone (Weekly): 50,485.05 - 51,979.75 (Tested)
Outlook
As highlighted in the previous post, BankNifty showed strong bullish momentum and even surpassed the 49,500 mark, as anticipated. However, the short-term trend is now in the overbought zone.
🚨 With multiple supply zones nearby and BankNifty testing the 75m & Daily Supply Zones today, a pullback or correction is possible. Caution is advised when going long at these levels.
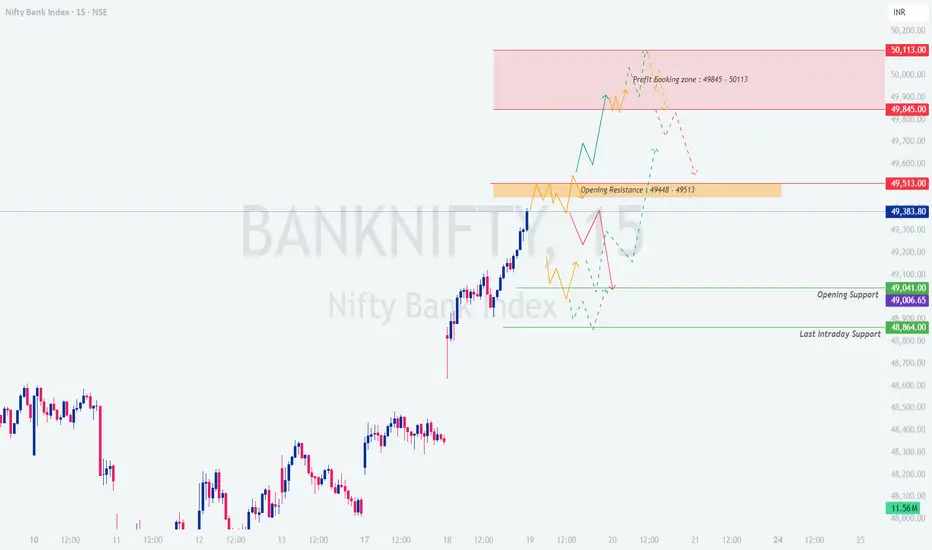
BANKNIFTY : Trading Levels and Plan for 19-March-2025🔥 BANK NIFTY – Intraday Trading Plan for 19-Mar-2025
📍 CMP: 49,383.80
📊 Chart Timeframe: 15-Min
📘 Scenario 1: GAP-UP Opening (200+ points)
If BANK NIFTY opens above 49,585, it will open within or near the upper boundary of the Profit Booking Zone (49,845 – 50,113) .
Opening directly in the Profit Booking Zone usually leads to short-term exhaustion due to profit-taking from recent long positions. Avoid aggressive long positions in the first 15 minutes; instead, monitor for reversal signs such as bearish engulfing or evening star near 49,900–50,100. If the index forms a tight consolidation or fake breakout within the red zone, a short trade can be considered with a stop above 50,120, targeting a retest of 49,585 and possibly 49,513. On the flip side, if price breaks above 50,113 with strong bullish volume and sustains for 15–30 minutes, a fresh uptrend may emerge. In that case, switch bias to buy-on-dips with SL below 50,000.
🧠 Educational Note: After a large gap-up, the early euphoria often fades. Wait for the first trap—either a breakout trap or breakdown trap—to reveal the true direction.
📗 Scenario 2: FLAT Opening (within 100–150 pts)
A flat to mild gap opening around 49,300 – 49,400 keeps the index close to the Opening Resistance zone: 49,448 – 49,513 .
This area may act as a strong inflection point. Watch how price reacts in the first 15 minutes around this resistance. If price breaks above 49,513 with volume and retests this zone successfully, it could head toward 49,845. Conversely, if rejection happens around 49,448–49,513, short opportunities open up with targets at 49,041 and 48,864. Do not take trades within a narrow range unless price gives a clean breakout or breakdown.
🧠 Educational Note: When the market opens flat after a trending day, expect rangebound movement early on. Let it break the opening structure before placing bets.
📙 Scenario 3: GAP-DOWN Opening (200+ points)
In case BANK NIFTY opens below 49,100, it will be around the Opening Support zone: 49,041 – 49,006 or even closer to the Last Intraday Support at 48,864 .
Aggressive selling at open should be avoided unless price breaks below 48,864 decisively. Look for signs of reversal around 49,006 or 48,864. If the market forms double bottom or bullish hammer with a strong follow-up candle, intraday recovery trades may work well. Upside targets in a bounce can be 49,300 and 49,448. If price fails to hold 48,864, expect a decline towards 48,700 – 48,550 zone. Stick to directional trades only after a 15-min candle close below key support.
🧠 Educational Note: Gap-downs often cause panic, but panic selling near support zones can give excellent risk-reward reversal trades. Wait for candle confirmation.
💡 Risk Management Tips for Options Traders 🛡️
✅ Use spreads (e.g., bull call or bear put spreads) to reduce risk from premium erosion.
✅ Avoid overtrading post-gap moves; trade only after structure is confirmed.
✅ Avoid buying OTM options blindly after a gap opening; they lose value fast.
✅ Follow 1:2 or better risk-reward setups. Don’t chase profits.
✅ Place stop-losses based on candle close, not ticks.
✅ Use position sizing to manage risk—don’t risk more than 1–2% of capital per trade.
✅ Don’t average losing option positions. Exit fast if view is invalidated.
📊 Summary & Conclusion
📌 Resistance Zones:
🔺 49,448 – 49,513 (Opening Resistance)
🔺 49,845 – 50,113 (Profit Booking Zone)
📌 Support Zones:
🟩 49,041 – 49,006 (Opening Support)
🟩 48,864 (Last Intraday Support)
🔄 Key Actionable Plan:
— For gap-up, wait for reversal signs in profit booking zone.
— For flat open, focus on breakout or rejection near opening resistance.
— For gap-down, look for reversal near support unless breakdown happens.
🎯 Trade the reaction, not the expectation. Let the price action unfold near key zones, and only then initiate trades with tight stop losses and proper risk reward.
⚠️ Disclaimer: I am not a SEBI registered analyst. This analysis is shared for educational purposes only. Please consult your financial advisor before making any investment or trading decisions.
BANKNIFTY : Intraday Trading Levels and Plan for 18-Mar-2025📅 BANK NIFTY INTRADAY TRADING PLAN – 18th March 2025 (Tuesday)
📊 Chart Timeframe: 15 Min | Reference Closing: 48,347
🔍 Chart Structure Summary:
Bank Nifty closed near the higher band of the No Trade Zone (48,267–48,457). We have a clear structure forming, with important supply and demand levels on both sides. Watch closely how price behaves near Opening Resistance and Buyers’ Support Zones to frame directional trades.
🟥 GAP-UP OPENING (200+ points): Above 48,550+)
If Bank Nifty opens with a big GAP-UP above 48,550, we’ll likely open directly near or above the Last Intraday Resistance Zone (48,639–48,708).
In this case, avoid aggressive buying at open. Wait for a pullback near 48,457–48,550, if supported, fresh longs can be considered.
Target zone becomes Profit Booking Range: 48,834 – 48,894. Only if price sustains above 48,708 for 15-min, then momentum may carry us to 48,894. Book profits gradually. Avoid fresh shorts unless there’s a reversal candle from 48,834+ range.
🧠 Educational Note: Never chase gaps blindly. Let the price cool off and give confirmation around structure zones.
🟨 FLAT OPENING (within 48,267–48,457): No Trade Zone
A flat opening inside the yellow “No Trade Zone” demands caution.
Avoid trading immediately at the open if price is between 48,267–48,457. This area has been consolidation-heavy and may trigger whipsaws. Wait for a breakout above 48,457 to initiate longs with a potential move towards 48,639–48,708. If price breaks below 48,267 with volume, expect a slide towards Last Intraday Support at 48,105.
🧠 Tip: First 30 mins is often a trap in tight-range zones. Let price action confirm strength/weakness before entering.
🟩 GAP-DOWN OPENING (200+ points): Below 48,100)
A gap-down opening near or below 48,105 or 47,950 can offer strong intraday opportunities.
If price opens near Buyers’ Support Zone (47,873–47,944) and shows reversal patterns, go long with SL below 47,873. Upside target can be 48,105 initially and if sustained, then 48,267. On the contrary, if 47,873 breaks convincingly, sellers may drive prices toward 47,700–47,600 zone. Wait for structure to form before picking direction.
🧠 Insight: Buyer zones are often tested with false breakdowns—wait for hourly candle closure to confirm breakdown.
📘 Risk Management Tips for Option Traders:
💡 Trade near structure zones. Avoid trading based purely on option premiums. Always define stop-loss levels before entering a trade. Avoid selling deep OTM options blindly during directional moves. Time decay (Theta) is your enemy in sideways markets—trade only when direction is clear. Position sizing is key—don't risk more than 1–2% of your capital per trade.
📌 Summary & Conclusion:
✅ Key Resistance Levels: 48,457 / 48,708 / 48,894
✅ Key Support Levels: 48,105 / 47,873 / 47,600
✅ No Trade Zone: 48,267–48,457
👉 Trade only on confirmation and be mindful of market traps within the range.
🎯 Focus on structure, patience, and risk control. Let the market come to you.
❗ Disclaimer: I am not a SEBI registered analyst. This plan is shared for educational purposes only. Do your own research or consult your financial advisor before trading.

BankNifty Intraday Support & Resistance Levels for 17.03.2025Thursday’s session saw BankNifty opening with a gap-up, hitting a high of 48,352.45, but failing to sustain, dropping to a low of 48,006.10 by the end of the day. It closed flat at 48,060.40, gaining just 3.75 points from the previous close. Both the Weekly and Daily Trends (50 SMA) remain negative.
Demand/Support Zones
Near Support: Around 47,850 (Multiple supports on the Daily Chart)
Far Support: 46,077.85 (Low of 4th June 2024)
Far Demand/Support Zone (Daily): 44,633.85 - 45,750.40
Supply/Resistance Zones
Near Minor Supply/Resistance Zone (15m): 48,445.25 - 48,530.55
Near Supply/Resistance Zone (125m): 48,743.80 - 48,911.90 (Tested)
Near Supply/Resistance Zone (Daily): 48,764 - 49,455.80 (Tested multiple times)
Far Supply/Resistance Zone (75m): 49,665.95 - 49,829.40
Far Supply/Resistance Zone (Weekly): 50,485.05 - 51,979.75 (Tested)
Outlook
On 11th March, BankNifty broke the multiple-time-tested support at 47,850, making a new low of 47,702.90 and closing below 48,000. However, on 12th & 13th March, it managed to reclaim 48,000 (a key psychological level).
If 48,000 holds, we might see bullish momentum in the coming sessions, with potential upside towards 48,400 - 48,750, and even 49,500 if momentum sustains. However, multiple resistance zones above may keep price movements in check.

BANKNIFTY : Intraday Trading levels and Plan for 17-Mar-2025📊 BANK NIFTY Trading Plan – 17-Mar-2025
Bank Nifty is currently trading near 48,024 and reacting to the Opening Support Zone: 47,975 – 48,027. Chart shows clear zones for both supply and demand. Let’s break it down into three opening scenarios with well-defined trade plans.
🟢 Scenario 1: Gap-Up Opening (200+ points)
If Bank Nifty opens above 48,227 (i.e. directly into or above the Opening Resistance Zone: 48,267 – 48,323), it could witness supply pressure in the short term.
✅ Plan of Action:
If price opens in 48,267 – 48,323, wait and observe the first 15–30 minutes.
A bullish breakout and strong candle above 48,323 with volume can trigger a move towards the last intraday resistance at 48,457.
Above 48,457, next target is the Profit Booking Zone: 48,639 – 48,708, where one can partially book profits.
If price gets rejected from 48,323 and forms lower highs, consider light put positions with strict SL above 48,357.
📝 Why this works: These zones reflect earlier consolidation, where either buyers or sellers dominated. Reaction at this zone determines the intraday trend.
📌 Key Levels:
🔺 Resistance: 48,267 | 48,323 | 48,457
🎯 Target: 48,639 | 48,708
🛑 SL (if shorting near resistance): Above 48,357
🟨 Scenario 2: Flat Opening (Within 100 points)
A flat opening near 48,000 – 48,050 would mean prices open inside the Opening Support Zone: 47,975 – 48,027.
✅ Plan of Action:
Watch how prices behave near 47,975. If it holds and 15-min candle shows bullish rejection, go long for targets of 48,121 – 48,267.
If there's no momentum or a range forms between 47,975 – 48,121, expect consolidation. Trade only near extremes of the range.
Breakdown below 47,975 with follow-through volume can drag prices to 47,839 (gap-down support zone).
Avoid aggressive trades in a sideways market. Be patient for breakout/breakdown confirmation.
📝 Why this works: The market often retests previous zones of buying/selling pressure. A flat opening gives traders the opportunity to assess real-time sentiment based on price reaction at these zones.
📌 Key Levels:
🟧 Support: 47,975 | 47,839
🔺 Resistance: 48,121 | 48,267
📉 Breakdown Target: 47,839 → 47,621
🔻 Scenario 3: Gap-Down Opening (200+ points)
If Bank Nifty opens below 47,839, it would directly test the last intraday support zone, possibly heading towards the Buyer’s Support: 47,527 – 47,621.
✅ Plan of Action:
If price stabilizes around 47,621 – 47,527, observe for reversal patterns like hammer, bullish engulfing or RSI divergence.
A bounce from this zone offers risk-reward favorable longs, with targets of 47,839 – 48,000.
If selling pressure is strong and 15-min candle closes below 47,527, avoid longs — more downside may unfold.
Only consider fresh shorts if price shows consolidation below 47,527, targeting 47,400 – 47,250 levels.
📝 Why this works: Gap-downs often cause panic, but these also provide traps for sellers. Reversal zones like Buyer’s Support give excellent bounce-back trades when combined with price confirmation.
📌 Key Levels:
🔻 Panic Support: 47,621 | 47,527
🎯 Bounce Target: 47,839 | 48,027
🛑 SL (if buying near bottom): Below 47,470
🛡️ Risk Management Tips for Options Traders
🔹 Avoid trading the first 5 minutes: Let volatility settle.
🔹 Time decay alert: Avoid buying far OTM options post 11:30 AM.
🔹 Use spreads: Hedge naked calls or puts with spreads to reduce risk.
🔹 Avoid overleveraging: One trade should not blow your capital. Stick to position sizing.
🔹 Set a Daily Stop Loss: Define your max loss for the day and strictly stop trading if hit.
✅ Summary & Conclusion
📌 Gap-Up Opening: Watch for breakout above 48,323, aim for 48,457 → 48,639, else fade if price rejects resistance.
📌 Flat Opening: Respect 47,975 – 48,027 zone. Longs possible on hold; breakdown leads to 47,839.
📌 Gap-Down Opening: Monitor 47,621 – 47,527 for potential bounce. Breakdown below 47,527 could mean deeper correction.
🎯 The best trades will come from zones where price reacts strongly. Combine price action confirmation with good risk-reward setups.
📜 Disclaimer
I am not a SEBI-registered analyst . This content is intended purely for educational purposes . Please do your own analysis or consult a financial advisor before making any trading or investment decisions.

BANKNIFTY : Intraday Trading Levels and Plan for 13-Mar-2025📘 BANKNIFTY Trading Plan for 13-Mar-2025
Chart Reference: The market is currently placed around 48,055, with defined zones of resistance and support as per the 15-min price action. Based on this, let’s breakdown the plan into different opening scenarios 👇
✅ 1. GAP-UP OPENING (200+ points above previous close)
If BANKNIFTY opens around 48,250–48,400 or higher:
👉 This will place prices near the first key supply zone:
📍 Resistance Zone: 48,319–48,369
🟥 If price opens here, wait for the first 15–30 mins to see if it sustains above the zone.
✅ A strong candle above 48,370 with volume can trigger a long entry for targets:
➤ 48,534 (Last intraday resistance)
➤ 48,890 (Upper Target Zone)
📉 On the flip side, if price fails to sustain this zone and shows rejection with a bearish engulfing or M pattern:
→ Look for shorting opportunities with targets back to 48,085 and even 47,748.
🧠 Important Tip: Avoid rushing into trades at open. Let the first few candles confirm strength or weakness. Use tight SL for long near resistance.
⚖️ 2. FLAT OPENING (within ±100 points of previous close)
If BANKNIFTY opens between 47,950–48,150 range:
📍 Price will be near the middle zone – 48,085 , which is now acting as a pivot for the day.
🔄 Plan here should be range-based trading initially: ✔️ If price sustains above 48,085, intraday long trades can be attempted targeting
➤ 48,319–48,369 (Initial Resistance)
➤ Beyond that, trail for 48,534
🚫 If it rejects from 48,085 and breaks below 48,027, avoid longs and prepare for downside until:
➤ 47,748–47,787 (Green Support Zone)
🧠 Important Tip: Use option spreads in this zone to benefit from time decay and lower directional bias until breakout confirms.
🔻 3. GAP-DOWN OPENING (200+ points below previous close)
If BANKNIFTY opens near 47,700 or lower:
📉 Prices would be near Opening Support: 47,748–47,787
🔍 Watch for bullish price action like bullish engulfing, pin bar or consolidation above this zone: → Go long if it holds and gives reversal signs
🎯 Target: 48,000–48,085 zone
🚫 However, if support breaks with a strong red candle, then:
⚠️ Short trade can be initiated with target:
➤ 47,589 (Final Strong Support Zone)
📉 Break below 47,589 could lead to panic selling towards 47,400–47,300.
🧠 Important Tip: Gap-down opens can cause high IV. Use proper hedging (e.g. bear put spreads or long straddle if expecting a reversal) to reduce premium decay.
🛡️ Risk Management Tips for Options Traders
Never trade without a stop-loss. Use a closing-based SL on 15-min candles for directional trades. Avoid buying deep OTM options after 12 PM unless a breakout or breakdown is confirmed. Use option spreads (Bull Call / Bear Put / Iron Condor) to reduce theta decay impact. Avoid overtrading in choppy zones; preserve capital for trending opportunities. Reduce position size when volatility spikes or premiums are inflated.
📌 Summary & Conclusion
✅ Key Resistance Zones: 48,319–48,369 🔺 48,534 🔺 48,890
✅ Key Support Zones: 47,748–47,787 🔻 47,589 (critical level)
🎯 Let price action around these zones guide your trade. React, don’t predict!
⚠️ Disclaimer
I am not a SEBI registered analyst. This analysis is shared for educational purposes only. Please do your own research or consult with a financial advisor before making any trading decisions.

[INTRADAY] #BANKNIFTY PE & CE Levels(11/03/2025)Today will be slightly gap down opening expected in banknifty. After opening if it's sustain above 48050 and give reversal then possible some bullish rally in index. Upside 48450 level will act as a strong resistance for today's session. Any strong bullish side rally only expected above 48550 level. In case banknifty starts trading below 47950 level then there will be sharp downside rally possible in index upto 47550 level.

BANKNIFTY - Intraday Trading levels and Plan for 11-Mar-2025📅 BANK NIFTY TRADING PLAN – 11-Mar-2025
🕘 Time Frame: 15-Minutes | 📍 Strategy Type: Structure + Psychological Zones
📉 Yesterday Close: 48,168
📌 Gap Reference: Consider 200+ points as significant gap for tomorrow's session.
🔼 1. GAP-UP OPENING (Above 48,368+)
A gap-up above 48,368+ may place prices directly inside or near the Golden Retracement Zone (48,035–48,299) or even challenge the first resistance of 48,412 / 48,626.
🧠 Plan of Action:
If opening is around 48,400–48,500, wait for price action confirmation near 48,626, which is also last intraday resistance.
If you see a rejection candle or bearish engulfing pattern, this is an opportunity to go short with SL above 48,868.
Partial profit can be booked around 48,168–48,035 zone.
On strong breakout and hourly close above 48,868, one may consider riding long till 49,113 with strict SL below 48,626.
🎯 Short Trigger Zone: 48,600–48,800
📈 Long Trigger Zone (Breakout): Above 48,868 with volume
➖ 2. FLAT OPENING (±100 points near 48,168)
This is the most delicate opening as price will remain inside the Opening Resistance/Support Zone (48,035–48,299). Whipsaws are common here.
🧠 Plan of Action:
Avoid first 30 mins of trade to let price settle.
If Bank Nifty bounces from 48,035–48,100, and forms a bullish candle, consider it a low-risk long opportunity with SL below 48,000.
Upside target remains 48,412 / 48,626.
However, if price decisively breaks below 48,035, especially after 10:30 AM with volume, you may consider shorting with SL above 48,168 targeting 47,573 – 47,363.
🔎 Key Tip: Flat openings require patience. Wait for strong 15-min candle outside the support/resistance band before taking action.
🔽 3. GAP-DOWN OPENING (Below 47,968)
A gap-down below 47,968 indicates bearish control and may bring the price directly into the “Must Try Zone for Buyers” (47,573 – 47,363).
🧠 Plan of Action:
If price opens around 47,600–47,400, wait for a 15-min bullish reversal candle (like hammer, bullish engulfing).
You can consider a long position with SL below 47,363 (preferably on hourly close).
If buyers fail to protect this zone and price sustains below 47,363, this will trigger fresh downside — avoid catching falling knives and switch to short bias.
🎯 Buy Zone: 47,573 – 47,363 (Only on reversal pattern confirmation)
📉 Breakdown Zone: Below 47,363 with hourly candle
💡 Risk Management Tips for Options Traders:
Never buy options blindly on open – wait for direction clarity after the first 15-30 mins. Use spreads (Bull Call or Bear Put) near key zones to minimize premium decay. Place hard SL on premium or index level — whichever hits first. Avoid over-leveraging on gap-up/gap-down — IV crush can kill premiums even if direction is right. Book partial profits and trail stop-loss to reduce emotional decisions.
📌 Summary & Conclusion:
Watch 48,626 as a major resistance — rejection here may bring intraday weakness.
Key support lies at 48,035 and deeper at 47,573 – 47,363, which is a critical make-or-break zone.
Gap-up = Cautious short near resistance
Flat = Wait for structure to unfold
Gap-down = Reversal play or breakdown opportunity based on price reaction
Always let the price action confirm your bias and follow your plan with discipline.
⚠️ Disclaimer: I am not a SEBI-registered analyst. This analysis is shared for educational purposes only. Please consult your financial advisor before making any trading decisions.

BANKNIFTY : Intraday Trading levels and Plan for 10-Mar-2025📌 Previous Close: 48,453
📍 No Trade Zone: 48,300 – 48,523
📈 Last Intraday Resistance: 48,944
📉 Last Intraday Support: 48,038
📌 Key Reversal Zone for Buyers: 47,363 – 47,573
📍 Scenario 1: Gap-Up Opening (🔼 +200 points or more)
If Bank Nifty opens around or above 48,650 – 48,700, we are entering the upper boundary of the last resistance zone, and the market may either show strength or immediately trigger profit booking.
Wait & Watch in Opening: Let the price stabilize in the first 15-30 minutes. If Bank Nifty sustains above 48,944, we could see a quick rally toward the upper profit booking zone 49,113 – 49,278.
Reversal Possibility: This is also a possible rejection zone. If Bank Nifty shows reversal signs near 48,944 – 49,113, traders can look for short trades with stop-loss above 49,278, targeting 48,650 and 48,523 as immediate supports.
Avoid Longs near Top Zone: Booking profits is advised rather than initiating fresh longs in this zone unless a very strong bullish candle closes above 49,278 on 15-minute time frame.
📢 Educational Insight: A gap-up into resistance often invites sellers. Don’t chase green candles blindly. Let structure confirm strength.
📍 Scenario 2: Flat Opening (±100 points range)
If Bank Nifty opens between 48,400 – 48,500, we are inside the “No Trade Zone.” This zone usually indicates indecision or lack of momentum in the early part of the session.
Wait for Breakout or Breakdown: No fresh trade unless price breaks 48,523 on the upside or 48,300 on the downside with good volume.
Above 48,523: A bullish breakout may trigger short-term buying with upside targets of 48,635 and then 48,944.
Below 48,300: A bearish breakdown opens room till 48,038 and possibly to 47,573, the “must try” zone for buyers.
📢 Educational Insight: The middle of the range is where retail traders often get trapped. Stay out until direction is clear. Trade the edges, not the middle.
📍 Scenario 3: Gap-Down Opening (🔽 -200 points or more)
If Bank Nifty opens near or below 48,200 – 48,100, bearish sentiment will dominate. Immediate support lies at 48,038. Below this, things could get even more interesting.
Reversal Zone Alert: Watch how price reacts near 48,038. A strong bullish reversal candle here could give a risk-reward favorable long trade toward 48,300 – 48,523.
Breakdown Below 48,038: Opens the gates for a larger fall towards 47,573 and even 47,363, where bulls might step in aggressively.
Aggressive Shorts: Only if price sustains below 48,038 with momentum, look for intraday puts or bear spreads.
For Reversal Buyers: Ideal zone for buying would be in the range of 47,363 – 47,573, only if price shows base formation with demand candle.
📢 Educational Insight: Don’t panic-buy a gap down unless strong reversal signs appear. Let sellers exhaust themselves before stepping in.
🛡️ Risk Management Tips for Options Traders
✅ Avoid Overleveraging – Never go all-in on the first trade. Use only a portion of your capital.
✅ Always Use Stop Loss – Especially if trading naked options. Protect your capital like a warrior.
✅ Time Decay Caution – Avoid holding long options too late in the day unless strong move is confirmed.
✅ Prefer Spreads – In volatile zones, go with defined-risk strategies like debit or credit spreads.
✅ Avoid First 15 Minutes – Let the market set a tone before jumping in. This reduces emotional entries.
📌 Summary & Conclusion
🟩 Above 48,944 → Bullish territory. Targets: 49,113 → 49,278
🟧 Between 48,300 – 48,523 → No Trade Zone. Wait for confirmation.
🟥 Below 48,038 → Bearish zone with potential downside to 47,573 → 47,363
✅ 47,363 – 47,573 is a high-probability reversal zone for buyers if tested.
⚠️ Be a disciplined trader – let the setup come to you. Stick to your plan, and manage risk like a pro. 💪
⚠️ Disclaimer
I am not a SEBI-registered analyst. This trading plan is shared for educational purposes only. Please do your own analysis or consult with a financial advisor before making any trading decisions.
📢 #BankNifty #TradingPlan #OptionsTrading #StockMarketIndia #TechnicalAnalysis #TradingView #PriceAction #NSE #BankNiftyLevels #RiskManagement

BANKNIFTY : Intraday Trading levels and Plan for 06-Mar-2025Market Overview:
Bank Nifty closed at 48,506.40, and the following levels will be crucial for tomorrow’s session:
🔴 Last Intraday Resistance: 48,944
🟥 Opening Support Resistance: 48,713
🟠 Opening Resistance / Support Zone: 48,524
🟩 Opening Support Zone: 48,245 - 48,297
🟢 Last Intraday Support: 48,012
🟢 Strong Downside Support: 47,739
Considering a 200+ point gap opening, let’s analyze the possible trading scenarios.
🟢 Scenario 1: Gap-Up Opening (200+ Points Above 48,700)
If Bank Nifty opens above 48,700, it enters the Opening Support Resistance Zone and approaches the upper supply areas.
Sustaining Above 48,713 – A stable move above this level indicates strength, with potential upside toward the Last Intraday Resistance (48,944).
Rejection at 48,713 – If price fails to hold, a pullback toward the Opening Resistance/Support at 48,524 is likely.
Breakout Above 48,944 – If momentum is strong, expect an extended rally toward 49,100+, but be cautious of profit booking.
📌 Plan of Action:
Buy above 48,713 with a target of 48,944, keeping SL below 48,600.
Sell if 48,713 is rejected, targeting 48,524 with SL above 48,750.
Options traders can use 48,700 CE for longs and 48,900 PE if resistance holds.
🟡 Scenario 2: Flat Opening (Within 48,400 - 48,550)
A flat opening around the Opening Resistance / Support Zone (48,524 - 48,506) suggests a balanced market, requiring confirmation for further direction.
Sustaining Above 48,524 – This level needs to hold for an upside push toward 48,713, with a potential breakout to 48,944.
Breaking Below 48,506 – If price moves downward, the first support lies at 48,297, followed by 48,245.
Sideways Action Between 48,450 - 48,524 – If price consolidates in this range, wait for a decisive breakout before entering a trade.
📌 Plan of Action:
Buy above 48,524, targeting 48,713, with SL at 48,450.
Sell below 48,506, targeting 48,297, with SL at 48,600.
Options traders can use 48,600 CE for bullish trades and 48,400 PE for bearish trades.
🔴 Scenario 3: Gap-Down Opening (200+ Points Below 48,300)
A gap-down below 48,300 brings Bank Nifty into the Opening Support Zone (48,245 - 48,297).
Holding 48,245 – If buyers step in at this level, a bounce toward 48,524 is possible.
Breaking 48,245 – A breakdown signals weakness, with the next target at 48,012 (Last Intraday Support).
Breaking Below 48,012 – If further selling occurs, expect downside till 47,739, where major buying interest might emerge.
📌 Plan of Action:
Buy near 48,245, targeting 48,524, if support holds.
Sell below 48,245, targeting 48,012, with SL at 48,320.
Options traders can consider 48,200 PE for breakdowns and 48,300 CE for rebounds.
📊 Risk Management Tips for Options Trading
✅ Use Stop Loss on an Hourly Close Basis – Avoid holding options if the trend invalidates.
✅ Avoid Trading in Choppy Ranges – Let price break key levels before entering.
✅ Monitor India VIX – High volatility may cause sharp moves, adjust position sizing accordingly.
✅ Use Partial Profit Booking – Lock-in gains at resistance/support levels.
✅ Avoid Holding Positions Overnight – If the market is unclear, carry-forwarding options may lead to overnight risks.
📌 Summary & Conclusion
Bullish Bias: Above 48,713, Bank Nifty can test 48,944.
Range-Bound: If trading between 48,400 - 48,524, wait for a breakout.
Bearish Bias: Below 48,245, weakness can extend toward 48,012 or lower.
📌 Best Risk-Reward Trades:
Buy above 48,713 for 48,944.
Sell below 48,245 for 48,012.
Wait for confirmation in the 48,400 - 48,524 range.
⚠️ Disclaimer:
I am not a SEBI-registered analyst. This analysis is for educational purposes only. Please do your own research or consult a financial advisor before making any trading decisions.

BankNifty Intraday Support & Resistance Levels for 04.03.2025Monday’s session saw BankNifty opening with a gap-up, hitting a high of 48,574.70, but it couldn’t hold and dropped to a low of 47,841.30. However, it recovered slightly and closed at 48,114.30, losing 230 points from the previous close. Both the Weekly Trend (50 SMA) and Daily Trend (50 SMA) remain negative.
Demand/Support Zones
Near Support: Around 47,850 (Triple Bottom on Daily Chart)
Far Support: 46,077.85 (Low of 4th June 2024)
Far Demand/Support Zone (Daily): 44,633.85 - 45,750.40
Supply/Resistance Zones
Near Supply/Resistance Zone (125m): 48,743.80 - 48,911.90
Near Supply/Resistance Zone (Daily): 48,981.20 - 49,455.80
Far Supply/Resistance Zone (75m): 49,665.95 - 49,829.40
Far Supply/Resistance Zone (Weekly): 50,485.05 - 51,979.75 (Tested)
Outlook
BankNifty has dropped 6,626 points (12%) in the last 5 months from its All-Time High of 54,467.35. Today’s low of 47,841.30 is very close to the previous lows on 13th Jan 2025 (47,898.35) and 27th Jan 2025 (47,844.15), forming a potential Triple Bottom around 47,850. The index closed above 48,000, which could indicate a short-term bounce if the support holds. However, multiple supply zones above suggest strong selling pressure at higher levels. Any upside move may face resistance, making a Sell-on-Rise strategy more favorable until a breakout is confirmed.
BANKNIFTY : Intraday Trading Levels and Plan – 27-Feb-2025📌
This analysis provides a comprehensive trading plan for the BANKNIFTY index on February 27, 2025, covering all possible opening scenarios. We will evaluate Gap-Up, Flat, and Gap-Down openings (with gaps of 200+ points) and outline clear action points, key levels, and risk management strategies. This plan is designed to help traders navigate the market with precision and discipline. 📈🔍
🔹 Scenario 1: Gap-Up Opening (200+ points)
If BANKNIFTY opens above 48,998 (a gap of 200+ points from the previous close of 48,798), it signals strong bullish momentum. This opening suggests aggressive buying interest, potentially driving prices higher.
If the price sustains above 48,998, it could target the profit-booking zone of 49,117–49,400. This zone is a key resistance area where selling pressure may intensify due to historical resistance and recent highs.
If the price faces rejection at 49,117–49,400, a reversal trade could be considered, targeting a pullback to 48,878–48,798 (last intraday resistance and previous close).
Should the price break above 49,400 with strong momentum (e.g., high volume and bullish candlestick patterns), we might see a rally toward 49,600 or higher.
✅ Trade Plan:
✔️ Buy on a breakout and retest of 48,998 , targeting 49,117–49,400. Use a stop-loss below 48,798 to manage risk.
✔️ Short if the price rejects 49,117–49,400, aiming for 48,878–48,798. Place a stop-loss above 49,400 to limit potential losses.
Explanation: A Gap-Up opening of 200+ points reflects significant bullish sentiment, but chasing the gap immediately can be risky due to volatility. Waiting for a retest of 48,998 confirms bullish intent, while the resistance at 49,117–49,400 acts as a natural profit-taking zone. A rejection at this level could signal a shorting opportunity if bearish momentum builds.
🔹 Scenario 2: Flat Opening (Near 48,798–48,878)
If BANKNIFTY opens within the range of 48,798–48,878, it suggests a balanced market with no clear directional bias. This zone acts as a critical opening support/resistance area where price action could consolidate or break out.
A breakout above 48,878 could drive prices toward 49,117–49,400, signaling bullish momentum.
A breakdown below 48,798 might lead to selling pressure, targeting 48,396–48,167 (opening support and last intraday support) or even 47,573 (buyer’s support for a possible reversal).
✅ Trade Plan:
✔️ Buy above 48,878 , targeting 49,117–49,400. Use a stop-loss below 48,798 to protect against a false breakout.
✔️ Sell below 48,798 , targeting 48,396–48,167 or 47,573. Set a stop-loss above 48,878 to manage downside risk.
Explanation: A Flat opening often results in consolidation, making it challenging to trade without confirmation. The 48,798–48,878 range is a no-trade zone unless a decisive breakout occurs. Traders should wait for clear price action (e.g., strong candlestick patterns or increased volume) to avoid fake moves and ensure higher probability trades.
🔹 Scenario 3: Gap-Down Opening (200+ points)
If BANKNIFTY opens below 48,598 (a gap of 200+ points from the previous close of 48,798), it signals bearish sentiment and potential weakness in the market.
Immediate support lies at 48,396–48,167 (opening support and last intraday support). If this holds, a pullback toward 48,798–48,878 could occur.
If 48,396 breaks with strong selling pressure, expect further downside toward 47,573 (buyer’s support for a possible reversal).
✅ Trade Plan:
✔️ Buy near 48,396 , targeting a pullback to 48,798–48,878. Use a stop-loss below 48,167 to limit risk.
✔️ Short below 48,396 , targeting 47,573. Place a stop-loss above 48,396 to protect against a quick recovery.
Explanation: A Gap-Down opening of 200+ points indicates panic or profit-taking, but prices can rebound if support levels hold. Waiting for confirmation near 48,396 ensures the price isn’t just oversold, while a break below this level confirms bearish momentum for shorting opportunities. The 47,573 zone offers a potential reversal point if buying interest emerges.
📌 Risk Management Tips for Options Trading 💡
🛑 Always Use a Strict Stop-Loss: Protect your capital by setting stop-loss orders at key support/resistance levels to limit potential losses.
🎯 Take Partial Profits: Lock in gains at intermediate targets (e.g., 49,117 or 48,396) to secure profits while allowing room for further moves.
🕰️ Avoid Overtrading: Stick to the plan and wait for clear price action confirmation—don’t force trades in uncertain conditions.
💰 Use Proper Position Sizing: Risk only a small percentage of your capital (e.g., 1–2%) per trade to ensure longevity in the market.
📌 Summary & Conclusion 🎯
✔️ Bullish Above: 48,878 → Target: 49,117–49,400.
✔️ Bearish Below: 48,798 → Target: 48,396–48,167 or 47,573.
✔️ No Trade Zone: 48,798–48,878 (Wait for a breakout).
Trade with discipline, follow your plan, and prioritize risk management to navigate the BANKNIFTY market effectively on February 27, 2025. 🚀
⚠️ Disclaimer
I am not a SEBI-registered analyst. This analysis is for educational purposes only. Please consult your financial advisor before making any trading decisions. 📉📈

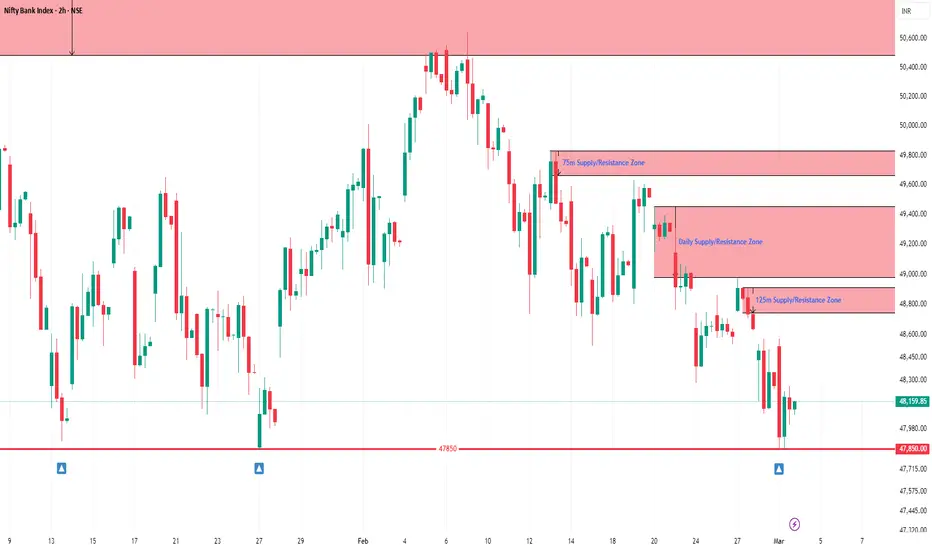
BankNifty Intraday Support & Resistance Levels for 25.02.2025Monday’s session started with a gap-down of 350 points at 48,628.80. Made day low of 48,281.90, entered the 125m Demand Zone (47,981.35 - 48,319.20), where it found support and rebounded to day high of 48,748.40. It closed at 48,651.95, losing 329 points from the previous close. The Weekly Trend (50 SMA) remains negative, while the Daily Trend (50 SMA) stays sideways.
Demand/Support Zones
Near Demand/Support Zone (125m): 47,981.35 - 48,319.20 (tested)
Far Support: 46,077.85 (Low of 4th June 2024)
Far Demand/Support Zone (Daily): 44,633.85 - 45,750.40
Supply/Resistance Zones
Near Supply/Resistance Zone (15m): 48,959.15 - 49,058.15
Far Supply/Resistance Zone (30m): 49,288.95 - 49,396.65
Far Supply/Resistance Zone (75m): 49,665.95 - 49,829.40
Far Supply/Resistance Zone (Daily): 49,703.10 - 50,641.75
Outlook
BankNifty respected 125m Demand Zone and bounced back but the gap wasn't filled. The 48,900 - 49,000 region will be crucial for further upside momentum. However, with multiple resistance levels ahead and a weak broader trend, a Sell-on-Rise approach remains favorable unless a decisive breakout is seen above 50650.

BankNifty Intraday Support & Resistance Levels for 20.02.2025Wednesday’s session saw BankNifty opening gap-down, hitting a low of 48,804 before staging a strong rally to 49,509.75. It later dipped to 49,281, but rebounded again to close at 49,570.10, gaining 483 points over the previous close. The Weekly Trend (50 SMA) remains negative, while the Daily Trend (50 SMA) is sideways, signaling mixed sentiment.
Demand/Support Zones
Near Demand/Support Zone (5m): 49,365.45 - 49,404.55
Near Demand/Support Zone (5m): 48,928.10 - 49,038.45
Far Demand/Support Zone (125m): 47,981.35 - 48,319.20
Far Support Level: 46,077.85 (Low of 4th June 2024)
Far Demand/Support Zone (Daily): 44,633.85 - 45,750.40
Supply/Resistance Zones
Near Supply/Resistance Zone (75m): 49,665.95 - 49,829.40
Far Supply/Resistance Zone (15m): 49,949.75 - 50,049.10
Far Supply/Resistance Zone (30m): 50,146.10 - 50,248.35
Far Supply/Resistance Zone (Weekly): 50,485.05 - 51,979.75 (Tested)
Far Supply/Resistance Zone (Weekly): 52,264.55 - 53,775.10
Outlook
BankNifty is showing strength, holding above key support levels. If it sustains current levels, we may see the rally extend towards 50,000. However, multiple supply zones above 49,800 could create resistance. A breakout above 50,050 may lead to further upside momentum!
Disclaimer:
"This content is for educational purposes only and reflects personal opinions. It is not investment advice or a recommendation to buy/sell any securities. I am not a SEBI-registered advisor. Please consult a qualified financial professional before making any investment decisions."

BANKNIFTY : Trading Levels and Plan for 20-Feb-2025This analysis covers all possible opening conditions for BANKNIFTY on 20-Feb-2025 and provides a structured trading plan. We will consider:
✅ Gap-Up Opening (200+ points)
✅ Flat Opening (Near 49,577 - 49,658)
✅ Gap-Down Opening (200+ points)
Each scenario has clear action points and risk management tips. 📈🔥
🔹 Scenario 1: Gap-Up Opening (200+ points)
If BANKNIFTY opens above 49,658, this suggests bullish momentum.
Sustaining above 49,658 can push the index towards 50,000 - 50,193 (Profit Booking Zone).
At 50,000 - 50,193, expect resistance—if price rejects here, a reversal trade is possible targeting 49,700 - 49,600.
If price breaks 50,193 with strength, we may see a new rally towards 50,350+ levels.
✅ Trade Plan:
✔️ Buy on a breakout & retest of 49,658, targeting 50,000 - 50,193.
✔️ Short if price rejects 50,193, aiming for 49,700 - 49,600.
⚠️ Risk Tip: Avoid chasing a strong gap-up immediately. Wait for price to settle before taking a position.
🔹 Scenario 2: Flat Opening (Near 49,519 - 49,658)
If BANKNIFTY opens within the 49,577 - 49,658 zone, this could act as an Opening Resistance/Support zone.
A breakout above 49,658 can push prices towards 50,000 - 50,193.
A breakdown below 49,401 (Opening Support) may lead to selling pressure, targeting 49,336 - 49,095.
✅ Trade Plan:
✔️ Buy above 49,658, targeting 50,000 - 50,193.
✔️ Sell below 49,401, targeting 49,336 - 49,095.
⚠️ Risk Tip: Avoid trading in the 49,500 - 49,600 range unless a strong breakout happens. Consolidation in this zone can lead to fake moves.
🔹 Scenario 3: Gap-Down Opening (200+ points)
If BANKNIFTY opens below 49,336, it signals weakness.
Immediate support exists at 49,095 - 49,000 (Last Intraday Support). If this holds, expect a possible pullback towards 49,400 - 49,500.
If 49,095 breaks, expect further downside towards 48,760.
✅ Trade Plan:
✔️ Buy near 49,095, targeting a pullback to 49,401 - 49,519.
✔️ Short below 49,095, targeting 48,760 and lower.
⚠️ Risk Tip: If BANKNIFTY gaps down but quickly recovers 49,095, avoid shorts and wait for price confirmation before entering trades.
📌 Risk Management Tips for Options Trading 💡
🛑 Always use a strict stop-loss to protect capital.
🎯 Take partial profits at key levels to lock in gains.
🕰️ Avoid overtrading—wait for price action confirmation.
💰 Use proper position sizing to manage risk.
📌 Summary & Conclusion 🎯
✔️ Bullish Above: 49,658 → Target: 50,000 - 50,193.
✔️ Bearish Below: 49,401 → Target: 49,336 - 49,095.
✔️ No Trade Zone: 49,500 - 49,600 (Wait for breakout).
Trade with a plan, manage risk wisely, and stay disciplined. ✅🚀
⚠️ Disclaimer
I am not a SEBI-registered analyst. This analysis is for educational purposes only. Please consult your financial advisor before making any trades. 📉📈

BANKNIFTY : Trading levels and plan for 19-Feb-2025
🔹 Key Levels for the Day:
📈 Resistance Zone: 49,208 - 49,659
📉 Support Zone: 48,918 - 48,600
🔄 Profit Booking Zone: 49,579 - 49,659
📍 Scenario 1: Gap-Up Opening (200+ points)
If BANKNIFTY opens with a gap-up above 49,208 , we need to observe whether it sustains above this level.
If it holds above 49,208, we can expect an upside movement towards 49,579 - 49,659 (profit booking zone).
A breakout above 49,659 can take it towards 50,001, but with caution as profit booking may occur.
In case of rejection from 49,659, look for a shorting opportunity back towards 49,208.
🔹 Trade Plan: Buy on dips near 49,208 with SL below 49,100 for a target of 49,579. If rejected from 49,659, initiate a short trade with SL above 49,700.
📍 Scenario 2: Flat Opening (Within 49,039 - 49,208)
If BANKNIFTY consolidates between 49,039 - 49,208, wait for a decisive breakout.
A breakout above 49,208 can push prices towards 49,579.
A breakdown below 49,039 will lead to a decline towards 48,918 - 48,600.
🔹 Trade Plan: Buy on breakout of 49,208 with SL below 49,100 for targets of 49,579+. If it breaks below 49,039, go short with SL above 49,100 for a target of 48,918.
📍 Scenario 3: Gap-Down Opening (200+ points below 48,918)
If BANKNIFTY opens below 48,918, we need to see if it finds support near 48,600 (last intraday support).
A bounce from 48,600 can lead to a recovery towards 48,918.
If 48,600 breaks, expect further downside towards 48,400-48,300.
🔹 Trade Plan: Look for a buying opportunity near 48,600 with SL below 48,500 for a potential bounce towards 48,918. If 48,600 breaks, short for a target of 48,400-48,300.
💡 Risk Management Tips for Options Trading 💡
✅ Always maintain a proper stop-loss (SL) to manage risk.
✅ Avoid buying deep OTM options unless you have a high conviction breakout.
✅ For intraday trading, focus on ATM or slightly ITM options for better risk-reward.
✅ If volatility is high, switch to spreads like Bull Call Spread or Bear Put Spread to reduce risk.
✅ Book partial profits as levels are achieved to lock in gains.
🔎 Summary & Conclusion
📌 Upside movement expected above 49,208 targeting 49,579-49,659. A rejection here can push prices lower.
📌 Breakdown below 49,039 can take it towards 48,918, with 48,600 being a critical support.
📌 Risk management is key— stick to your stop-loss!
⚠️ Disclaimer: I am not a SEBI-registered analyst. This analysis is for educational purposes only. Please trade at your own risk. 📊📉📈
