BANKNIFTY : Trading levels and Plan for 24-Dec-2024Plan vs. Actual Performance (23-Dec-2024):
In today's session, Bank Nifty opened near the 51,097-51,272 resistance/support zone, as anticipated in the plan.
Prices respected the Opening Resistance/Support zone , consolidating within this range initially (yellow trend indicating sideways movement).
A breakout above 51,272 was short-lived, and prices struggled to sustain higher levels, aligning with the plan's cautionary note about rejection patterns.
The range-bound behavior observed in the chart perfectly matches the yellow zone prediction in the plan, highlighting indecision in the market before testing key levels.
No significant bullish or bearish breakout was sustained, demonstrating the market's hesitancy near the projected levels.
Key Takeaway: The trading plan's highlighted zones (resistance and support) provided reliable levels for observing price action and market trends, with the sideways movement being accurately forecasted.
The chart for the 24th of December 2024 provides a detailed plan for different opening scenarios, including gap up, flat, and gap down openings. This plan will help traders navigate the market effectively.
Trading Plan for 24-Dec-2024
Gap Up Opening (200+ points)
If the market opens above 51,593.00, look for a bullish trend continuation towards the next resistance level at 51,719.00. Monitor price action around 51,719.00. If the price sustains above this level, the next target would be 51,962.00. Place a stop loss below 51,593.00 to manage risk.
Flat Opening
If the market opens around the previous close of 51,287.25, observe the price action within the no trade zone (51,306.90 to 51,353.00). A breakout above 51,353.00 could signal a bullish trend towards 51,420.95. A breakdown below 51,306.90 could indicate a bearish trend towards 51,267.00. Manage risk by placing stop losses just outside the no trade zone.
Gap Down Opening (200+ points)
If the market opens below 51,073.00, look for a bearish trend continuation towards the next support level at 51,010.00. Monitor price action around 51,010.00. If the price sustains below this level, the next target would be 50,781.00. Place a stop loss above 51,073.00 to manage risk.
Risk Management Tips for Options Trading
Always use stop losses to limit potential losses. Avoid over-leveraging; trade within your risk tolerance. Diversify your trades to spread risk. Keep an eye on implied volatility and time decay when trading options. Regularly review and adjust your trading plan based on market conditions.
Summary and Conclusion
The trading plan for the 24th of December 2024 outlines strategies for different opening scenarios, including gap up, flat, and gap down openings. By following the plan and adhering to risk management principles, traders can navigate the market effectively. Remember, the yellow trend indicates sideways movement, the green trend indicates a bullish trend, and the red trend indicates a bearish trend.
Disclaimer
I am not a SEBI registered analyst. This plan is for educational purposes only and should not be considered financial advice. Always conduct your own research and consult with a professional before making any trading decisions.
Bankniftyprediction

BANKNIFTY : Trading Levels and Plan for 23-Dec-202423-Dec-2024 Bank Nifty Trading Plan
Color-Coding:
Yellow: Sideways trend. Green: Bullish trend. Red: Bearish trend.
23-Dec-2024 Trading Scenarios:
Gap Up Opening (+200 points or more):
If Bank Nifty opens above 51,272 but below 51,420 , this range acts as an immediate resistance zone. Watch for bearish rejection patterns like a double top or bearish engulfing to initiate short trades targeting 51,097-50,872 .
If prices sustain above 51,420 , the sentiment shifts bullish. Consider long trades above this level with targets of 51,832-52,000 . Use a stop loss at 51,250 to manage risk effectively.
Flat Opening:
A flat opening near 50,872-50,664 suggests consolidation. Wait for a breakout above 51,097 for long trades targeting 51,272-51,420 .
Alternatively, a breakdown below 50,664 may trigger bearish momentum. Short trades can be initiated below this level, targeting 50,069-49,800 . Use hourly candle closes to confirm breakdown or breakout for improved accuracy.
Gap Down Opening (-200 points or more):
A gap down below 50,664 puts immediate focus on 50,069 as a critical support level. Look for bullish reversal patterns (e.g., hammer or morning star) within this zone to initiate long trades targeting 50,664-50,872 .
If prices fail to hold 50,069 , expect extended bearish pressure, with short trade targets at 49,800-49,500 . Maintain a stop loss at 50,150 to protect capital.
Risk Management Tips for Options Trading:
Prefer buying options in volatile markets instead of selling to limit risk.
Use spreads (e.g., bull call spreads or bear put spreads) for defined risk-reward.
Monitor implied volatility (IV) levels; higher IV suggests premium decay risk for sellers.
Cap exposure to a fixed percentage of your trading capital per trade.
Summary & Conclusion:
Bank Nifty’s movement on 23-Dec-2024 will revolve around critical zones, especially 51,097-51,272 and 50,664-50,069 . Respect these levels and wait for confirmations before initiating trades. Effective risk management and disciplined execution are key to navigating volatile markets.
Disclaimer:
I am not a SEBI-registered analyst. This analysis is for educational purposes only. Please consult your financial advisor before making trading decisions.

BANKNIFTY : Trading Levels and Plan for 20-Dec-2024
Intro: Review of the Previous Day’s Plan
As mentioned in Yesterday's plan BANKNIFTY has found support from level mentioned in Chart yesterday. The chart movement adhered closely to the plan, with Bank Nifty consolidating within the highlighted zones before attempting an upward breakout. The yellow trend on the chart depicted a sideways consolidation, while green and red trends outlined bullish and bearish moves respectively. Today, we prepare for potential scenarios based on expected market openings.
Plan for Different Opening Scenarios
Gap-Up Opening (200+ points above 51,902):
If Bank Nifty opens above 52,068, the index is likely entering the resistance zone highlighted in orange. Watch for rejection signals around 52,381, the last intraday resistance.
Plan of Action:
Look for bearish reversal candles or patterns near 52,381 to initiate short positions with a target of 52,068 and a stop loss above 52,450.
In case of a sustained breakout above 52,381, consider fresh longs targeting 52,600 or higher. Ensure confirmation with strong volume.
Key Tips: If trading options, focus on slightly OTM puts for shorts. For breakout trades, consider ATM or slightly OTM calls.
Flat Opening (Within 51,800-52,000 range):
A flat opening near 51,902 keeps the market in the opening resistance zone. Price action within this zone (yellow trend) will guide the next move.
Plan of Action:
Observe price behavior for 30 minutes. If the index breaks below 51,800, initiate shorts targeting 51,418 with a stop loss at 52,000.
If the index breaks above 52,068, initiate longs with targets at 52,381 and stop loss below 51,902.
Key Tips: For flat openings, straddle or strangle strategies can help capture significant moves in either direction.
Gap-Down Opening (200+ points below 51,902):
A gap-down below 51,418 enters the green support/consolidation zone. Watch for potential reversals or breakdowns near 51,092 or the Wave B lower band at 50,664.
Plan of Action:
If Bank Nifty reverses from 51,092, initiate long trades with targets at 51,418, maintaining a stop loss at 50,900.
A breakdown below 51,092 confirms bearish momentum. Short positions can target 50,664, with stop loss above 51,200.
Key Tips: For aggressive trades in this scenario, consider deep OTM puts for higher returns.
Risk Management Tips for Options Trading:
Avoid over-leveraging; allocate no more than 2-3% of capital per trade.
Use hourly candle close as confirmation for entries and exits.
Hedge positions using spreads to limit losses.
Exit trades promptly if they don’t perform as expected within the first 30 minutes.
Summary and Conclusion:
Today's trading plan focuses on key levels derived from technical analysis. The yellow trend indicates likely consolidation, the green trend suggests bullish opportunities, and the red trend signals potential bearish moves. Adherence to price action at critical levels will be crucial for maximizing profits and minimizing risks. Always ensure disciplined execution and maintain a balanced approach.
Disclaimer:
I am not a SEBI-registered analyst. This analysis is for educational purposes only. Please consult with your financial advisor before making any investment decisions.

BANKNIFTY : Levels, prediction and Plan for 19-Dec-2024Intro: Previous Day's Plan vs Actual
In yesterday's trading plan, BankNifty tested the Wave C Support Zone near 51,903 - 52,068 as highlighted in yesterday's trading plan, showing indecision within the sideways range (Yellow Trend). As expected, the index respected the completion zone for Wave C and stayed above the support area for most of the session. However, no clear breakout or breakdown occurred.
Now, for 19-Dec-2024, we will plan for three potential opening scenarios: Gap Up, Flat, and Gap Down, considering a gap opening of 200+ points. The key levels and actionable strategies are explained below.
Trading Scenarios for 19-Dec-2024
Gap Up Opening (200+ points):
If Bank Nifty opens above the Resistance for Sideways Trade at 52,647, it indicates bullish sentiment.
- Monitor the first 30 minutes for a sustained breakout above this level. If the price holds above 52,647, the next target will be the Last Intraday Resistance at 53,039.
- However, failure to sustain above 52,647 may lead to a retracement back to the Opening Resistance at 52,381.
- Action Plan:
- Initiate long positions only if an hourly candle closes above **52,647**, with targets at **53,039**.
- If price fails to sustain and shows weakness, wait for retracement back to **52,381** for possible re-entry opportunities.
Flat Opening:
If Bank Nifty opens near the Opening Resistance at 52,381, it signals indecision, and price may move sideways (Yellow Trend) before providing direction.
- A breakout above 52,381 can trigger a move toward the Resistance for Sideways Trade (52,647), while a breakdown below 52,205 (previous close) could drag prices back toward the Wave C Completion Zone at 52,068 - 51,903.
- Action Plan:
- Avoid trading immediately after the open. Let price break above **52,381** for bullish trades, targeting **52,647**.
- A breakdown below **52,205** could signal short opportunities with targets at **52,068** and **51,903**.
- Manage risk by placing stops based on an hourly candle close above/below these levels.
Gap Down Opening (200+ points):
If Bank Nifty opens near or below the Wave C Completion Zone (52,068 - 51,903), it signals bearish momentum.
- Look for signs of support formation in this zone, as prices could take a reversal from here (Green Trend).
- Failure to hold 51,903 could lead to further downside towards the critical support at 51,418 (red trend).
- Action Plan:
- Look for long opportunities if Bank Nifty holds above **51,903** with confirmation (hourly close), targeting a bounce back to **52,205** and then **52,381**.
- If price decisively breaks below **51,903**, consider short trades toward **51,418**, with a strict stop loss above **52,068**.
Risk Management Tips for Options Traders :
Use spreads like Bull Call Spreads for bullish moves or Bear Put Spreads for downside moves to limit risks in volatile openings.
Avoid trading during the first 15-30 minutes if opening is erratic or near key levels like the Wave C zone. Let the price stabilize.
Always place stop losses on an hourly candle close basis for better risk management.
Avoid over-leveraging; focus on maintaining a favorable risk-reward ratio (minimum 1:2).
Summary and Conclusion:
Bank Nifty remains at a crucial juncture near the Wave C Completion Zone.
Key Levels to Watch:
Upside: 52,381, 52,647, 53,039
Downside: 52,205, 52,068, 51,903, and 51,418
Yellow Trend reflects sideways price action, Green Trend signals bullish reversals, and Red Trend highlights bearish continuation.
Focus on price action near key levels, and avoid trading in uncertain zones.
Disclaimer: I am not a SEBI-registered analyst. This trading plan is for educational purposes only. Traders should conduct their analysis or consult a financial advisor before making decisions.

BANKNIFTY : Trading levels and plan for 18-Dec-2024Trading Plan for Bank Nifty – 18th December 2024
The chart for 17th December 2024 outlined key levels like the **Golden Retracement Zone (₹52,581 - ₹52,998)**, deep retracement at ₹51,868-₹52,074, and potential resistance levels like ₹53,225 and ₹53,519. The plan predicted consolidation within the golden zone and a potential breakout. On 17th December, Bank Nifty respected the yellow highlighted zone (sideways trend) but showed weakness at intraday resistance. Buyers failed to take control, indicating the market might revisit lower retracement zones.
Now, let's discuss the detailed trading plan for 18th December based on potential opening scenarios.
---
Trading Plan for 18th December 2024
Key Levels for the Day:
Support Zone: ₹52,581 - ₹52,789 (Golden Retracement Zone)
Resistance Levels: ₹53,225 (Intraday Resistance), ₹53,519 (Resistance for New Highs)
Deep Retracement Zone: ₹52,074 - ₹51,868 (113%-127% Fibonacci)
Yellow Trend indicates sideways consolidation, Green Trend shows bullish movements, and Red Trend highlights bearish trends.
---
1. Gap-Up Opening (+200 Points or More Above ₹52,998)
- If Bank Nifty opens above ₹52,998, it enters the upper band of the **Golden Retracement Zone**.
- Immediate focus will be on **₹53,225** (Intraday Resistance).
- A bullish breakout above ₹53,225 may lead to a quick move toward **₹53,519** (Resistance for New Highs).
Plan of Action:
Look for bullish price action confirmation (green candles, strong volumes) near ₹52,998-₹53,225.
Place a buy trade above ₹53,225 for targets of ₹53,519, with a stop loss at ₹52,900.
If resistance at ₹53,225 holds and bearish candles appear, plan short trades below ₹53,000 targeting ₹52,789-₹52,581 (lower retracement zone).
Tips: Avoid chasing trades during the first 15 minutes; wait for clear price action confirmation around resistance zones.
---
2. Flat Opening (Near ₹52,789 - ₹52,998)
- A flat opening within the **Golden Retracement Zone** suggests potential sideways consolidation.
- Buyers will likely attempt to defend the zone between ₹52,789-₹52,581.
Plan of Action:
Observe price behavior within the range. If support holds above ₹52,789, consider a buy trade above ₹52,998 with targets at ₹53,225 and ₹53,519.
If price breaks below ₹52,581, shift focus to the **Deep Retracement Zone (₹52,074-₹51,868)**. Plan a short trade targeting ₹52,074 with a stop loss at ₹52,800.
Tips: For options traders, use **strangle or straddle strategies** to capture sideways volatility if price stays within the golden retracement range.
---
3. Gap-Down Opening (-200 Points or Below ₹52,581)
- A gap-down opening below ₹52,581 will indicate bearish pressure.
- Price is likely to test the **Deep Retracement Zone (₹52,074 - ₹51,868)**, a potential reversal area for Wave C.
Plan of Action:
Wait for price to enter the deep retracement zone. Look for bullish reversal patterns (e.g., hammer, bullish engulfing) near ₹52,074-₹51,868 before initiating a buy trade targeting ₹52,581 .
If price fails to hold ₹51,868, plan short trades targeting ₹51,500 with a stop loss at ₹52,200.
For aggressive traders, sell on breakdowns below ₹52,581 for quick intraday moves toward the deep retracement zone.
Tips: In case of a gap-down, avoid panic trades. Wait for price to stabilize and confirm levels before entering positions.
---
Risk Management Tips for Options Trading:
Avoid over-leveraging; allocate no more than 2% of capital per trade.
Use hedging strategies like bull call spreads or bear put spreads to limit risks during volatile sessions.
Always place stop-loss orders for both futures and options trades.
Avoid trading options with low liquidity to minimize slippage.
---
Summary and Conclusion:
- For 18th December 2024, the **Golden Retracement Zone (₹52,789 - ₹52,998)** is the key area to watch. A breakout above ₹53,225 can trigger a bullish rally, while a breakdown below ₹52,581 may lead to further bearishness toward the deep retracement zone.
- Sideways consolidation is expected if the price remains within the golden retracement range.
- Focus on price action signals and risk management to navigate the session effectively.
Disclaimer: I am not a SEBI-registered analyst. The views expressed here are for educational purposes only. Please consult your financial advisor before making trading decisions.

BANKNIFTY : Trading Levels and Plan for 17-Dec-2024🔹 Previous Day's Plan vs Actual (16-Dec-2024):
In yesterday's trading plan, we identified the No Trade Zone / Liquidity Zone near 53,395-53,705, expecting consolidation in this range. We also highlighted the Opening Support/Resistance Zone at 53,277-53,233 as a critical area to observe.
As seen in today's chart, Bank Nifty respected the No Trade Zone before showing rejection at higher levels. The price tested the Opening Support Zone and bounced back but failed to sustain above key resistance. This reflects sideways movement (Yellow Trend) and minor bearish pressure in the later part of the session.
Today's plan will analyze three key opening scenarios for 17-Dec-2024 and guide traders with actionable steps. We will also focus on risk management strategies for options traders.
🔹 Bank Nifty Trading Plan for 17-Dec-2024:
Scenario 1: Gap Up Opening (200+ points)
If Bank Nifty opens above the No Trade Zone (53,705) and sustains, we could see bullish momentum. The next key resistance is the Profit Booking Zone at 54,233-54,472, which coincides with a potential new high.
🔹 Plan of Action:
Observe price action for the first 15-30 minutes.
If prices sustain above 53,705 on an hourly candle close , initiate long positions with a target of 54,233 and an extended target of 54,472.
Place a stop loss below 53,705 to protect against reversal.
🔹 Bullish Confirmation:
Sustaining above 53,705.
Aggressive moves can be expected if volumes increase near this level.
🔹 Key Target Levels:
First Target: 54,233.
Extended Target: 54,472.
🔹 Risk Management Tip:
Avoid chasing a gap-up rally; wait for a pullback near support zones before entering trades. Options traders can buy slightly ITM CE to mitigate time decay.
Scenario 2: Flat Opening (Near 53,490)
If Bank Nifty opens flat, focus on the No Trade Zone between 53,395-53,705. This zone is likely to show sideways movement (Yellow Trend) unless a breakout or breakdown occurs.
🔹 Plan of Action:
Avoid initiating trades inside the No Trade Zone as price could face rejection.
A breakout above 53,705 will trigger bullish momentum (Green Trend).
A breakdown below 53,395 will open doors for bearish movement (Red Trend).
🔹 Trade Setups:
Long Position: Above 53,705, targeting 54,233.
Short Position: Below 53,395, targeting 53,277 and 53,002.
🔹 Risk Management Tip:
Use tight stop losses near breakout/breakdown points. For options traders, wait for hourly candle confirmations to avoid false signals.
Scenario 3: Gap Down Opening (200+ points)
If Bank Nifty opens below 53,277 (Opening Support/Resistance Zone), bearish pressure may intensify. The Last Support for Intraday at 53,002 will be the crucial level to watch. If this support fails, expect a sharp fall toward 52,577.
🔹 Plan of Action:
If prices open near 53,277, observe price behavior for the first 15-30 minutes.
If the level fails to hold, initiate short positions with a target of 53,002 and an extended target of 52,577.
If Bank Nifty shows a bounce from 53,277, look for reversal opportunities toward 53,490.
🔹 Bearish Confirmation:
Sustaining below 53,277 with strong bearish candles.
Volumes increasing near the support breakdown will signal further downside.
🔹 Key Target Levels:
First Target: 53,002.
Extended Target: 52,577.
🔹 Risk Management Tip:
For options traders, buy slightly OTM PE with defined stop loss above resistance. Avoid holding short positions overnight in case of volatility.
🔹 Risk Management Tips for Options Traders:
Avoid taking positions during the first 15 minutes to avoid false breakouts.
Use slightly ITM options to reduce time decay impact.
Focus on hourly candle closes for confirmation of breakouts or breakdowns.
Always have a stop loss in place to protect against sudden reversals.
Trade with smaller position sizes when market volatility is high.
🔹 Summary & Conclusion:
A Gap Up Opening above 53,705 can lead to bullish continuation toward 54,233-54,472.
A Flat Opening inside the No Trade Zone requires caution. Look for a breakout above 53,705 or breakdown below 53,395 for direction.
A Gap Down Opening below 53,277 can trigger bearish moves toward 53,002 and 52,577.
Yellow Trend represents sideways consolidation, Green Trend signals bullish moves, and Red Trend indicates bearish momentum.
🔹 Disclaimer:
I am not a SEBI-registered analyst. This analysis is for educational purposes only. Traders are advised to conduct their own analysis or consult with a financial advisor before making trading decisions.

BankNifty Intraday Trade Setup | 16th DecOn Friday, BankNifty gave big moves. In morning we saw breakdown and BankNifty made a low around 52260 but we saw strong reversal from lower levels and BankNifty made a high at 53654 which is approx 1400 points rally from day low.
Tomorrow, buy BankNifty if sustains above 53700 for the targets of 53850 and above marked level. On the other side, if BankNifty sustains below 53480 on the downside, sell BankNifty for the targets of 53320 and below marked level on the chart.
Expectations: Volatile day.
Intraday Levels:
Buy Above - 53700
Sell Below - 53480
To motivate us, Please like the idea If you agree with the analysis.
Happy Trading!
InvestPro India Team

The Bank Nifty Intraday trend forecast for December 17, 2024The trend looks bullish tomorrow for the Bank Nifty as well. 54590 looks like a strong resistance for the Bank Nifty spot. The levels provided in the chart may vary based on the gaps on the either side. The content is only for the educational purposes.

BANKNIFTY : Trading plan and levels for 16-Dec-2024Intro: Review of Previous Day’s Plan
Yesterday’s chart depicted key levels for supply, resistance, and demand zones. The anticipated plan highlighted a sideways consolidation around the "Last Resistance for ATM" zone, followed by a bullish breakout near 53,700. As per the actual market movement, Bank Nifty tested the resistance at 53,700 but failed to sustain momentum, leading to a pullback towards the Opening Support Zone. This reaffirms the importance of respecting identified zones and acting on confirmation signals.
Color Coding in the Chart:
Yellow: Sideways trend
Green: Bullish trend
Red: Bearish trend
Trading Plan for 16th December 2024
If Gap Up Opening (200+ points above previous close)
A gap-up scenario would place Bank Nifty near the upper resistance zone (54,092 to 54,322). In such cases:
Action Plan: Wait for the first 15-30 minutes to observe price stability. If an hourly candle closes above 54,322, initiate a long position with a target of 54,787 (supply zone).
If prices show rejection from 54,322, expect a retracement towards the Opening Support Zone (53,700 to 53,540).
Avoid chasing the gap-up blindly; confirm the breakout or reversal with volume and price action.
If Flat Opening
A flat opening would likely position Bank Nifty around the Opening Support/Resistance Zone (53,700 to 53,540).
Action Plan: Monitor price action within this zone. A strong breakout above 53,700 can lead to bullish momentum, targeting 54,092 first and then 54,322.
On the flip side, if Bank Nifty breaks below 53,540, a bearish trend may develop, pulling prices toward the Opening Support at 53,398 and potentially the Last Support for Intraday at 53,074.
Be cautious and use tight stop losses, especially if volatility is high.
If Gap Down Opening (200+ points below previous close)
A gap-down opening may test the Last Support for Intraday (53,074).
Action Plan: If Bank Nifty holds above 53,074, consider entering a long position with a target of 53,540 and 53,700. Look for bullish reversal candles at this level.
If prices break below 53,074, a bearish trend could extend toward 52,700 and further to the Mitigated Demand Zone (52,484 to 52,311). Avoid entering counter-trend trades unless clear reversal signs are observed.
Risk-averse traders should wait for price action confirmation to avoid false breakouts.
Tips for Risk Management in Options Trading:
Use defined stop losses to protect your capital, particularly on hourly candle closures beyond invalidation zones.
Avoid over-leveraging and position your trades based on your risk tolerance. As a guideline, limit exposure to 2-3% of your total capital per trade.
Focus on ATM or slightly ITM strike prices with adequate liquidity for intraday trades. Avoid OTM options during volatile conditions.
Implement a time-based exit if the trade does not hit the target within a predefined period.
Summary and Conclusion:
Bank Nifty’s price movement today will likely hinge on the interaction with key zones like 53,700 (Opening Resistance) and 53,074 (Last Intraday Support). Use the first 30 minutes post-opening to observe stability, and act based on breakouts or reversals. Follow a disciplined approach and avoid emotional trading.
Disclaimer: I am not a SEBI-registered analyst. The above plan is for educational purposes only. Please consult with your financial advisor before making any trading decisions.

BANKNIFTY : Trading Levels and Plan for 12-Dec-2024Bank Nifty Trading Plan for 12-Dec-2024
Intro: Plan vs Actual for 11-Dec-2024
Yesterday, our plan identified key zones for Bank Nifty, including the "Liquidity Zone" and the "Buyer’s Entry Zone." Bank Nifty opened near the projected "Opening Support/Resistance Zone" at 53,398 and consolidated around the "Liquidity Zone" before attempting a breakout towards the resistance at 54,034. The market respected the identified levels, providing opportunities for both scalpers and swing traders. However, the upward movement lacked strong momentum beyond 54,034, leading to a sideways close near 53,392.
Trading Plan for 12-Dec-2024
Gap Up Opening (200+ Points):
If Bank Nifty opens significantly above 53,600:
- Immediate focus will be on the "Liquidity/NO Trade Zone" at 53,699. Wait for the first 15-minute candle to confirm strength.
- A sustained move above 53,699 can lead to a test of the "First Resistance Zone" at 54,034-54,479. Consider initiating long positions only after an hourly close above 54,034 with targets towards 54,479.
- If rejection occurs near 54,034, intraday shorts can be explored with targets back to 53,699, keeping stop-loss above 54,100.
- Risk Tip: Use deep out-of-the-money (OTM) options for breakout trades to reduce premium risk.
Flat Opening:
If Bank Nifty opens near 53,398:
- This level serves as "Opening Support/Resistance Zone." Expect range-bound movement initially.
- A breakout above 53,699 will signal bullish momentum, with targets of 54,034 and 54,479. Initiate long trades above 53,699, keeping a strict stop-loss below 53,398.
- A breakdown below 53,398 could lead to a test of 53,069, which is the "Buyer’s Support Zone for Consolidation." Watch for reversal patterns here to re-enter longs.
- Risk Tip: Avoid aggressive positions during sideways trends (Yellow zones).
Gap Down Opening (200+ Points):
If Bank Nifty opens below 53,200:
- Monitor the "Buyer’s Try Zone" at 52,968-53,069. This is a critical demand zone; a strong reversal here can provide long opportunities with a target back towards 53,398.
- If this zone fails to hold, expect a sharper decline towards the "Must Try Zone for Buyers" at 52,531-52,650. Wait for a bullish reversal signal before initiating trades.
- For intraday shorts, look for breakdown confirmation below 52,968 with a target towards 52,531.
- Risk Tip: Deploy hedged positions like straddles/strangles during volatile gap-down openings.
Tips for Risk Management in Options Trading:
Always trade with defined stop-loss levels. For options, set a premium stop-loss (e.g., 30-50%).
Avoid overleveraging. Position size should not exceed 2-3% of your trading capital.
Monitor IV (Implied Volatility) spikes, especially during news-heavy sessions.
Use spreads to minimize premium decay in sideways markets.
Summary and Conclusion:
- Bank Nifty is at a critical juncture with a potential for high volatility. Key levels to watch are 54,034 on the upside and 52,968 on the downside.
- Follow the plan with discipline and respect stop-loss levels.
Disclaimer:
I am not a SEBI-registered analyst. This plan is for educational purposes only. Please consult your financial advisor before making any trading decisions.

Banknifty technical analysis for today (11/Dec/2024)Bank Nifty moments for option and future trading 11/Dec/2024
follow us for more updates information.
message us for any stocks related information

BANKNIFTY : Trading plan and Levels for 11-Dec-2024Previous Day's Chart Pattern Analysis:
The chart for 10-Dec-2024 shows significant price movement with clear areas of interest. The market showed a liquidity sweep near the 53,069 zone , followed by consolidation. A CHoCH (Change of Character) around 53,398 indicated a shift in trend. The resistance near 54,034 remains crucial, and breaking this could lead to a bullish rally toward new highs. The yellow trend represents sideways movement, the green trend shows bullish momentum, and the red trend indicates bearish possibilities.
Trading Plan for 11-Dec-2024:
Scenario 1: Gap Up Opening (200+ points above the previous close):
If Bank Nifty opens around 53,957 or above , the first resistance zone at 54,034 becomes crucial. Wait for price action near this level.
Plan of Action:
If it breaks and sustains above 54,034 , initiate a long position with a target of 54,479 . Place a stop loss just below 53,957 .
If there’s a rejection at 54,034 , look for short opportunities targeting 53,699 (Opening Support).
Avoid aggressive entries in the first 15 minutes to allow volatility to settle.
]
Scenario 2: Flat Opening (Within 50 points of the previous close):
If Bank Nifty opens near 53,604 , the Liquidity / NO Trade Zone (between 53,699 and 53,398) becomes the focus.
Plan of Action:
If the price stays within this range, avoid trades and wait for a breakout.
On a breakout above 53,699 , go long with a target of 54,034 . Keep a stop loss below 53,550 .
If it breaks below 53,398 , short the market targeting the Buyer's Support Zone near 53,069 .
Use small lot sizes to manage risk until a clear trend emerges.
Scenario 3: Gap Down Opening (200+ points below the previous close):
A gap down opening near 53,069 or lower will test the buyer’s strength.
Plan of Action:
If the price takes support near 53,069 , look for bullish reversal patterns and initiate a long position with a target of 53,398 . Keep a stop loss below 52,968 .
If it breaks below 52,968 , further downside to the Must Try Zone for Buyers at 52,650 is possible. Watch for reversals here to take long positions.
Avoid chasing the trend blindly in the first hour; let the market stabilize before entry.
Risk Management Tips for Options Trading:
Always calculate your risk before entering a trade. Limit risk to 1-2% of your total capital per trade.
For gap openings, avoid buying options immediately due to high premiums; wait for IV (implied volatility) to cool down.
Use spreads (e.g., Bull Call Spreads or Bear Put Spreads) to minimize risk.
Avoid overtrading and stick to predefined levels.
Summary and Conclusion:
For 11-Dec-2024, focus on key levels: 54,034 (Resistance), 53,699 (Support/Resistance), and 53,069 (Major Support). React based on price action and avoid impulsive decisions. The yellow zones suggest consolidation, green zones show bullish potential, and red zones indicate bearish sentiment. Maintain strict risk management and use options wisely.
Disclaimer: I am not a SEBI-registered analyst. The above analysis is for educational purposes only. Please consult your financial advisor before making any trading decisions.

BankNifty Intraday Trade Setup | 9th DecFriday due to RBI policy BankNifty was highly volatile in the first hour, we took 53500 PE around 690 which made a high above 940 and gave good profit.
For tomorrow, buy BankNifty if sustains above 53630 for the targets of 53800 and 53950. On the other side sell BankNifty if sustains below 53370 for the targets of 53200 and lower marked level on the chart.
Expectations: Volatile day.
Intraday Levels:
Buy Above - 53630
Sell Below - 53370
To motivate us, Please like the idea If you agree with the analysis.
Happy Trading!
InvestPro India Team

BANKNIFTY : Trading Plan and Levels for 09-Dec-2024 Bank Nifty Trading Plan for 09-Dec-2024
Previous Day's Chart Pattern:
On 08-Dec-2024, Bank Nifty exhibited a consolidation pattern and forming a No Trade Zone , with price movement oscillating between 53,487 and 53,699. Buyers displayed confidence at the golden retracement zone but faced resistance near 54,258. The yellow zone marked a sideways trend, while green indicated bullish attempts that were capped by red bearish resistance levels. This sets the stage for multiple potential scenarios tomorrow.
Trading Plan for 09-Dec-2024:
Gap-Up Opening (+200 points or more above 53,699):
If Bank Nifty opens above 53,699 and sustains, the index is likely to test the first resistance at 54,258 . Watch for price action at this level:
If it breaks above 54,258, the next target will be 54,479 (potential new all-time high resistance). Consider initiating long positions near 54,258 with a stop loss just below 54,185.
However, if rejection occurs at 54,258, expect a pullback toward 53,699 . In this case, avoid aggressive longs and wait for confirmation before re-entering trades.
Risk Management Tip: For options buyers, focus on ATM or slightly OTM contracts with small quantities. If price approaches resistance zones, consider booking partial profits.
Flat Opening (Within the No Trade Zone 53,487–53,699):
In the case of a flat open, patience is key:
If price sustains above 53,699 , this will indicate bullish intent, targeting 54,258 . Go long after a clear breakout with stop loss near 53,487.
Conversely, if the index drops below 53,487, it may retest the key support zone at 53,017 . Initiate short trades cautiously with tight stop loss above 53,487.
Risk Management Tip: Avoid over-leveraging in a choppy zone. Wait for the first 30 minutes to gauge market sentiment.
Gap-Down Opening (-200 points or more below 53,487):
If Bank Nifty gaps down below 53,487:
Initial support lies at 53,017 . If this zone holds, we may see a reversal toward the No Trade Zone. Watch for bullish candlestick patterns to confirm a rebound.
If 53,017 breaks, the next key level is 52,715 (deep retracement and must-try support for buyers). Consider shorts below 53,017 with a target near 52,715, keeping a stop loss at 53,200.
Risk Management Tip: For bearish scenarios, buy puts cautiously. Avoid illiquid contracts and use spreads to limit risk.
Summary and Conclusion:
The market remains at a pivotal zone, with clear levels to monitor for breakouts or breakdowns.
Yellow zones highlight areas of consolidation, green zones indicate bullish trends, and red zones point to bearish resistance.
Adhere strictly to the No Trade Zone boundaries to avoid unnecessary risks.
Disclaimer: This analysis is for educational purposes only. I am not a SEBI-registered analyst. Traders are advised to do their own research or consult a financial advisor before trading.

The Bank Nifty intraday trend forecast on December 09, 2024As per my study, on December 09, 2024, the Bank Nifty intraday trend may begin with Gap up opening and move sideways to bullish for the remaining day.
This information is only for the educational purposes.

BankNifty Rockets: 1800+ Points Secured with Precision!BANKNIFTY on the 15-minute timeframe demonstrated a powerful bullish trend, delivering a substantial profit of 1800+ points. This long trade setup was flawlessly executed using the Risological Swing Trading Indicator , which accurately identified the entry point, targets, and stop-loss levels.
BankNifty Key Levels:
TP1: 52198.70 ✅
TP2: 52510.65 ✅
TP3: 52822.60 ✅
TP4: 53015.35 ✅
BankNiftyTechnical Analysis:
The trade was initiated at an entry level of 52005.90, with a well-placed stop-loss at 51849.95 to manage risk effectively.
The price action confirmed a strong upward momentum, crossing over the Risological trend line, which signaled a clear long entry.
All targets were achieved in quick succession, reflecting the precision and reliability of the Risological system.
This trade stands out as a prime example of capturing massive intraday moves with high accuracy.
NAMASTE!

Banknifty technical analysis for tomorrow (06/Dec/2024)Bank Nifty moments for option and future trading 06/Dec/2024
follow us for more updates information.
message us for any stocks related information

BANKNIFTY : Trading Plan for 06-Dec-2024Trading Plan for Bank Nifty – 06-Dec-2024
Intro to the Previous Day's Chart Pattern:
On 05-Dec-2024, Bank Nifty displayed a remarkable journey, testing critical levels and forming significant zones.
Profit Booking Zone (₹54,472–₹54,787): Wave C extended zone acted as a stiff resistance.
No-Trade Zone (₹53,396–₹53,702): Represented indecision near Wave C completion, where the trend remained unclear ( Yellow Trend ).
Opening Support Zone (₹53,067): Held well to initiate bullish recoveries ( Green Trend ).
Deep Retracement Zone (₹52,400–₹52,600): Marked by Fibonacci levels (113%-127%), offering a strong demand area ( Green Trend ).
The day concluded with a consolidation between critical zones, setting the stage for decisive moves on 06-Dec-2024.
Trading Plan for 06-Dec-2024
Gap Up Opening (+200 Points):
If Bank Nifty opens near or above ₹54,000 , expect resistance at the Profit Booking Zone (₹54,472–₹54,787) .
Action Plan:
Watch for rejection or bearish patterns near ₹54,472 . Short positions can be initiated with targets of ₹54,000 and ₹53,702 .
Sustained breakout above ₹54,787 with strong volumes signals continuation of the bullish rally. Long trades can target ₹55,200 and ₹55,450 .
Risk Management Tip:
Use tight stop-loss for short trades above ₹54,787 . In options, consider selling OTM calls above ₹55,000 for time decay advantages.
Flat Opening (Near ₹53,600):
A flat opening near the No-Trade Zone (₹53,396–₹53,702) demands caution.
Action Plan:
If Bank Nifty sustains above ₹53,702 , initiate long positions targeting ₹54,472 .
Below ₹53,396 , expect a dip toward the Opening Support Zone (₹53,067) . Look for buying opportunities with bullish signals at this level.
Risk Management Tip:
Avoid aggressive trades in the No-Trade Zone. Wait for a clear breakout or breakdown before entering trades. For options, use spreads like bull call spreads to minimize risks.
Gap Down Opening (-200 Points):
A gap-down opening near ₹53,067 or below will test critical supports.
Action Plan:
If Bank Nifty stabilizes above ₹53,067 , expect a recovery toward ₹53,396 . Long trades can be initiated with proper risk-reward setups.
Failure to hold ₹53,067 opens the door to the Deep Retracement Zone (₹52,400–₹52,600) , where buying opportunities may arise for targets of ₹53,067 and ₹53,396 .
Risk Management Tip:
For high volatility scenarios, trade lighter positions. Use option strategies like straddles or strangles to capitalize on premium spikes.
Summary and Conclusion:
Resistance Levels: ₹54,472, ₹54,787
Support Levels: ₹53,702, ₹53,067, ₹52,400
Key Levels to Watch: Rejection at ₹54,472 or breakdown below ₹53,067 will determine intraday momentum.
Follow the trends: Yellow (Sideways), Green (Bullish), Red (Bearish) .
Tips for Options Trading:
Use proper hedging strategies like spreads to limit losses.
Avoid over-leveraging in volatile conditions.
Disclaimer:
The above analysis is for educational purposes only . I am not a SEBI-registered analyst. Please perform your research or consult a financial advisor before trading. Market risks are significant; trade responsibly.

Banknifty technical analysis for tomorrow (05/Dec/2024)Nifty moments for option and future trading 05/Dec/2024
follow us for more updates information.
message us for any stocks related information

BANKNIFTY : Trading levels and Plan for 05-Dec-2024Trading Plan for Bank Nifty – 05-Dec-2024
Intro: Previous Day's Chart Pattern
On 04-Dec-2024, after mitigating the supply zone at deep retracement zone from the last swing high, showed initial resistance near important resistance zone. by mitigating supplies Banknifty is forming a strong support zone near ₹53,051. The index respected the deep retracement zone and closed near ₹53,236, indicating the potential for bullish continuation. The Yellow trend suggests consolidation, the Green trend indicates a bullish trajectory, and the Red trend points to bearish movements.
Plan for Different Opening Scenarios:
1. Gap-Up Opening (Above ₹53,465 by 200+ points)
If Bank Nifty opens significantly higher, crossing ₹53,702:
Immediate Resistance: Watch for ₹54,472, which acts as the final intraday resistance. Prices sustaining above this level could lead to a breakout towards ₹54,600 or higher in coming sessions.
Action Plan: Allow prices to settle for the first 15–30 minutes. Look for pullbacks near ₹53,702 for entry opportunities, with a stop loss placed below ₹53,465. Target the next resistance zones at ₹54,472 and ₹54,600.
Risk Management: If prices fail to sustain above ₹53,702 and show strong selling pressure, avoid initiating long positions. Reassess the trend near ₹53,394.
2. Flat Opening (Within ₹53,051 to ₹53,394)
If Bank Nifty opens flat, between yesterday’s closing range:
Key Support and Resistance: ₹53,051 will act as strong support, while ₹53,394 is the immediate resistance.
Action Plan: Wait for a breakout from this range.
If prices sustain above ₹53,394, initiate long positions for targets of ₹53,702 and ₹54,472. Place the stop loss below ₹53,236.
If prices break below ₹53,051, consider short positions targeting ₹52,893 and ₹52,533. Stop loss above ₹53,236.
Risk Management: Avoid overleveraging as the consolidation phase might lead to false breakouts. Confirm the trend before entering trades.
3. Gap-Down Opening (Below ₹52,893 by 200+ points)
If Bank Nifty opens below key support levels:
Critical Levels: ₹52,533 becomes a significant support zone. Failing this zone can trigger further selling pressure towards ₹52,200.
Action Plan:
Observe the opening 15–30 minutes for price stability.
If prices rebound from ₹52,533, look for buying opportunities targeting ₹52,893 and ₹53,051. Place a stop loss below ₹52,400.
If prices sustain below ₹52,533, initiate shorts for targets of ₹52,200 and ₹51,900. Stop loss above ₹52,893.
Risk Management: Protect capital by reducing position size in high volatility conditions. Prioritize defined stop-loss levels to minimize losses.
Tips for Risk Management in Options Trading:
Position Sizing: Trade with a smaller position size in volatile conditions to avoid large losses.
Premium Decay Awareness: Avoid holding options positions close to expiry unless they are deeply in-the-money.
Avoid Averaging Down: Do not add to losing positions, especially in options, as losses can multiply quickly.
Hedge Positions: Consider strategies like spreads or buying protective puts to reduce risk exposure.
Summary and Conclusion:
Bank Nifty’s price action on 04-Dec-2024 hints at a bullish structure, with strong support near ₹53,051 and resistance levels clearly defined. For 05-Dec-2024, focus on identifying the trend post-opening and trade cautiously, especially in gap-up or gap-down scenarios. Use stop losses diligently and prioritize risk management to navigate the intraday volatility.
Disclaimer:
I am not a SEBI-registered analyst. This analysis is for educational purposes only and should not be considered investment advice. Please consult your financial advisor before making any trading decisions.

BANKNIFTY : Trading levels and Plan for 04-Dec-2024Bank Nifty Trading Plan for 04-Dec-2024 📈
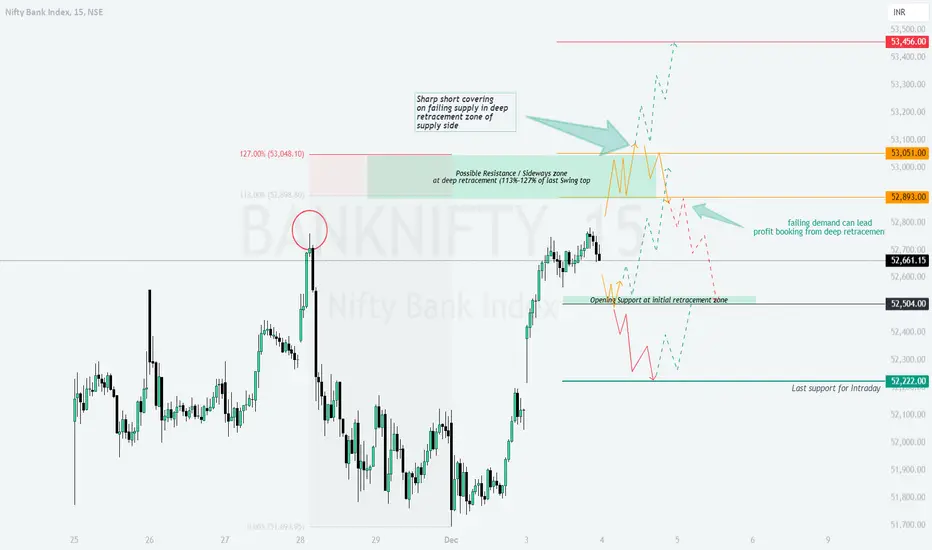
On the previous trading day, Bank Nifty experienced sharp upward move after opening and close with in a range ( mentioned in yesterday's plan), particularly in the deep retracement zone between 113%-127% of the last swing high, highlighting a potential exhaustion of sellers. The price action near ₹52,893 indicates failing demand, which may lead to profit booking. The levels around ₹53,051 act as a probable resistance zone, while initial support lies near ₹52,504. Yellow indicates a sideways trend, green shows bullish momentum, and red signifies bearish trends.
Here’s a structured trading plan for all opening scenarios:
Gap Up Opening (+200 points or more above ₹52,661)
Resistance Zone Focus (₹52,893-₹53,051): A gap-up opening near or above ₹52,893 will push the index into a potential resistance zone. Watch for rejection patterns, such as bearish engulfing, to confirm profit booking.
Action Plan:
Entry: Short near ₹53,051 after a bearish confirmation.
Target: ₹52,661 (current price level) and ₹52,504 (initial retracement zone).
Stop Loss: Above ₹53,150 to manage risk.
Breakout Potential Above ₹53,051: Sustained buying above ₹53,051 could lead to further upside toward ₹53,456.
Action Plan:
Entry: Long above ₹53,051 after a 15-minute candle closes above this level.
Target: ₹53,300-₹53,456.
Stop Loss: Below ₹52,893 to avoid false breakouts.
Flat Opening (Near ₹52,661)
Opening Support (₹52,504-₹52,661): If the market opens flat, initial focus should remain on whether Bank Nifty sustains above ₹52,504. A break below this level could trigger further downside.
Action Plan for Bullish Scenario:
Entry: Long above ₹52,661 with strong buying momentum.
Target: ₹52,893 and ₹53,051.
Stop Loss: Below ₹52,500 to limit downside risk.
Action Plan for Bearish Scenario:
Entry: Short below ₹52,504 with selling pressure confirmation.
Target: ₹52,222 (last support for intraday).
Stop Loss: Above ₹52,661 for safety.
Retracement Levels Monitoring (₹52,504): If the price trades sideways near ₹52,504, look for breakout patterns in either direction to confirm the trend.
Gap Down Opening (-200 points or more below ₹52,661)
Testing Demand Zone (₹52,222): A gap-down opening below ₹52,504 will test the last intraday support zone around ₹52,222. Failure to hold this level could intensify the bearish momentum.
Action Plan:
Entry: Short below ₹52,222 after bearish confirmation.
Target: ₹52,000-₹51,800 (extended retracement zones).
Stop Loss: Above ₹52,350 to minimize risk.
Reversal Potential at ₹52,222: Watch for bullish reversal patterns like hammers or bullish engulfing candlesticks near ₹52,222.
Action Plan:
Entry: Long near ₹52,222 with a confirmed reversal.
Target: ₹52,504 and ₹52,661.
Stop Loss: Below ₹52,100 to manage risk.
Risk Management Tips for Options Trading
Adopt strict stop-loss discipline to avoid large losses, especially in volatile conditions.
Trade with limited risk strategies like iron condors or debit spreads to manage margin requirements.
Focus on option strikes with sufficient liquidity (At-The-Money or slightly Out-Of-The-Money options).
Avoid over-leveraging; trade only with capital you can afford to lose.
Use a defined reward-to-risk ratio (preferably 2:1 or higher).
Summary and Conclusion
The Bank Nifty is trading near crucial zones, with ₹52,893 as a key resistance area and ₹52,504 acting as the immediate support. A breach above ₹53,051 could lead to bullish momentum, while a fall below ₹52,222 would extend bearish trends. Stick to the plan, wait for confirmation, and execute with discipline.
Disclaimer:
I am not a SEBI-registered analyst. This analysis is for educational purposes only. Please consult your financial advisor or conduct your research before making any trading decisions.
BANKNIFTY : Trading Levels for 03-Dec-2024Bank Nifty Trading Plan for 03-Dec-2024
Previous Day’s Chart Pattern Analysis:
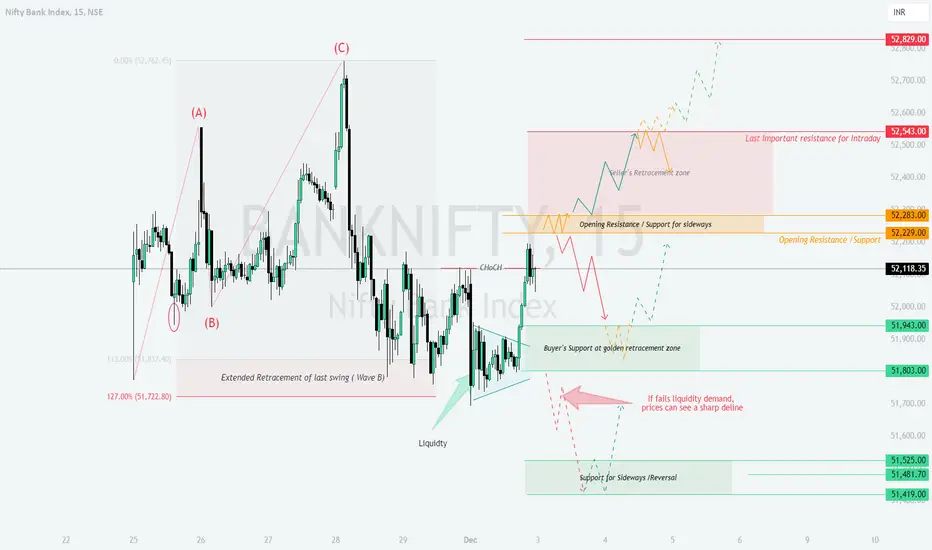
BANKNFITY has a strong strong form extended retracement zone of Wave B of last swing structure and managed to close near day's high after mitigating liquidity form the levels mentioned in yesterdays plan. The chart highlights a liquidity grab at lower levels, followed by a rally towards 52,229 Opening Resistance/Support Zone, indicating bullish intent. Yellow lines represent consolidation phases, green lines signal bullish trends, and red lines indicate bearish declines. The levels of 52,543 and 51,943 played a critical role in shaping the market sentiment.
For next session, expect dynamic movements around these levels based on opening scenarios.
Opening Scenarios for 03-Dec-2024:
Scenario 1: Gap Up Opening (200+ Points Above 52,118)
If Bank Nifty opens above 52,318, focus on the immediate resistance zone at 52,543 Seller's Retracement Zone.
- Action Plan:
- If the price sustains above 52,543, initiate long trades targeting the 52,829 Last Important Resistance for Intraday. Maintain a stop-loss at 52,283 Opening Resistance/Support Zone.
- Failure to sustain above 52,543 may lead to a pullback towards 52,283. Observe price action here before considering short trades targeting 52,229.
- Risk Management Tip: Avoid aggressive entries near the opening bell. Wait for a retest of key levels to confirm direction. Use call spreads for upside momentum.
Scenario 2: Flat Opening (Near 52,118)
In the case of a flat opening, monitor the 52,229 Opening Resistance/Support Zone for price action.
- Action Plan:
- If the price decisively breaks above 52,283, go long with targets of 52,543 and then 52,829. Place a stop-loss at 52,118.
- A failure to hold 52,229 could see the index retest 51,943 Buyer's Support at Golden Retracement Zone. Short positions can be considered with a target of 51,803, keeping a stop-loss at 52,283.
- Risk Management Tip: Wait for the first 30 minutes to let the trend stabilize. Use protective puts or hedged positions during flat openings.
Scenario 3: Gap Down Opening (200+ Points Below 52,118)
A gap-down opening below 51,943 would bring the 51,803 Support Zone into focus.
- Action Plan:
- If the price finds support at 51,803, expect a bounce towards 51,943. Go long with a stop-loss at 51,525 Support for Reversal.
- Breaching 51,803 might lead to sharp declines, targeting 51,525 and 51,419 Extended Retracement of Last Swing. Short positions can be initiated below 51,803 with tight stop-losses above 51,943.
- Risk Management Tip: Use out-of-the-money puts for bearish momentum. Avoid oversizing positions in volatile conditions.
Risk Management Tips for Options Trading:
Always define your risk before entering a trade. Risk no more than 1-2% of your capital on a single trade.
Use hedging strategies like bull call spreads or bear put spreads to limit potential losses.
During high volatility, prefer index options over individual stocks for better liquidity.
Summary and Conclusion:
Key levels to watch today are 52,543, 52,283, and 51,943.
Bullish scenario: Sustained movement above 52,543 could lead to targets of 52,829.
Bearish scenario: Breaking below 51,803 may trigger a slide towards 51,525.
Sideways scenario: Expect consolidation between 52,229 and 51,943, with trading opportunities emerging on breakouts or breakdowns.
Disclaimer:
I am not a SEBI-registered analyst. This trading plan is for educational purposes only. Please conduct your own analysis or consult a financial advisor before making any trading decisions.
Bank nifty technical analysis for trading (03/Dec/2024)Bank nifty moments for option and future trading 03/Dec/2024
follow us for more updates information.
message us for any stocks related information
