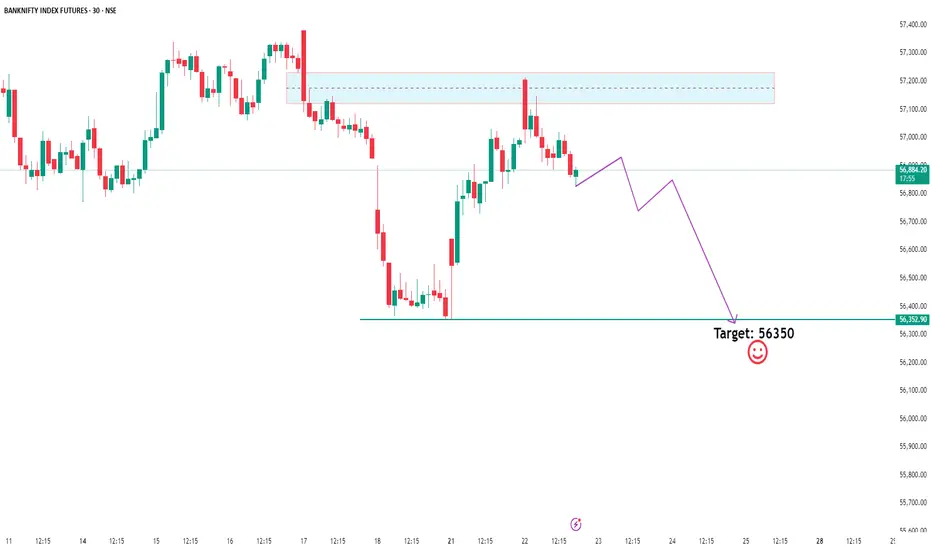
Bank Nifty Breakdown? Eyeing 56,350 –Time to Ride the Sell Wave!Bank Nifty is showing clear signs of distribution as Smart Money appears to be offloading positions near recent highs. Price has swept liquidity above the previous highs and is now rejecting key supply zones, confirming a potential sell-side shift in market structure.
With a break in internal structure and premium zones being respected, we're now watching the 56,350 level as a high-probability target for downside liquidity.
If you're trading with the Smart Money Concept in mind — this could be the move where retail gets trapped while institutions ride the wave down. Stay sharp and manage your risk accordingly. 👀🔥
Bankniftysell
BankNifty Intraday Levels 28-Oct-2024, Selling TrendBankNifty has immediate resistance near 50985-51065 wait for the price come to near resistance Zone and enter only on reversal for good risk:reward ratio.
Bank Nifty selling trend continue keep find reversal on every rise.
Note : Its just an analysis, wait for the price to confirm.
Disclaimer : Always follow risk to reward, this is the only key to success in market, no matter how much good a trade is looking we never know the future.

Nifty Bank Index - BANKNIFTYThe chart depicts the 4-hour price movement of the Nifty Bank Index on the NSE. Here is an analysis and summary:
Analysis:
1. Possible Double Top: The chart indicates a potential double top pattern around the 49,300 level, which is a bearish reversal signal.
2. Current Price Movement: The price has recently declined from the double-top region, suggesting a potential pullback.
3. Support Levels:
- 50% Retracement: The price might find support around the 48,590 level, which is the 50% Fibonacci retracement level.
- 61.8% Retracement: A stronger support is expected around the 48,320 level, the 61.8% Fibonacci retracement level.
4. Target:
- If the index respects these retracement levels and rebounds, the 100% target is projected at 50,500, suggesting a potential uptrend continuation.
Forecasted Movement:
- Short-term: The price might continue to decline towards the 48,590 level, and possibly to the 48,320 level.
- Reversal Potential: If the price finds support at these levels, a rebound is likely, leading to an upward movement towards the 50,500 target.
- Bullish Scenario: The chart shows a potential bullish scenario if the support levels hold, leading to a rise back towards and possibly beyond the recent highs.
Summary:
The Nifty Bank Index chart shows a potential double top formation indicating a bearish reversal. However, if the index finds support at the 50% (48,590) or 61.8% (48,320) Fibonacci retracement levels, there is a potential for a bullish reversal aiming for the 50,500 target. It is crucial to monitor these support levels for potential buying opportunities and confirmation of the upward trend resumption.

BANKNIFTY SHORT
Price has formed a Fresh Monthly Demand @ Rs. 42015 and has to retrace into it,
for now We have a downward structure formed and Price should respect the Daily Supply.

Banknifty for 12-01-23 or week end.NOTE:
candle closing will be only confirmation don't go aggressive and get trapped.
play with the levels
my view-
Short as daily view remains sell on rise.
Can sell 42400 calls.
stoploss watch closing candle.

we are on short side bankniftywe are on short side banknifty imp level to watch out 43150 open then it will be very easy for sell side
only and only one condition we will be upside if 2 hours spend near 43200-43150 then
rest all the condition we will go sell on rise

BANKNIFTY READY FOR ONE MORE FALL!!!
The Trend is from Weeky Supply to the Monthly Demand.
We have a Source Supply in Weekly, Destination Demand in Monthly.
Price has now just entered a Daily Supply which is a Trade Zone for Short position.

Nifty Short LongEducational Purpose Only
It is Price Action Chart 📉📈
With Levels & Zones 🎯
Like 👍 & Follow ❤️ Me in TradingView
So I Post Daily Analysis of Nifty & BankNifty 🎯
Today Five Likes for BankNifty Analysis 📈📉
Posting These Analysis for you Guys ❤️
Comment Your Stocks for My Analysis 💙

BankNifty ShortEducational Purpose Only
It is Price Action Chart 📉📈
With Levels & Zones 🎯
Like 👍 & Follow ❤️ Me in TradingView
So I Post Daily Analysis of Nifty & BankNifty 🎯
Today two likes for BankNifty Analysis 📈📉.
Posting These Analysis for you Guys❤️
No Likes for Nifty,, So No Analysis is Sharing.😈

BankNifty IntradayEducational Purpose Only
It is Price Action Chart 📉 Analysis with Levels Zones🎯
Like 👍 & Follow ❤️ Me in TradingView
So I Post Daily Analysis of Nifty & BankNifty 🎯


Banknifty Expiry Setup 24/03/22Banknifty buy above 36350
Target 1 - 36500
Target 2 - 36650
Banknifty sell below 35900
Target 1 - 35500
Below 35500
Target 34700

Banknifty chart setup for Monday 21/3In last 2 previous sessions there was huge gap up and it was total 1500 points move in just two days.
Based on above chart resistance is placed at 36700 followed by 37000
When banknifty will close above 37000 resistance further up move will open.
On the flip side 35880 will act as a support.
Breaking below 38500 we can see 35080 level near future.
How to trade banknifty on coming days?
Buy above 36720
Target 1 - 36880
Target 2 - 37050
Sell below 36200
Target 1 - 36000
Target 2 - 35880

Banknifty trading setup for 09-03-2022Banknifty trading setup
Buy above 33270
Target 33500
Sell below 32870
Target 32630, 32550

BankNifty 8th November setupMuhurat trading day was kind of boring with no move at all but we made near 25 pts profit in PE side after it broker our support level but that was it for that day.
BankNifty 8th November :
Buy Above: 39685
Sell Below: 39560
Please LIKE, COMMENT and SHARE to motivate and support me. I'll keep on posting new ideas on Indices & Stocks.
Any comments and critiques will be appreciated even if it's of opposite view as a trader can also be right so many times.

BANKNIFTY short strangle strike's ❗❗❓Hii , traders 😊
I hope that you are doing well
🛑 Are seeking for which strike I have to sell then listen here for 1 min
🛑 Selling strikes purely based on India vix
🛑 Short strangle strike's for BANKNIFTY
◽ sell CALL
➡️ Sell 38100 CE with stop loss of 37900 (simply exist from position after breakout of 37900 with is crucial resistance level I have discussed above it you can checkout by visiting mine profile)
◽ Sell PUT
➡️ Sell 37400 PE with Stoploss of 37500 (or in other words : exist from PUT position if breakdown of 37500 which crucial support zone . I have discussed above it clearly u can visit mine profile and Checkout)
➡️ If sold both both strikes (in other words if do short strangle)
Key important you must have to follow
◽ Exist from one position if breakdown/breakout happens and keep it another side for until reach the target level
( if want to know Target level set visit mine profile and watchout BANKNIFTY analysis for expirey day I have clearly mentioned Target levels)
◽ If breakout happens at (37900)exist from Position of CE or buy back CE or close CE selling position
Then keep short side PE to reach Target of 38000 (I clearly explained about this crucial resistance level you can visit mine profile and Checkout)
◽ If breakdown happens (at 37500 ) then exist from Position PE or buyback PE or Close Position PE
Then keep it selling CALL (CE) until reach Target level 37250
🛑You can also short only side either CALL or PE and follow respective Stoploss points
(Personally I will recommend Sell CALL or CE because fear market is higher means if negative is out then fear market will be higher and it will go behind our expectations)
🛑 What is the margin required to do this Short strangle ❗❓
Yeah ,
➡️ Margin requires about 1.3 L in Indian rupees
◽ And you can also reduce this margin to 66k (66000) 😱 How ❗❓
➡️ If you buy far OTM strikes for Covering to Both CE and PE then u will get margin benefit about 64k (1.3L - 66k = 64k benefit means no need to pay if you buy covering CE and PE for sell )
If you do this you only need to pay 66000 as margin to execute this trade instead of 1.3L
🛑Do you wanna know completely about how to select strike to short the market based on India vix volatility index ❗❓
Well , I will explain about
◽ If you give me 10 like and 10 reputation Then I will explain about it in next analysis 😊
🛑Any doubts regarding on this comment below I will definitely help you guy's
And if I'm wrong please let me know in comment section I will definitely correct my mistake
Thanks for reading and do like it and follow for more and give me reputation it will boost mine confidence.
have nice day 😊

BANKNIFTY strikes to selling based on vixBankniftyse traders 😊
I hope that you are doing well
🛑 Are seeking for which strike I have to sell then listen here for 1 min
🛑 Selling strikes purely based on India vix
🛑 Short strangle strike's for BANKNIFTY
◽ sell CALL
➡️ Sell 37400 CE with stop loss of 37350 (simply exist from position after breakout of 37350 with is crucial resistance level I have discussed above it you can checkout by visiting mine profile)
◽ Sell PUT
➡️ Sell 36600 PE with Stoploss of 36850 (or in other words : exist from PUT position if breakdown of 36850 which crucial support zone . I have discussed above it clearly u can visit mine profile and Checkout)
➡️ If sold both both strikes (in other words if do short strangle)
Key important you must have to follow
◽ Exist from one position if breakdown/breakout happens and keep it another side for until reach the target level
( if want to know Target level set visit mine profile and watchout BANKNIFTY analysis for expirey day I have clearly mentioned Target levels)
◽ If breakout happens at (37350)exist from Position of CE or buy back CE or close CE selling position
Then keep short side PE to reach Target of 37800 (I clearly explained about it visit mine profile)
◽ If breakdown happens (at 36850 ) then exist from Position PE or buyback PE or Close Position PE
Then keep it selling CALL (CE) until reach Target level 36550
🛑You can also short only side either CALL or PE and follow respective Stoploss points
(Personally I will recommend Sell CALL or CE becaut fear market is higher )
🛑 I will explain completely about how to select strike to short the market based on India vix volatility index
➡️ If you give 50 like and 50 reputation Then I will explain about it in next analysis 😊
🛑Any doubts regarding on this comment below I will definitely help you guy's
And if I'm wrong please let me know in comment section I will definitely correct my mistake
◽ Thanks for reading and do like it and follow for more have nice day 😊

BANKNIFTY 1 HIt's only my view.
If you want to take a trade, drop down to lower time frame and take trade.
Let see how the market plays.

Bank Nifty Buy / Sell based on Fibo and Gann INTRADAYHave a HAPPY TRADING AND PROFITABLE NEW YEAR 2021
sell bank nifty 31090 - 31770
Stop loss 32050
Target 26050
Target 23500

BankNifty Strong Bearish SignBankNifty looks strongly bearish and 19500 is likely to test soon.
Trend is down from daily time frame to 1 minute. So, I will wait for pullback just to enter a short trade unless it breaks blue trendline.
For the time being, 21000 is the crucial resistance level and 19500 will act as support.
Check out the Blue downward trendline which may act as resistance and Red upward trendline and Black horizontal Line may act as a support level.
However, I strongly believe that 19500 will break and more pain is there.

BankNifty Intraday Trade Setup [16 April 2020]BankNifty looks weak and may fall further. However, I will short BankNifty once it reaches the downward red coloured trendline.
If price rejects this red trendline, then I will short the BankNifty.
Target: 19000/18800/18500
Initial SL: 19750
