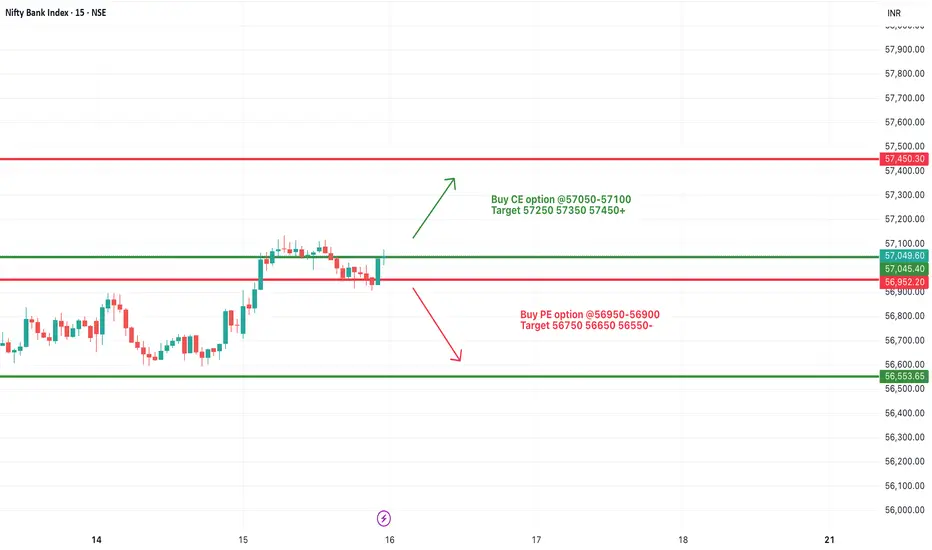
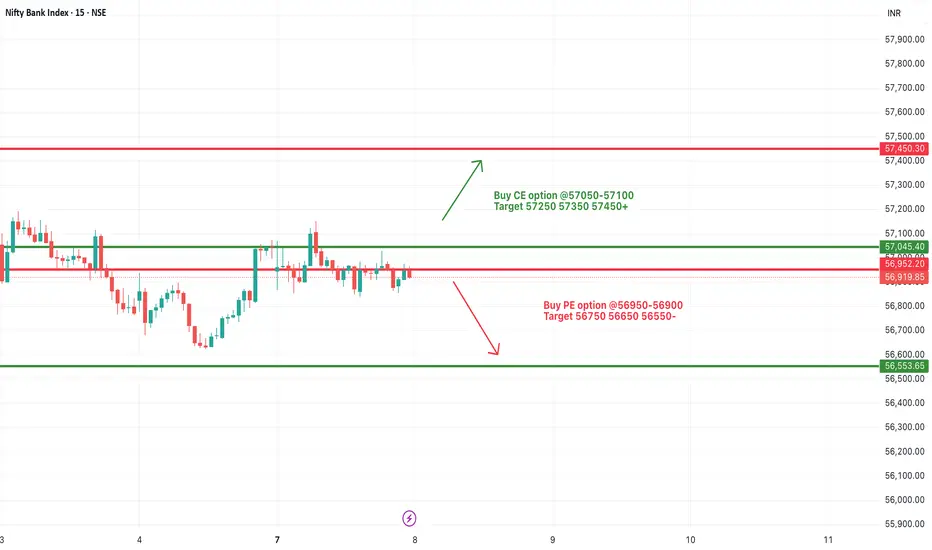
[INTRADAY] #BANKNIFTY PE & CE Levels(25/07/2025)Bank Nifty is likely to start the session with a slight gap-down, hovering just below the 57,050–57,100 resistance zone. This zone has been acting as a critical barrier over the past sessions, and until it's breached, upside momentum may remain capped.
A strong bullish move can be anticipated above 57,050, where call option buying is favored. If Bank Nifty sustains this breakout, we can expect a continuation rally toward 57,250, 57,350, and 57,450+ levels. This would mark a short-term trend reversal and signal fresh bullish interest.
On the downside, weakness may resume if the index breaks below the 56,950 mark. A sustained move below this could trigger a quick correction targeting 56,750, 56,650, and 56,550- levels, offering good opportunities for put option buyers.
Bankniftytradesetup

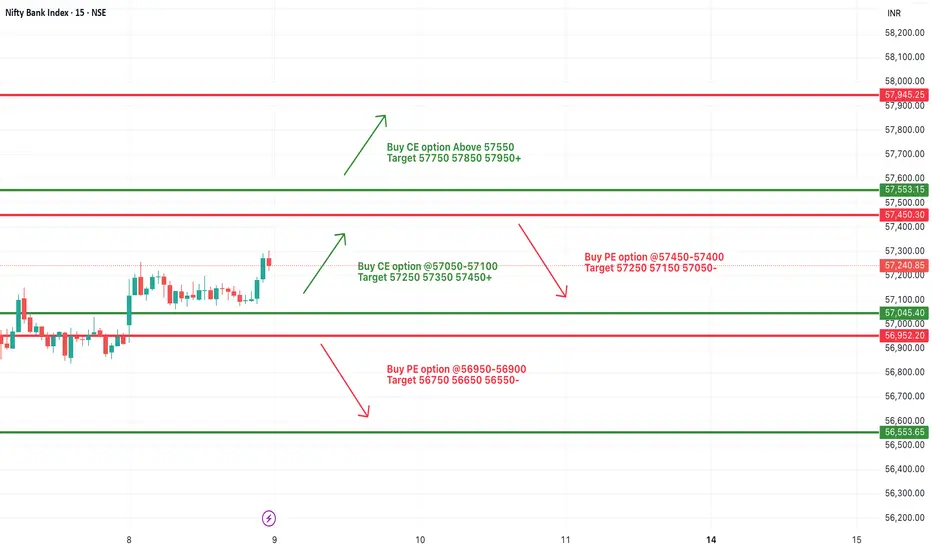
[INTRADAY] #BANKNIFTY PE & CE Levels(24/07/2025)Bank Nifty is likely to open with a slight gap-up, continuing its recent upward trajectory. The index has shown strength by reclaiming key resistance zones and now trades above 57,100, indicating bullish sentiment in the market. Today’s price action will be crucial near immediate supply and resistance zones.
On the upside, if Bank Nifty sustains above 57,050–57,100, a continuation move may unfold toward 57,250, 57,350, and 57,450+ levels. A decisive breakout above 57,550 will open up further upside possibilities with targets near 57,750, 57,850, and 57,950+, where the next key resistance lies.
On the downside, weakness will only emerge if the index breaks below 56,950, which could trigger a sell-off with downside targets of 56,750, 56,650, and 56,550-. This zone also marks the base of the recent rally, and breaching it could suggest exhaustion of momentum.
Overall, the trend remains positive with momentum favoring the bulls as long as the index remains above 57,000. Traders are advised to wait for confirmation near the mentioned levels before initiating trades and maintain strict risk management with trailing stop-losses.

[INTRADAY] #BANKNIFTY PE & CE Levels(23/07/2025)Bank Nifty is likely to open with a gap-up today, continuing its recent volatility and range-bound behavior. There are no major changes from yesterday’s levels, and the index remains in a crucial zone near short-term resistance and support bands. A breakout or breakdown from this zone could decide the next directional move.
Upside continuation may resume if Bank Nifty breaks above 57,050, which can trigger a momentum rally toward 57,250, 57,350, and possibly 57,450+. Traders can consider long positions in this case once confirmation and volume support the breakout.
On the downside, if the index trades and sustains below 56,950, further weakness may be seen. A bearish move below 56,950 can lead to a drop toward 56,750, 56,650, and 56,550-. This level becomes important support, and a breach could invite selling pressure.
Additionally, if Bank Nifty takes support near the 56,550–56,600 zone again, reversal buying can be considered. A bounce from this area could offer targets of 56,750, 56,850, and 56,950+.

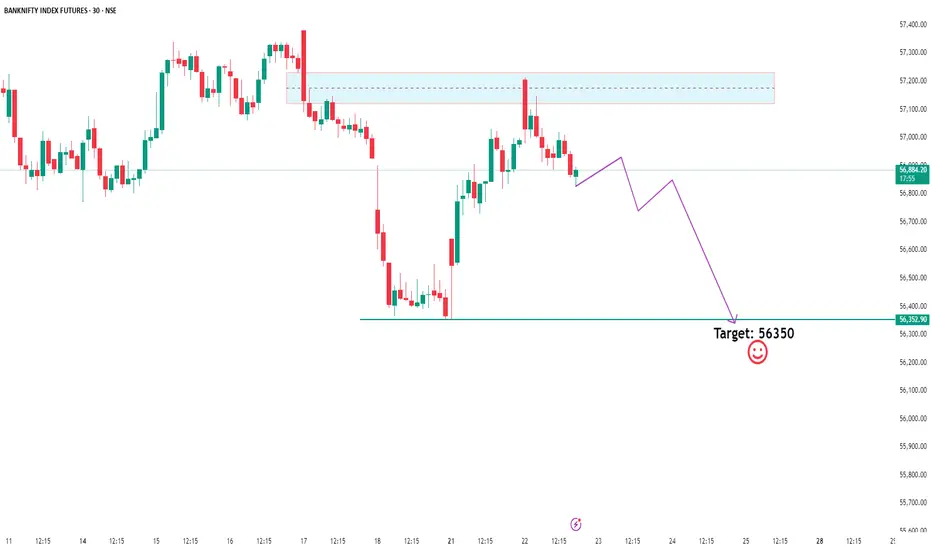
Bank Nifty Breakdown? Eyeing 56,350 –Time to Ride the Sell Wave!Bank Nifty is showing clear signs of distribution as Smart Money appears to be offloading positions near recent highs. Price has swept liquidity above the previous highs and is now rejecting key supply zones, confirming a potential sell-side shift in market structure.
With a break in internal structure and premium zones being respected, we're now watching the 56,350 level as a high-probability target for downside liquidity.
If you're trading with the Smart Money Concept in mind — this could be the move where retail gets trapped while institutions ride the wave down. Stay sharp and manage your risk accordingly. 👀🔥
[INTRADAY] #BANKNIFTY PE & CE Levels(22/07/2025)Bank Nifty is expected to open gap-up today, continuing the momentum seen in yesterday’s session. The index has successfully crossed above the short-term resistance zone near 56,900, showing bullish strength. The next key breakout level is at 57,050, and once crossed decisively, we may see a sharp upward rally.
Traders can look to Buy CE option above 57,050, targeting 57,250, 57,350, and 57,450+. The structure indicates that momentum buyers may take over above this zone, with the potential for strong upside if Bank Nifty sustains above the breakout level.
On the downside, if the index slips back and breaks 56,950 decisively, then Buy PE option below 56,950 can be considered, with potential downside targets of 56,750, 56,650, and 56,550-. This zone will act as an immediate intraday support and any fall below it can lead to quick profit-booking.
Additionally, if Bank Nifty finds support near the 56,550–56,600 zone again, traders may also consider reversal CE buying with upside targets of 56,750, 56,850, and 56,950+.

[INTRADAY] #BANKNIFTY PE & CE Levels(21/07/2025)Bank Nifty is expected to open with a gap-up, indicating early bullish sentiment. However, price action near the 56,450–56,500 zone will be crucial in deciding the day’s direction. If Bank Nifty manages to sustain above the 56,650 level after opening, it may invite fresh momentum on the upside. A move above this zone can be seen as a strength confirmation, potentially pushing the index toward targets of 56,750, 56,850, and even 56,950+ levels.
On the other hand, if the index faces resistance and shows rejection from the 56,450–56,400 supply zone, weakness can creep in. This could trigger a corrective move toward the lower levels of 56,250, 56,150, and 56,050-, making it a favorable short trade setup for the day if confirmed by price action.
Additionally, a breakdown below the 55,950 support level can lead to strong bearish pressure. If this level is breached and sustained, the index may fall sharply toward the support zones of 55,750, 55,650, and 55,550-, indicating bearish continuation.

[INTRADAY] #BANKNIFTY PE & CE Levels(18/07/2025)Bank Nifty is expected to open flat around the 56800 zone, suggesting indecision in the early session. If it manages to move upward and sustain above the 57050–57100 resistance range, it could invite bullish momentum targeting 57250, 57350, and even 57450+. A breakout above this level can trigger a continuation of upward movement, but volume and price confirmation are essential.
On the downside, if the index stays weak and slips below the 56950–56900 zone, we may see fresh bearish pressure pulling it toward 56750, 56650, and 56550 support levels. This zone remains a crucial intraday pivot for traders to watch.
A reversal opportunity may also emerge if the index drops further near 56550–56600 and then shows a sharp recovery. In such a case, targets of 56750, 56850, and 56950+ are possible, making it a good support-based bounce trade. Overall, the market might remain sideways with both opportunities for quick scalps and reversals—focus on key levels and act with strict stop losses.

[INTRADAY] #BANKNIFTY PE & CE Levels(16/07/2025)Bank Nifty is expected to begin the day on a flat note near the 57000 mark, indicating indecisiveness after the previous session's recovery. The immediate resistance zone lies between 57050 and 57100. A sustained move above this level can trigger an upward continuation toward the targets of 57250, 57350, and possibly 57450+. This zone will be key for bullish momentum, and traders can look for strength confirmation around this breakout.
On the downside, the 56950–56900 level is crucial. If Bank Nifty slips below this zone, it may invite fresh selling pressure, with intraday downside targets around 56750, 56650, and 56550. The support at 56550 and below can act as demand zones for any pullback.
[INTRADAY] #BANKNIFTY PE & CE Levels(15/07/2025)Bank Nifty is expected to open with a gap-up near the 56950 zone. If the index sustains below the 56900–56950 resistance range after the initial up-move, it could face selling pressure. A downside move from this level may trigger a correction toward the 56750, 56650, and 56550 zones. This level becomes a key intraday resistance.
On the downside, a breakdown below the 56650 level could intensify selling, leading to further downside targets of 56250, 56150, and 56050. This zone must be monitored closely as it holds short-term support strength. A decisive move below 56650 will shift sentiment bearish for the session.
On the other hand, a breakout and sustained move above 57100 could attract bullish momentum and may lead to upside targets of 57250, 57350, and even 57450+. Price action around the 57000–57100 mark will be crucial to determine any bullish continuation.
Overall, today's session is expected to open strong but watch for follow-through near the key zones. Traders should remain cautious and wait for confirmation around 56900–57100 for direction clarity.

[INTRADAY] #BANKNIFTY PE & CE Levels(14/07/2025)Bank Nifty is expected to open slightly gap-down, continuing the weakness observed in the previous sessions. The index is currently trading around the 56700 level after facing consistent resistance near the 57100 zone. If the index sustains below the 56950–56900 region, it may extend the downside toward 56750, 56650, and further down to 56550.
A break below 56650 could trigger a sharper fall, with the next key support levels placed at 56250, 56150, and 56050. These zones will be critical to watch for potential reversal or further breakdown.
On the upside, any strength and breakout above the 57050–57100 resistance zone may open the path toward higher levels like 57250, 57350, and 57450+. However, unless this zone is breached with strength, upward movement is likely to remain capped.
The overall structure indicates bearish pressure, and the price action near 56900–56650 will decide the intraday trend. Traders should remain cautious and react based on levels with proper risk management.

Institutional Trading Process 1. Investment Idea Generation
This is where it all begins.
Institutions generate trading ideas based on:
Fundamental research (company earnings, macroeconomic data)
Quantitative models (statistical or algorithmic strategies)
Technical analysis (price action, trends, volume)
Sentiment analysis (news flow, social media, market psychology)
Often, the research team, quant team, or portfolio managers work together to develop high-conviction trade ideas backed by data and analysis.
2. Pre-Trade Analysis and Risk Assessment
Before placing a trade, institutions perform:
Risk/reward analysis
Scenario testing (How does the trade perform in different market conditions?)
Volatility analysis
Position sizing based on portfolio risk budget

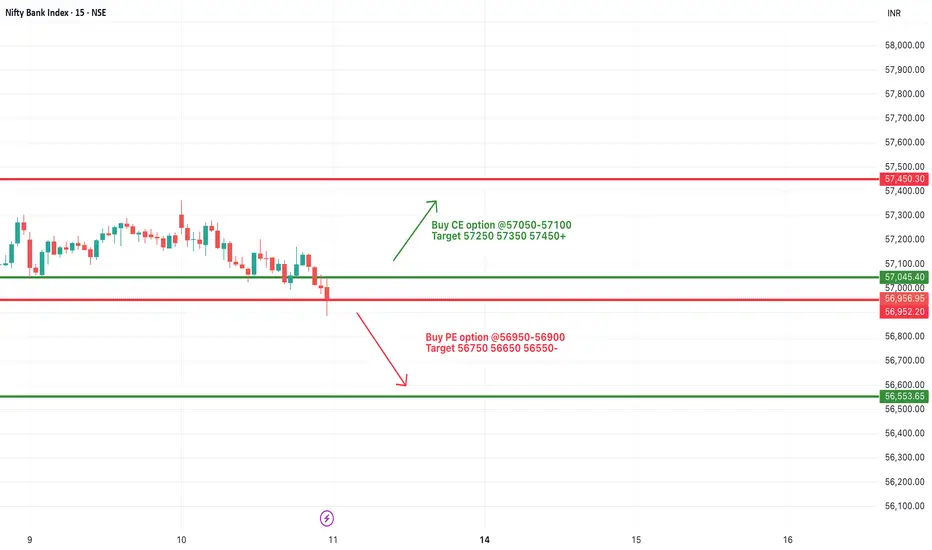
[INTRADAY] #BANKNIFTY PE & CE Levels(11/07/2025)Bank Nifty is expected to open flat today after a prolonged consolidation and a narrow trading range observed in the previous sessions. The index is hovering near the support zone of 56900–57000, which has acted as a critical level in recent price action.
If Bank Nifty sustains above 57050–57100, we may witness a rebound towards 57250, 57350, and 57450+. However, a decisive breach below the 56900 level can trigger a sharp fall, with immediate downside targets at 56750, 56650, and 56550-.
Since the index is trading close to a major support zone, today's movement could decide the next directional trend. Until a breakout or breakdown is confirmed, expect range-bound moves with limited momentum.
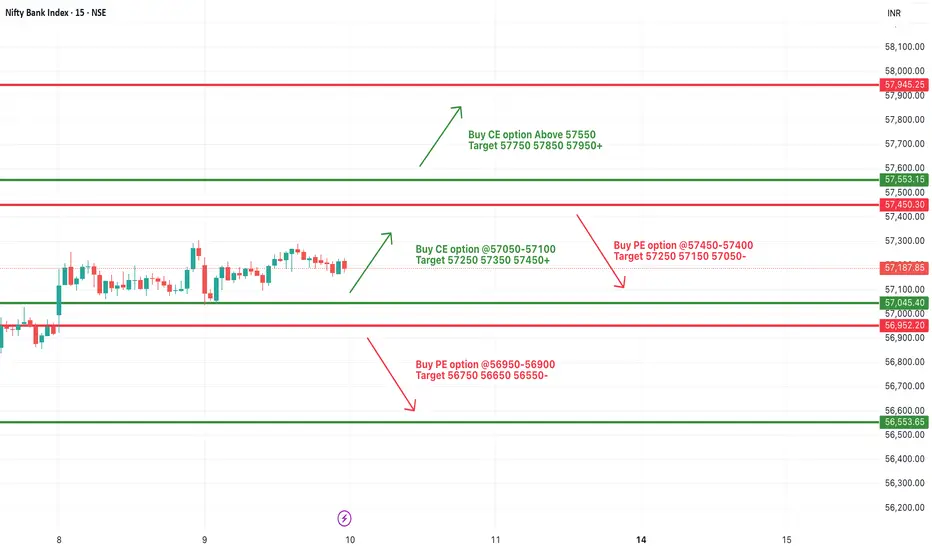
[INTRADAY] #BANKNIFTY PE & CE Levels(10/07/2025)Bank Nifty is expected to open flat today due to the continued consolidation seen over the last few sessions. The index is trading within a tight range between 57450 on the upside and 57050 on the downside, indicating indecision in the market.
A sustain above the 57050–57100 zone could initiate fresh buying momentum, potentially pushing prices towards the targets of 57250, 57350, and 57450+. Sustained move above 57550 may further lead to an extended rally toward 57750, 57850, and even 57950+ levels.
On the other hand, if the index breaks below the 56950–56900 level, it may invite fresh selling pressure. In such a scenario, downside targets are seen at 56750, 56650, and 56550-.
Until a decisive move happens beyond the upper or lower bounds, expect sideways action within the current consolidation range. Traders are advised to wait for a breakout from the range for directional trades.
[INTRADAY] #BANKNIFTY PE & CE Levels(09/07/2025)Bank Nifty is expected to open slightly gap up today near the 57200-57250 zone, indicating mild bullish sentiment carrying over from the previous session. The index has broken out of the tight consolidation range and now approaches a key resistance near the 57400-57450 area.
A sustained move above 57550 could lead to a fresh upward rally toward 57750, 57850, and 57950+, supported by recent bullish momentum. However, if the index fails to sustain above 57400-57450, it may see a pullback, where traders should watch for possible selling pressure targeting 57250, 57150, and even 57050-.
If Bank Nifty drops below the 57100 level and especially under the 56950-56900 zone, it may turn bearish with potential downside targets at 56750, 56650, and 56550-. Overall, price action around the 57450 level will be key in defining intraday trend direction.
Banknifty chart analysis for tommorrowdosto
banknifty ka chart apko share kar raha hu jo apko kal ke liye help karega trading main.
aaj banknifty aur nifty dono ne hee ek breakout diaya.
[INTRADAY] #BANKNIFTY PE & CE Levels(08/07/2025)Bank Nifty is expected to open flat with no significant change in levels compared to the previous session. The price action continues to remain within a consolidation range between 56950 and 57050. A breakout above the 57050 level could trigger bullish momentum, with potential upside targets at 57250, 57350, and 57450+. This resistance zone has been tested multiple times, and a clean breakout could attract fresh buying interest.
On the other hand, if Bank Nifty slips below the 56950–56900 support zone, it may lead to fresh selling pressure. In that case, we may see targets of 56750, 56650, and 56550 being achieved on the downside.
Since the market is currently range-bound and trading near the breakout/breakdown zones, traders are advised to stay cautious and wait for a confirmed move above 57050 or below 56950 for directional trades. Risk management is key, especially in this narrow consolidation phase.
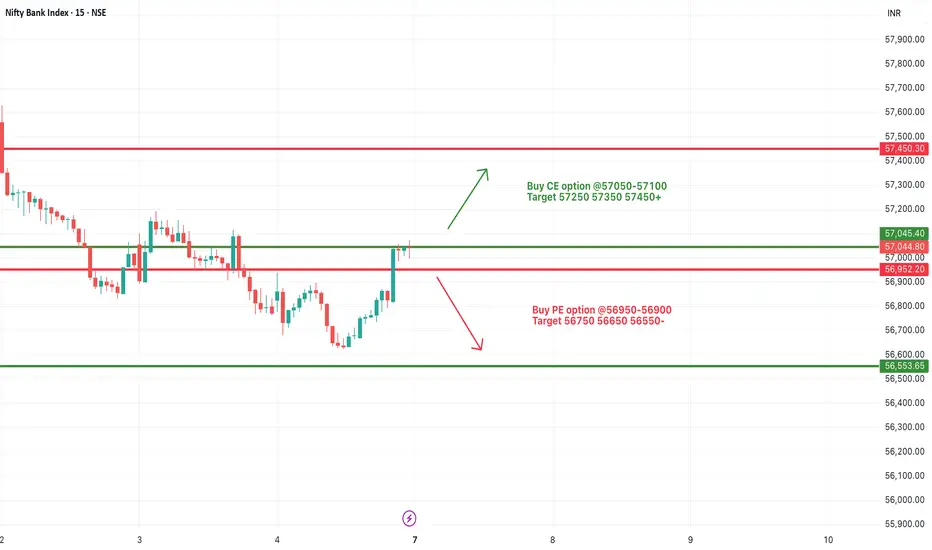
[INTRADAY] #BANKNIFTY PE & CE Levels(07/07/2025)Bank Nifty is expected to open flat near the 57000 mark, which coincides with a crucial resistance level. If the index manages to sustain above the 57050–57100 zone, it may trigger bullish momentum, pushing prices toward immediate targets of 57250, 57350, and potentially 57450+. This breakout zone holds significance as it marks a clear shift in sentiment from recent downtrends to potential reversal.
On the downside, if Bank Nifty faces rejection from current levels and slips below the 56900–56950 zone, it may indicate fresh weakness. In such a scenario, we can expect downward movement with targets at 56750, 56650, and 56550. The 56900 level will act as a short-term support, and a breakdown below it may resume the bearish momentum from the past sessions.
Traders should be cautious near the 57000–57050 zone and wait for a clear directional move. Whichever side breaks first, the movement is likely to gain momentum, so manage positions with strict stop losses and partial booking at each target.
BANKNIFTY LOVERS Ready towards 60000 + ?/ ( SHORT TERM IBANKNIFTY 30 Mins counts indicate a bullish wave structure.
Both appear to be optimistic, and this index invalidation number is 56910 ( 30 Mins closing)
target are already shared as per implus move
Investing in declines is a smart move for long-term players.
Every graphic used to comprehend & LEARN & understand the theory of Elliot waves, Harmonic waves, Gann Theory, and tTme theory
Every chart is for educational purposes.
We have no accountability for profit or loss.

[INTRADAY] #BANKNIFTY PE & CE Levels(04/07/2025)Bank Nifty will open with a gap-up near the 56950 zone, placing it close to an immediate resistance area. If the index sustains above the 57050–57100 level, it indicates bullish strength and could trigger a further upward move toward 57250, 57350, and potentially 57450+. This level acts as a breakout zone for upside momentum. On the other hand, if the price faces resistance around 56950–57000 and starts reversing, a short opportunity opens below 56950–56900, with targets placed at 56750, 56650, and 56550.
In case Bank Nifty falls further and breaches the 56450 mark, it may signal a strong breakdown and continuation of the downtrend, leading to lower targets around 56250, 56150, and 56050. However, if the index takes support at the 56650–56600 zone and shows signs of reversal, it can provide a buying opportunity for a bounce back toward 56750, 56850, and 56950.
Overall, the day’s strategy should be reactive to these key levels, with trades initiated only upon proper price action confirmation. Use trailing stop-loss to protect profits and exit partially at key target levels.

[INTRADAY] #BANKNIFTY PE & CE Levels(03/07/2025)Bank Nifty is expected to open flat near the 56,970 level. After a strong downward move in the previous session, prices are attempting to recover from the 56,950 support zone. This level may act as an immediate base in early trading hours.
If Bank Nifty sustains above 57,000–57,045 levels, we may see a short covering rally toward 57,250–57,450. However, any rejection near 57,000 can again drag the index toward 56,750 and 56,550. Since the price is opening near a key decision zone, it's advised to wait for directional confirmation before entering any trade.

[INTRADAY] #BANKNIFTY PE & CE Levels(02/07/2025)Bank Nifty is expected to open flat near the 57,440 level, just below the immediate resistance at 57,450. This zone will play a crucial role in today’s session. Sustaining above 57,450 can lead to bullish momentum with potential upside targets of 57,550, 57,850, and 57,950. Traders may look for a breakout confirmation before entering long trades.
On the downside, if the index fails to sustain above the 57,450 level and reverses, support around the 57,100–57,050 zone could be tested. A move below this range might lead to a short-term decline toward 57,000 and 56,950. The market remains in a consolidation phase, and breakout from this tight zone can lead to a directional move.

[INTRADAY] #BANKNIFTY PE & CE Levels(01/07/2025)Bank Nifty is expected to open slightly gap up near the 57,450 level, which lies close to an important resistance zone. If the index manages to sustain above this level, a further upside movement may be seen toward 57,750, 57,850, and 57,950. Strength above 57,500 could indicate bullish momentum continuation and may attract fresh buying interest.
On the flip side, if Bank Nifty fails to hold above the 57,450–57,400 zone and shows signs of reversal, a decline toward 57,250, 57,150, and 57,050 is possible. A breakdown below 56,950 will likely trigger further downside levels toward 56,750, 56,650, and 56,550. It is advised to observe price action around the 57,450–57,500 level for directional clarity in today’s session.

NIFTY Short Term View <25650-25200>If you follow my other ideas, I think you are gaining trust on the tool ZZ. Please don't blindly follow me and my posts. I just want to make you curios that one tool with clear idea is enough to predict the market. But condition is you have to practice a ton.
Here I am sharing just glimpse of it, there are so many things to do with ZZ.
Keep learning || Trust analysis || Keep Trading & Investing
Any question or suggestion please feel free to comment below.
