[INTRADAY] #BANKNIFTY PE & CE Levels(24/06/2025)Today, a gap-up opening is expected in Bank Nifty near the 56,500 level. This zone lies close to a crucial resistance level, so price action after opening will be key. If Bank Nifty sustains above the 56,550–56,600 zone, it could trigger a strong upside rally toward 56,750, 56,850, and potentially 56,950+ levels. On the other hand, if it fails to hold above 56,000 and starts slipping below the 55,950–55,900 zone, a downside move is likely, which could push the index toward 55,750, 55,650, and 55,550 levels.
Bankniftytrend

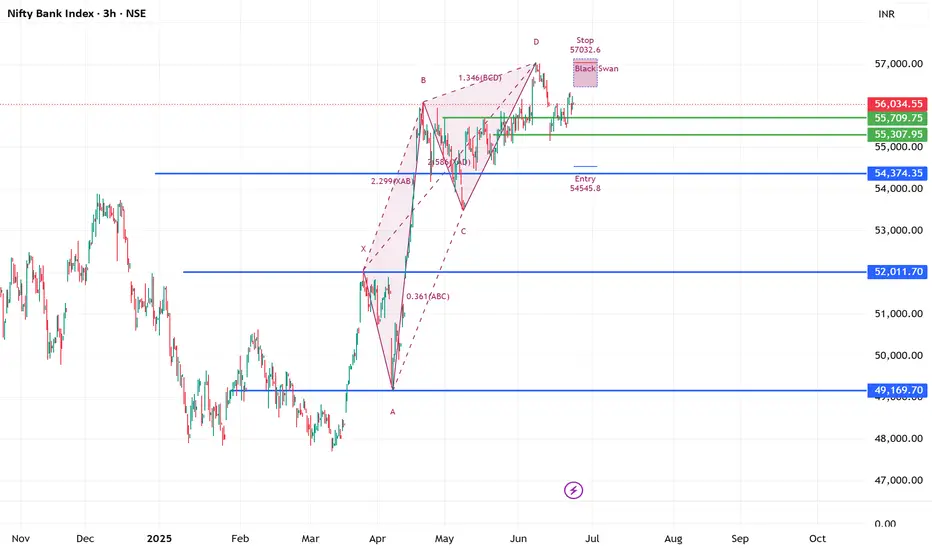
Berish Black Swan (Harmonic pattern) Running in #BANKNIFTY 3hrs56069 spot 23-06-2025
patterns clearly suggest after hitting ATH 57049
at this angel 1.346 BCD move completed by price
now due to amid war situation traders must take extra cautious approach
this is pure educational based study !!!!!
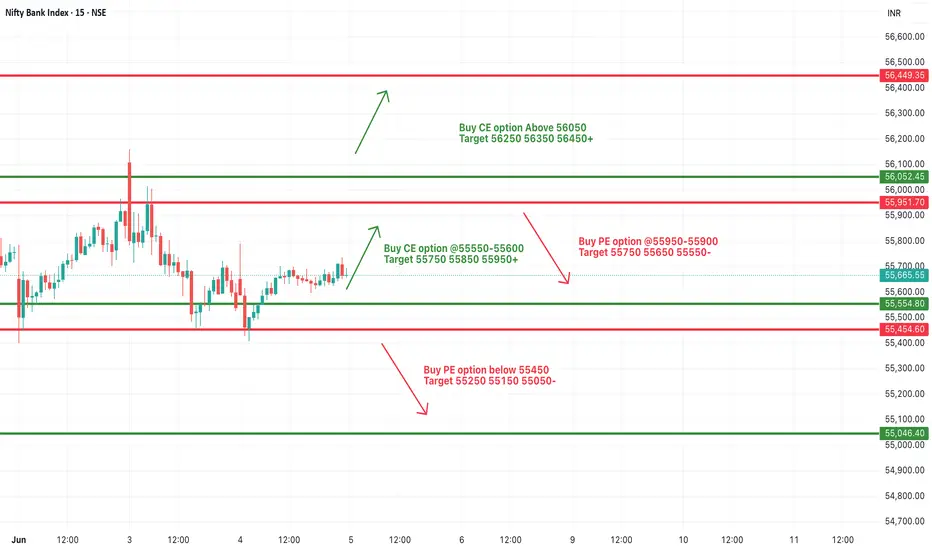
[INTRADAY] #BANKNIFTY PE & CE Levels(23/06/2025)A flat opening is expected in Bank Nifty today. After the open, if Bank Nifty sustains above 56,050, an upside rally is likely toward 56,450+. A further continuation of this rally could occur if the index trades above 56,550–56,600, with extended targets up to 56,750 → 56,850 → 56,950+.
On the downside, if Bank Nifty trades below 55,950, some selling pressure may emerge. However, 55,550 will act as strong support for today’s session. A major downward move is only expected if this support breaks, opening potential targets of 55,250 → 55,150 → 55,050-.

[INTRADAY] #BANKNIFTY PE & CE Levels(20/06/2025)Today, a flat opening is expected in Bank Nifty, with price action likely to begin around 55,500 levels. There are no major changes in the key levels compared to yesterday, and the market has remained in a consolidation phase.
🔽 If Bank Nifty starts trading below 55,450, it may trigger further downside toward 55,250 → 55,150 → 55,050-. This zone has acted as intraday support recently.
🔼 On the other hand, a move above 55,550–55600 may lead to upward momentum toward 55,750 → 55,850 → 55,950+. A breakout above 56,050 could open the path toward 56,250 → 56,350 → 56,450+.
⚠️ Key Takeaways:
Consolidation continues, so avoid aggressive positions until a breakout occurs.
Watch for range breakouts above 56,050 or below 55,450 for directional moves.
Use tight stop-losses and trail profits smartly to protect against volatility spikes.

[INTRADAY] #BANKNIFTY PE & CE Levels(19/06/2025)Today, a flat opening is expected in Bank Nifty near the 55,800 zone. The index has been moving within a defined range for the past few sessions, and there are no major changes in yesterday’s key levels.
🔼 If Bank Nifty sustains above 55,550–55,600, it may show bullish momentum toward 55,750 → 55,850 → 55,950+. A breakout above 56,050 could lead to further upside toward 56,250 → 56,350 → 56,450+.
🔽 However, if the index fails to hold above 55,900–55,950 and starts reversing, a short opportunity may arise toward 55,750 → 55,650 → 55,550-. Sustained selling below 55,450 can drag the index down to 55,250 → 55,150 → 55,050-.
⚠️ Note:
The market is still in a consolidation phase, so false breakouts are possible. Stick to levels, wait for confirmation, and use strict stop-losses with trailing targets to manage risk effectively.

[INTRADAY] #BANKNIFTY PE & CE Levels(18/06/2025)Today, Bank Nifty is expected to open with a slight gap down near the 55,650–55,700 zone, indicating early signs of consolidation within a tight range.
🔼 If Bank Nifty sustains above the 55,550–55,600 levels after opening, it could trigger a bullish move towards the targets of 55,750 → 55,850 → 55,950+.
🔽 However, if Bank Nifty approaches the 55,950–55,990 zone and shows signs of reversal, a corrective fall may follow with potential downside targets at 55,750 → 55,650 → 55,550.
🔻 A clear breakdown below the 55,450 level would indicate bearish strength, and the next downside levels to watch are 55,250 → 55,150 → 55,050-.
🚀 On the upside, if Bank Nifty manages to break out above the key resistance of 56,050, we can expect a strong rally with targets at 56,250 → 56,350 → 56,450+.

[INTRADAY] #BANKNIFTY PE & CE Levels(17/06/2025)Today, Bank Nifty is expected to open flat near the 55,970 zone. The market has shown a steady recovery over the past few sessions, and now it stands near a crucial resistance level. If Bank Nifty manages to sustain above the 56,000–56,050 level after the opening, we may see bullish momentum picking up. This could lead to a move toward the higher levels of 56,250, 56,350, and even 56,450+ in the intraday session. A breakout above 56,050 with volume confirmation can act as a trigger for continued upside.
On the flip side, if Bank Nifty struggles to hold above 55,950 and slips below this level, it may face intraday selling pressure. A breakdown can drag the index back down toward 55,750 initially, followed by 55,650 and 55,550 if weakness persists. These levels will act as immediate support zones where short covering or fresh buying may be seen.
Overall, the index remains in a narrow range with critical levels on both ends. A directional move can emerge if either side breaks with strength. Traders should remain cautious and avoid aggressive positions near the opening. Trade with a strict stop loss and consider trailing profits once levels are achieved, as the market may remain choppy around key zones.

[INTRADAY] #BANKNIFTY PE & CE Levels(16/06/2025)Today, a slightly gap-up opening is expected in Bank Nifty near the 55,550–55,600 zone. If Bank Nifty sustains above this zone, it may attempt an upside move toward 55,750, 55,850, and potentially 55,950+ levels during the session.
If Bank Nifty starts trading above 56,050, a further bullish rally can be seen, taking it higher toward the 56,250, 56,350, and 56,450+ zones.
On the downside, if Bank Nifty slips below the 55,450–55,400 zone, it may face further selling pressure, leading to a possible move toward 55,250, 55,150, and 55,050 levels.

#banknifty - 10th June! NSE:BANKNIFTY NSE:BANKNIFTY1!
Understand the chart, observe the analysis, implement while trading:
Key Observations:
1. Trendlines:
- Resistance Trendline: A descending trendline (sloping down) marks the area where the price faces selling pressure. This indicates a pattern of lower highs.
- Support Trendline: An upward-sloping trendline beneath the price indicates where the price finds buying interest. This suggests a slight upward momentum at the support level.
2. Consolidation Zone:
- The price is moving within a tightening range between these two trendlines, forming a wedge or triangle pattern. This indicates consolidation, where the market is waiting for a breakout or breakdown.
3. Support Levels:
- Key support levels are highlighted at 53,407.75, 53,229.05, 53,057.45, and 52,784.15. These levels represent zones where buyers are likely to step in and prevent further price decline.
4. Resistance Levels:
- Resistance levels are marked at 53,679.35, 53,956.65, 54,128.90, and 54,304.25. These are zones where the price may face selling pressure.
5. Current Price Action:
- The price is currently at 53,577.70, approaching the descending resistance trendline. This is a critical point because it suggests a decision zone for the next move.
Scenarios:
1. Bullish Breakout:
- If the price breaks above the descending resistance trendline, it could signal bullish momentum.
- Potential targets are the next resistance levels at 53,956.65, 54,128.90, and 54,304.25.
2. Bearish Breakdown:
- If the price breaks below the support trendline, it may indicate a bearish trend.
- Possible downside targets are the lower support levels at 53,229.05, 53,057.45, and 52,784.15.
3. Neutral Consolidation:
- If the price continues to move within the wedge, traders may need to wait for a clear breakout or breakdown before acting.
What This Chart Suggests:
- The chart highlights decision points for the market, with the wedge pattern indicating an imminent breakout or breakdown.
- A breakout above resistance would suggest strength, while a breakdown below support would indicate weakness.
Trading Plan:
- For Buyers: Wait for a breakout above the resistance trendline and aim for higher resistance levels.
- For Sellers: Look for a breakdown below the support trendline and target the lower support zones.
Not SEBI Registere.

[INTRADAY] #BANKNIFTY PE & CE Levels(13/06/2025)Today, a gap-down opening is expected in Bank Nifty near the 55500 level. If Bank Nifty started trading below the 55450 mark after opening, we may witness further downside movement with targets around 55250, 55150, and possibly 55050 during the session.
On the upside, if Bank Nifty manages to bounce and sustain above the 56050–56100 zone, it could signal a potential recovery. In such a case, we may see a rally toward 56250, 56350, and 56450+ levels.
Traders should remain cautious as the broader structure suggests continued weakness unless Bank Nifty reclaims and holds above the 56050 level. Strict stop-loss and profit trailing are advised, as sharp intraday volatility is expected around support zones.


[INTRADAY] #BANKNIFTY PE & CE Levels(12/06/2025)Today, a gap-up opening is expected in Bank Nifty near the 56550–56600 zone. If the index manages to sustain above this range, it may trigger an upside move toward 56750, 56850, and 56950 levels. A further breakout above 57050 could extend the bullish rally toward 57250, 57350, and possibly 57450+ during the session.
However, if Bank Nifty fails to hold above 56550 and begins to trade below 56450, a downward move could unfold toward 56250, 56150, and 56050 levels. Any sustained weakness may increase selling pressure, dragging the index further down intraday.

[INTRADAY] #BANKNIFTY PE & CE Levels(11/06/2025)Bank Nifty is opening with a slight gap-up around the 56650–56700 zone, continuing its consolidation phase from the previous sessions. The index has been oscillating within a narrow range, reflecting indecision among market participants. Today’s early movement suggests that unless there is a clear breakout or breakdown, the sideways momentum may persist. If Bank Nifty manages to sustain above the 56650 level, it could attempt an upside toward 56750, 56850, and possibly 56950+.
A stronger bullish breakout would be confirmed only if the index crosses and holds above 57050. On the other hand, failure to hold above 56600 and a breakdown below 56450 may trigger a short-term correction toward 56250, 56150, and 56050.
Given the tight structure, traders should remain cautious, avoid aggressive entries, and focus on quick trades with defined stop-losses and targets.

[INTRADAY] #BANKNIFTY PE & CE Levels(10/06/2025)Bank Nifty is expected to open with a gap-up around the 57000 level, placing it directly at a critical resistance zone. This area has previously acted as a rejection point, making today's price action especially significant.
If the index sustains above 57050, it may trigger a fresh bullish leg with potential upside targets at 57250, 57350, and 57450+. Strong momentum above this range could lead to continued buying pressure through the session.
However, if Bank Nifty fails to hold above 57000 and starts rejecting the zone, a reversal may play out. In that case, downside movement toward 56750, 56650, and 56550 can be expected.
Holding above 56550–56600 is essential to maintain bullish structure. If the price dips below that, short-term weakness may extend.

[INTRADAY] #BANKNIFTY PE & CE Levels(05/06/2025)Bank Nifty is opening slightly gap-up around the 55650–55700 zone, hinting at a cautious positive bias. However, the index remains within a well-defined range, and today’s session could act as a trigger for the next directional move.
If Bank Nifty sustains above 55600, bullish momentum may build toward 55750, 55850, and 55950+. A breakout above 56050 could further accelerate the upside, potentially targeting 56250 and beyond.
However, if the index fails to hold above 55700 and starts reversing, a pullback toward 55600 and 55500 is possible.
A breakdown below 55450 would signal weakness and open up downside levels toward 55250, 55150, and 55050, where stronger support is expected.
[INTRADAY] #BANKNIFTY PE & CE Levels(04/06/2025)Bank Nifty is expected to open with a gap-up near the 55950 level, which places it at a critical resistance zone. If it sustains above this level, it may extend the bullish momentum toward 55750, 55850, and 55950+, but more importantly, a breakout above 56050 would trigger a fresh upside rally with targets at 56250, 56350, and 56450+.
However, if Bank Nifty fails to hold above 55900–55950 and reverses below this zone, a short trade setup may activate, with potential downside targets of 55750, 55650, and 55550.
Further weakness can be confirmed only if the index slips below the 55550–55600 support zone, exposing it to 55250, 55150, and 55050 levels.

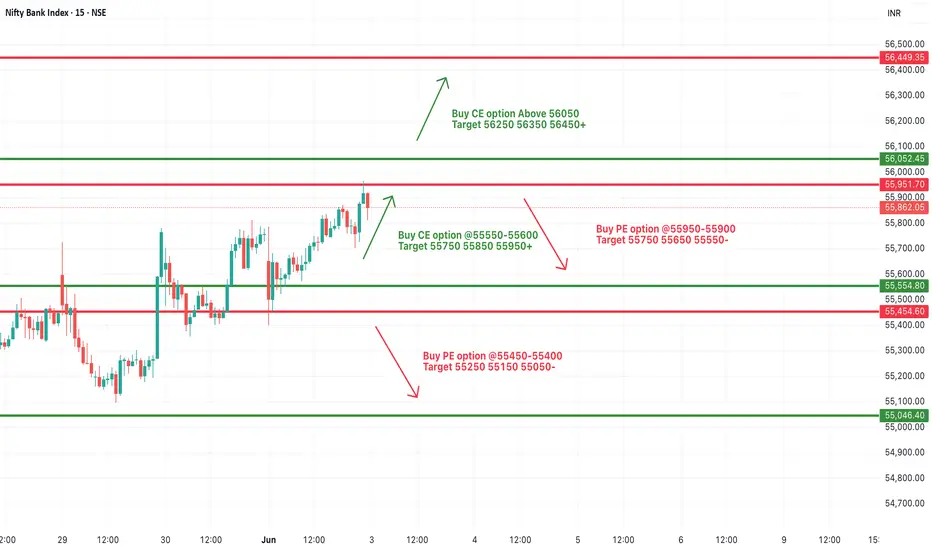
[INTRADAY] #BANKNIFTY PE & CE Levels(03/06/2025)Bank Nifty is expected to open flat around the 55850–55900 zone, continuing near the same levels as the previous session. The index is currently trading in a tight range, indicating potential breakout or reversal zones are nearing.
If Bank Nifty sustains above the 55550–55600 zone, bullish momentum could continue toward 55750, 55850, and 55950+. A clear breakout above 56050 would confirm a fresh upward leg, with extended targets at 56250, 56350, and 56450+.
On the downside, if Bank Nifty slips below 55900–55950, a minor correction is possible with short targets at 55750, 55650, and 55550. Further weakness would only be confirmed below 55450–55400, exposing the downside to 55250, 55150, and 55050.
Fake Break out Down Side. You Know What's Next ?#sbin has made a flag and pole pattern on the weekly timeframe, and formed a fake breakout also.

[INTRADAY] #BANKNIFTY PE & CE Levels(02/06/2025)Bank Nifty is expected to open flat around the 55700–55800 zone. If it manages to sustain above the 55550–55600 breakout zone, the bullish trend is likely to continue with upside targets at 55750, 55850, and 55950+. A further breakout above 56050 may fuel extended gains toward 56250, 56350, and 56450+.
On the downside, if Bank Nifty shows weakness and falls below 55900–55950, a short opportunity may arise targeting 55750, 55650, and 55550 zones. A deeper breakdown below 55450–55400 could lead to further downside levels of 55250, 55150, and 55050.
The price action currently suggests consolidation within a range, so wait for a decisive breakout or breakdown before entering. Use strict stop-losses and book partial profits at major levels as the session may remain volatile near resistance.

[INTRADAY] #BANKNIFTY PE & CE Levels(30/05/2025)Today, Bank Nifty is expected to open flat near the 55600 zone. If it sustains above the 55550–55600 range, a bullish rally may continue with upside targets at 55750, 55850, and 55950+.
Further breakout above 56050 could trigger strong momentum toward higher targets of 56250, 56350, and 56450+.
On the downside, if Bank Nifty slips below the 55450–55400 level, a bearish move may unfold with downside targets at 55250, 55150, and 55050.

[INTRADAY] #BANKNIFTY PE & CE Levels(29/05/2025)Today, Bank Nifty is expected to open flat near the 55450–55500 zone. If it sustains above the 55550 level, a bullish rally may unfold with potential upside targets of 55750, 55850, and 55950+.
On the downside, if Bank Nifty fails to hold and breaks below the 55450–55400 zone, it could trigger a bearish move toward 55250, 55150, and 55050.
Expect consolidation near key levels. Wait for breakout or breakdown confirmation before entering trades. Use tight stop-loss and book profits at each target.

[INTRADAY] #BANKNIFTY PE & CE Levels(28/05/2025)Today, Bank Nifty is expected to open flat near the 55350–55400 zone. If it sustains above 55550, bullish momentum can be expected with upside targets of 55750, 55850, and 55950+.
If the index starts falling below 55450–55400, it may trigger a bearish move with downside targets at 55250, 55150, and 55050.
Further weakness can be seen if Bank Nifty breaks below 54950, leading to extended targets of 54750, 54650, and 54550.
On the other side, if Bank Nifty reclaims and sustains above 55050–55100, fresh buying can be considered with potential upside toward 55250, 55350, and 55450+.

[INTRADAY] #BANKNIFTY PE & CE Levels(27/05/2025)Today, Bank Nifty is expected to open flat near the 55550 level. If it sustains above 55550, we may see further bullish momentum with upside targets of 55750, 55850, and 55950+. This breakout level may trigger strong buying interest.
On the downside, if Bank Nifty fails to hold above 55550 and drops below the 55460–55400 zone, then a bearish move may be seen toward 55250, 55150, and 55050 levels.
If it slips further below 55100, another buying opportunity may come near the 55050–55100 zone for a possible bounce targeting 55250, 55350, and 55450+.
