04 OCT 2023 BANKNIFTY SUPPORT AND RESISTANCE LEVELS
Hello Guys,
Good Morning everyone,
According to the data today market is going to open Gap-Down
After A Gap-Down opening if Banknifty sustain Above 44500 and taking Support from 44500 then open target for T1-44700,T2-44800,T3-45000
If the Banknifty Gap-Down opening sustain Below 44200 and taking resistance below 44200 then the open Targets for T1-44000,T2-43800,T3-43600
Major Levels 44200,44500,44000
If the market stande in this area of 44400 to 44200, then it is possible that even today the market will remain in the range.
Bankniftyview
Banknifty Selling side correctionBanknifty Selling side correction as per gann theory i mentioned market will touch the target 2 by tomorrow 10am range on 12th sep 2023

BANKNIFTY levels for 3rd October Here are the support and resistance levels for tomorrow. Market is flat to bulliish mood.

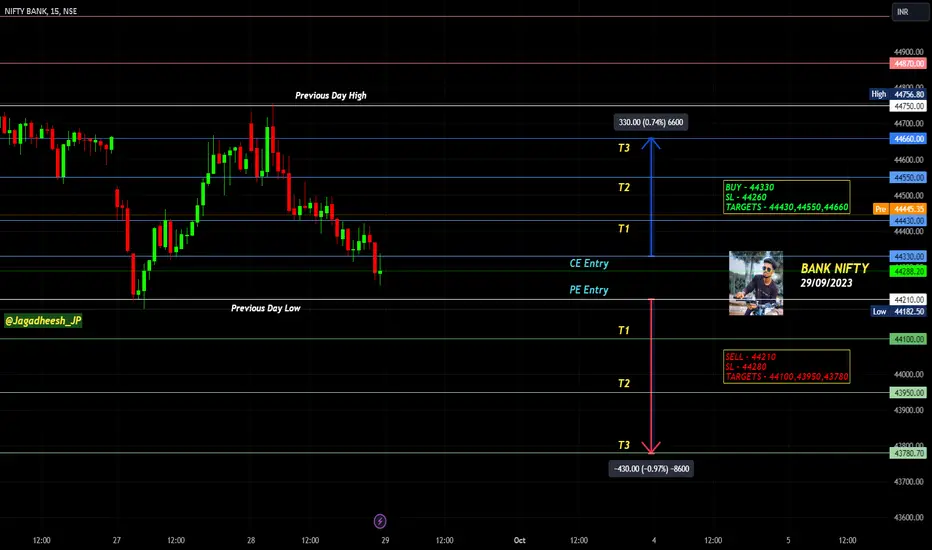
BANK NIFTY INTRADAY LEVELS FOR - 29/09/2023BUY ABOVE - 44330
SL - 44260
TARGETS - 44430,44550,44660
SELL BELOW - 44210
SL - 44280
TARGETS - 44100,43950,43780
NO TRADE ZONE - 44210 to 44430
Previous Day High - 44750
Previous Day Low - 44210
I am sharing BANK NIFTY levels this levels acts as important support & resistance for intraday. if you want to trade with this levels wait for 15 min Candle closing above that levels. You can trade with breakout and reversal both.
In this channel, I share my expertise in trading strategies, technical analysis, and market trends to help you make informed decisions in your trading ventures.
Stay tuned for daily updates, in-depth market analyses, and real-time trading scenarios to witness firsthand how we transform from Zero to Hero in the trading world. My Only aim is to empower you with the knowledge and skills necessary to navigate the complexities of the financial markets successfully.
Based on price action major support & resistance's are here, the red lines acts as resistances, the green lines acts as supports. If the price breaks the support/resistance, it will move to the next support/resistance line. White lines indicates previous day high & low, high acts as a resistance & low acts as a support for next day.
Trendlines are also significant to price action. If the price is above/below the trendlines, can expect an UP/DOWN with aggressive move.
Please NOTE: this levels are for intraday trading only.
Disclaimer - All information on this page is for educational purposes only,
we are not SEBI Registered, Please consult a SEBI registered financial advisor for your financial matters before investing And taking any decision. We are not responsible for any profit/loss you made.
Request your support and engagement by liking and commenting & follow to provide encouragement
HAPPY TRADING 👍
[INTRADAY] #BANKNIFTY PE & CE Levels(29/09/2023) Today will be gap up opening in BANKNIFTY . After opening if banknifty sustain above 44550 level then possible upside rally of 400-500 points upto 44950 Level. Any Major downside only expected in case banknifty starts trading below 44450 level. also possible Reversal Upside 44050 level.

BANKNIFTY--Chance of Double Bottom??The Bank nifty index,
44200 is a strong Support ... In the previous Session ,
After a Bearish Gap + Strong fall = indicating an exhaustion of sellers...
Buyers immediately taken the price towards 44800 levels is happened yesterday..
Today price again tested the same zone again.
If this is an exhaustion of sellers and initiation of buyers.. tomorrow it will form a double bottom and the price is continue its momentum towards upside.
If we observe bottom side.. we have a strong a support lies at 43800 levels...
Before testing this levels will this gives us some retracement or it will continue to move upside.
Will see what happens in the next session...

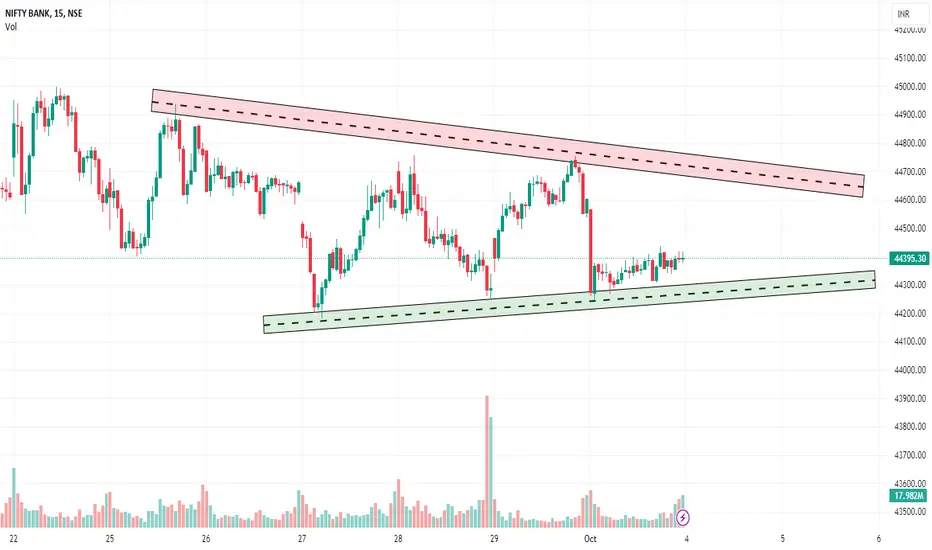
BANKNIFTY--@Trendline Break??The Bank nifty index is near its trendline...
If price breaks and retest will go for buying...
wait for the price to break of the trendline...
or it may continue to move in the bearish channel...
if price breaks the trendline and failed to take the help of it to move upside...will go for short side...
Keep safe....

28 SEPT 2023 BANKNIFTY SUPPORT AND RESISTANCE LEVELSHello Guys,
Good Morning everyone,
According to the data today market is going to open Flat
After A Flat opening if Banknifty sustain Above 44600 and taking Support from 44600 then open target for T1-44700,T2-44800,T3-45000
If the Banknifty Flat opening sustain Below 44500 and taking resistance below 44500 then the open Targets for T1-44300,T2-44200,T3-44000
Major Levels 44600,45800,44500
If the market stande in this area of 44400 to 44600, then it is possible that even today the market will remain in the range.

BANK NIFTY- Target Levels-THUR-28.09.23Bank Nifty Spot Price : 44588.3 - VIX SPOT Price : 11.58. -
Nifty Daily Range : 44318 To - 44859- Watch Option Strike : 44500 CE
Watch The Option Target Levels : 182----202-----253-----303----354---404---455----506----556----607--+++++++
I Am Not Sebi Registered Analysis, This Is Education Purpose Only.
Dear Followers.. Trend Is Our Friend..
1. Draw The Lines In Your Trading View.. Then Only You Understand My Statistical Startegy.
2. Kindly Watch My Break Even Point. Every Day..
3. Above The Break Even Point.. Resistance Break.. UPTREND Starts.. Buy CE..
4. Below The Break Even Point.. Support Break.. DOWNTREND Starts.. Buy PE..
5. After Retracement.... Stop Loss is Above Or Below Break Even Point..
6. Stop Loss Is Must..
7. Watch 5 Mins Time Frame.. & 15 Mins Time Frame..
8. In Future i Analysis & Focus On Option Strike - Entry, Target, Stop Loss. Also..
Don"t Enter Blindly.
1. We Focus On Our Daily Analysis..
2. Combination Theory Of Delta, Gamma & Thetta,.
3. Selection Of OI Analysis & Prediction Of Entry, Targets, & Stop Loss..
4. We See 4 Types Of Fibinacci Retracement Levels..
(1.High To Low Fib Level, 2.Low To High Fib Level, 3.Long Fib Level & 4. Short Fib Level),
5. Techninal View On Break Even Point..
6. Wait For Support Breaking or Resistance Breaking.. That Time Watch The Market Carefully..
7. Market Moves in UpTrend or DownTrend..
8. Kindly Watch Both The Nifty Target Levels & Bank Nifty Target Levels in your Trading View..
Its Most Important For Daily Tradings..
Kindly Follow My Channel & Like Your Support in My Idea.
BY : newsbharathi27040 / market1tomorrow

#BANKNIFTY INTRADAY TRADE SETUPGreetings Folks,
today i have prepared a setup of BANKNIFTY
the setup is as follows
- the main setup was in 5 min timeframe but i cant share it because of some restrictions
- the price is facing a static resistance which can flip off to become the next support
- price is trying to break out of the bearish structure
dont play with fire, always use a predefined stoploss

BANKNIFTY--Bearish gap @45400??I am sharing the important levels of Support and Resistance. These levels play a crucial role in trading decisions, as they act as reliable markers of price movements.
------>>Support levels are price points where an asset tends to find buying interest, preventing it from falling further.
---->Resistance levels, on the other hand, are points where selling pressure typically prevents the asset from rising higher.
Take a look at these levels and trade accordingly. Recognizing and respecting these support and resistance levels can help traders make informed decisions and manage risk effectively. They serve as key reference points for technical analysis and are vital tools in successful trading strategies.
Trade safe...Thank you guys for your support.

BANK NIFTY INTRADAY LEVELS FOR 25/09/2023BUY ABOVE - 44790
SL - 44660
TARGETS - 45000,45270,45470
SELL BELOW - 44600
SL - 44680
TARGETS - 44420,44250,44100
NO TRADE ZONE - 45600 to 45790
Previous Day High - 45000
Previous Day Low - 44600
I am sharing BANK NIFTY levels this levels acts as important support & resistance for intraday. if you want to trade with this levels wait for 15 min Candle closing above that levels. You can trade with breakout and reversal both.
In this channel, I share my expertise in trading strategies, technical analysis, and market trends to help you make informed decisions in your trading ventures.
Stay tuned for daily updates, in-depth market analyses, and real-time trading scenarios to witness firsthand how we transform from Zero to Hero in the trading world. My Only aim is to empower you with the knowledge and skills necessary to navigate the complexities of the financial markets successfully.
Based on price action major support & resistance's are here, the red lines acts as resistances, the green lines acts as supports. If the price breaks the support/resistance, it will move to the next support/resistance line. White lines indicates previous day high & low, high acts as a resistance & low acts as a support for next day.
Trendlines are also significant to price action. If the price is above/below the trendlines, can expect an UP/DOWN with aggressive move.
Please NOTE: this levels are for intraday trading only.
Disclaimer - All information on this page is for educational purposes only,
we are not SEBI Registered, Please consult a SEBI registered financial advisor for your financial matters before investing And taking any decision. We are not responsible for any profit/loss you made.
Request your support and engagement by liking and commenting & follow to provide encouragement
HAPPY TRADING 👍

BANKNIFTY-- 45100 Is Support or Resistance??A strong fall is observed from the previous strong resistance level @45100 level.
Previously while breaking the strong level of resistance, price broken the resistance with
strong bullish momentum @44400 levels...
price is now again at these levels...
if tomorrow price takes the help of this support zone, price will again takes u turn to upside...
While going on top side, observe the reaction at 45100-45200 levels, may again have a chance of push it down.so be careful at this level …
if price breaks this level, we can keep on buyside, we are left with bearish gaps....price fills these bearish gaps and continue to move upside with pullbacks...
so careful before short side...
If price facing resistance again at 45100, price falls back. If not price is bullish again.
Keep safe....

Banknifty Setup towards the Sellside LiquidityBanknifty Sellside setup on a 15 min time frame with the order flow using premium and discount

25 SEPT 2023 BANKNIFTY SUPPORT AND RESISTANCE LEVELSHello Guys,
Good Morning everyone,
According to the data today market is going to open Falt
After A Flat opening if Banknifty sustain Above 44800 and taking Support from 44800 then open target for T1-44900,T2-45000,T3-45200
If the Banknifty Flat opening sustain Below 44600 and taking resistance below 44600 then the open Targets for T1-44500,T2-44400,T3-44200
Major Levels 44600,45800,44500
If the market stande in this area of 44800 to 44600, then it is possible that even today the market will remain in the range.

Nifty and Bank Nifty Market Commentary plus Importance of timeUpcoming market moves for the Nifty and Bank Nifty along with learning the concept and Importance of time before price. So We always have to Consider Time as the first element of trading then we have to look for the trading setups

BANKNIFTY--Bullish Gap or Bearish Gap??I am sharing the important levels of Support and Resistance. These levels play a crucial role in trading decisions, as they act as reliable markers of price movements.
------>>Support levels are price points where an asset tends to find buying interest, preventing it from falling further.
---->Resistance levels, on the other hand, are points where selling pressure typically prevents the asset from rising higher.
Take a look at these levels and trade accordingly. Recognizing and respecting these support and resistance levels can help traders make informed decisions and manage risk effectively. They serve as key reference points for technical analysis and are vital tools in successful trading strategies.
Trade safe...Thank you guys for your support.

BANKNIFTY--Strong Resistance @ATH??Following a strong bullish trend, the price exhibits a sign of indecision in the form of consolidation. Subsequently, it makes an attempt to breach the previous all-time high (ATH) but failed and falls below it.
Notably, the price experiences multiple rejections around the 46300 levels , highlighting potential resistance in that zone.
Conversely, there's a strong bullish sentiment evident around the 45300 levels.
However, should the price fail to regain upward momentum from this point @45300, it could potentially dip below the significant previous resistance at 45100 levels. This scenario could pave the way for further declines in Bank nifty.
Hence, it's advisable to be cautious around the 45100 levels.
Keep safe....

BANK NIFTY INTRADAY LEVELS FOR 20/09/2023BUY ABOVE - 46150
SL - 46030
TARGETS - 46300,46430,46550
SELL BELOW - 45940
SL - 46030
TARGETS - 45820,45630,45470
NO TRADE ZONE - 45820 to 46030
Previous Day High - 45940
Previous Day Low - 46150
I am sharing BANK NIFTY levels this levels acts as important support & resistance for intraday. if you want to trade with this levels wait for 15 min Candle closing above that levels. You can trade with breakout and reversal both.
In this channel, I share my expertise in trading strategies, technical analysis, and market trends to help you make informed decisions in your trading ventures.
Stay tuned for daily updates, in-depth market analyses, and real-time trading scenarios to witness firsthand how we transform from Zero to Hero in the trading world. My Only aim is to empower you with the knowledge and skills necessary to navigate the complexities of the financial markets successfully.
Based on price action major support & resistance's are here, the red lines acts as resistances, the green lines acts as supports. If the price breaks the support/resistance, it will move to the next support/resistance line. White lines indicates previous day high & low, high acts as a resistance & low acts as a support for next day.
Trendlines are also significant to price action. If the price is above/below the trendlines, can expect an UP/DOWN with aggressive move.
Please NOTE: this levels are for intraday trading only.
Disclaimer - All information on this page is for educational purposes only,
we are not SEBI Registered, Please consult a SEBI registered financial advisor for your financial matters before investing And taking any decision. We are not responsible for any profit/loss you made.
Request your support and engagement by liking and commenting & follow to provide encouragement
HAPPY TRADING 👍

BANK NIFTY - Target Levels - 18.09.2023BANK Nifty Spot : 46154.05. Option Strike : 46100 CE & 46100 PE
I Am Not Sebi Registered Analysis, This Is Education Purpose Only.
Dear Followers..
Kindly Watch My Break Even Point. Every Day.
Above The Break Even Point.. Resistance Break.. UPTREND Starts.. Buy CE..
Below The Break Even Point.. Support Break.. DOWNTREND Starts.. Buy PE..
Don"t Enter Blindly.
We Focus On Our Daily Analysis..
Combination Theory Of Delta, Gamma & Thetta,.
Selection Of OI Analysis & Prediction Of Entry, StopLoss, & Targets,
Fibinacci Retracement Levels, Techninal View On Break Even Point.
Wait For Support or Resistance Breaking.. That Time Watch The Market Carefully.
Market Moves in UpTrend or DownTrend.
Kindly Watch Both The Nifty Target Levels & Bank Nifty Target Levels in your Trading View.
Its Most Important For Daily Tradings….
BY : newsbharathi27040.


18 SEPT 2023 BANKNIFTY SUPPORT AND RESISTANCE LEVELSHello Guys,
Good Morning everyone,
According to the data today market is going to open Gap-Down
After A Gap-Down opening if Banknifty sustain Above 45800 and taking Support from 46000 then open target for T1-46200,T2-46300,T3-46500
If the Banknifty Gap-Down opening sustain Below 45800 and taking resistance below 45800 then the open Targets for T1-45600,T2-45500,T3-45300
Major Levels 45800,46000,46100
If the market stande in this area of 45800 to 46000, then it is possible that even today the market will remain in the range.

BANKNIFTY--Case1 or Case2 ??I am sharing the important levels of Support and Resistance. These levels play a crucial role in trading decisions, as they act as reliable markers of price movements.
------>>Support levels are price points where an asset tends to find buying interest, preventing it from falling further.
---->Resistance levels, on the other hand, are points where selling pressure typically prevents the asset from rising higher.
Take a look at these levels and trade accordingly. Recognizing and respecting these support and resistance levels can help traders make informed decisions and manage risk effectively. They serve as key reference points for technical analysis and are vital tools in successful trading strategies.
Case 1::
Drop base drop formation
Case 2::
Consolidation + Manipulation = Distribution
Previous resistance at 45600 level may acts as support...
It is recommended to buy at 45600 levels...look for sell at ATH.
Trade safe...Thank you guys for your support.
