BANKNIFTY--Retracement or Fall ??Price broken the strong demand zone by opening gapdown,
and starts consolidation immediately...at the end it tested the demand again.
price exactly closed by testing the demand zone, if price wants to fall continuously, tomorrow again it opens down and fall to below levels.
if price wants to give some retracement, it will again test the previous ATH level...
where previously strong fall happens....
If tomorrow price opens below levels, will look for long in this place...
previously multiple times price got rejected from this level.
may acts as support....keep track this levels....
Today we will not get any entries on any side...it is in consolidation range, till the end.
will see in the next session what happens.
Bankniftyview

banknifty pre market analysis31JULY ANALYSIS:
Daily analysis:
Banknifty
side: sell if it breaks down (PS-100%)
gapup: buy only when market breaks above 46070 after some consolidation(50%)
gapdown: if gives breakout, then we can sell (PS100%)
on big gapdown we will trade on price-action in small qty

BANKNIFTY--Which Breaks Demand or ATH ??Today's observations::
Price rapidly falls from the 46300 levels.
Price may again test the ATH, so don't go for short immediately.
based on the opening will again look for buy or short.
Key level to watch is previous ATH, that is the level that can push price up or lower.
On bottom side,
Price is again taken the support from demand zone...until demand breaks no Short again...
fake breakdown may also happen at demand zone careful here...
this is a strong area of value and demand zone.. that can't break easily....
will see what happens in the next session.

28 JULY 2023 EXPIRY DAY BANKNIFTY SUPPORT AND RESISTANCE LEVELSHello Guys,
Good Morning everyone,
According to the data today market is going to open Gap-Up
After A Gap-Up opening if Banknifty sustain Above 46000 and taking Support from 46000 then open target for T1-46200,T2-46300,T3-46500
If the Banknifty Gap-Up opening sustain Below 45700 and taking resistance below 45700 then the open Targets for T1-45600,T2-45500,T3-45400
Major Levels 46000,46200,45800
If the market stande in this area of 46000 to 45800, then it is possible that even today the market will remain in the range.

BANK NIFTY INTRADAY LEVELS FOR 27/07/2023RISING WEDGE PATTERN
BUY ABOVE - 46100
SL - 45940
TARGETS - 46240,46370,46600
SELL BELOW - 456940
SL - 46100
TARGETS - 45800,45640,45460
I am sharing BANK NIFTY levels this levels acts as important support & resistance for intraday. if you want to trade with this levels wait for 15 min Candle closing above that levels. You can trade with breakout and reversal both.
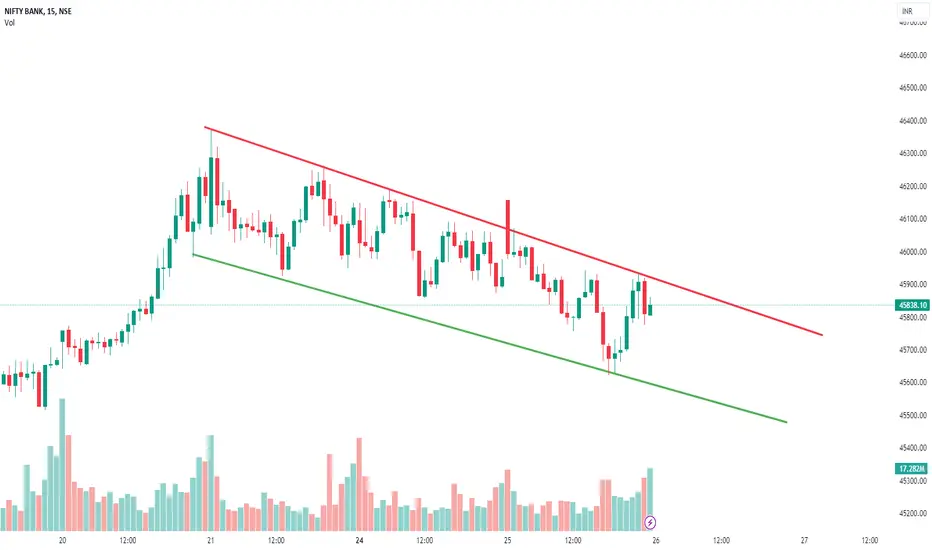
Based on price action major support & resistance's are here, the red lines acts as resistances, the green lines acts as supports. If the price breaks the support/resistance, it will move to the next support/resistance line. White lines indicates previous day high & low, high acts as a resistance & low acts as a support for next day.
Trendlines are also significant to price action. If the price is above/below the trendlines, can expect an UP/DOWN with aggressive move.
Please NOTE: this levels are for intraday trading only.
Disclaimer - All information on this page is for educational purposes only,
we are not SEBI Registered, Please consult a SEBI registered financial advisor for your financial matters before investing And taking any decision. We are not responsible for any profit/loss you made.
Request your support and engagement by liking and commenting & follow to provide encouragement
HAPPY TRADING 👍

BANKNIFTY-- @Triangle Breakout Level??If we look at the chart price breaking the trendline and moving super bullish...
after breaking the trendline price moving like a rocket.
Today after breaking the trendline price is not moving much points....
it's slowly moving to the upside..
Case 1::
What happens if price not able to move upside::
If tomorrow price opens gap up and it has to move upside, if its bullish again.
Case2 :: If price opens gap down its clearly indicating bearish sign.
sellers will immediately take the price downwards...so no more bullishness in the market.
consider end of bullishness.
If tomorrow price falls below the trendline again...
we will wait for the perfect place to enter for short again.
by keeping the stop loss above the previous strong fall high.
targets up to the Demand and bullish gap point only.
If price breaks the 45600 level,
we will notice a strong fall happens up to 45200 area where there is more liquidity, to eliminate all the buy orders.
After a strong fall from the area 46100 level, today again price comes back to the same level..
To test the supply zone price is moving in a bullish channel...
so until price breaks this and retest will not go for short side....
Note ::
some times price opens up or down and fills the gap and continue fall or rise again...so be cautious in such cases.
will see what happens in the next session.
Disclaimer - All information on this page is for educational purposes only,
we are not SEBI Registered.

[INTRADAY] #BANKNIFTY PE & CE Levels(27/07/2023) Today will be gap up opening in BANKNIFTY . After opening if banknifty sustain above 46050 level then possible upside rally of 400-500 points upto 46450 Level. And this rally can extend for another 400 points if it gives breakout of 46550 level. Any Major downside only expected in case banknifty starts trading below 45950 level.also possible Reversal Downside 46450 level.

27 JULY 2023 EXPIRY DAY BANKNIFTY SUPPORT AND RESISTANCE LEVELSHello Guys,
Good Morning everyone,
According to the data today market is going to open Gap-Up
After A Gap-Up opening if Banknifty sustain Above 46300 and taking Support from 46300 then open target for T1-46500,T2-46700,T3-46800
If the Banknifty Gap-Up opening sustain Below 46000 and taking resistance below 46000 then the open Targets for T1-45800,T2-45600,T3-45500
Major Levels 46000,46200,46300
If the market stande in this area of 46000 to 46300, then it is possible that even today the market will remain in the range.

BANKNIFTY--Trendline Breaks ??Price opens gap up above the trendline, and failed to take the help of trendline.
sellers are aggressively taken the price towards demand zone.
Reached our targets on bottom side up to demand zone.
now interesting point is,
price exactly closed at the previous supply zone, where previously a strong sell off is observed.
If price wants to go downside, this is the place to take it downside...as already discussed earlier.
we will go for buying only if trendline acts as support, we will initiate a long entry...
if demand breaks and gives us pullback will enter on short side, with small stop loss.
In smaller time frame, price broken the trendline and closed below it.
will see what happens tomorrow in live.

BANK NIFTY INTRADAY LEVELS FOR 26/07/2023Price moving in between The PARALLEL CHANNEL
BUY ABOVE - 45940
SL - 45770
TARGETS - 46160,46370,46600
SELL BELOW - 45640
SL - 45780
TARGETS - 45460,45290,45100
I am sharing BANK NIFTY levels this levels acts as important support & resistance for intraday. if you want to trade with this levels wait for 15 min Candle closing above that levels. You can trade with breakout and reversal both.
Please Note this levels are for intraday trading only.
Disclaimer - All information on this page is for educational purposes only,
we are not SEBI Registered, Please consult a SEBI registered financial advisor for your financial matters before investing And taking any decision. We are not responsible for any profit/loss you made.
Request your support and engagement by liking and commenting & follow to provide encouragement
HAPPY TRADING 👍

banknifty pre market analysis26JULY ANALYSIS:
Daily analysis:
Banknifty
side: if gives breakdown 45750, then sell(50%PS)
gapup: buy only when market breaks above 46170 after some consolidation(50% morning, 70% evening)
gapdown: if gives breakout, then we can sell (PS50%)
- on big gapdown we will buy if market makes 5 min bullish candle

26 JULY 2023 EXPIRY DAY BANKNIFTY SUPPORT AND RESISTANCE LEVELS
Hello Guys,
Good Morning everyone,
According to the data today market is going to open Gap-Up
After A Gap-Up opening if Banknifty sustain Above 46000 and taking Support from 46000 then open target for T1-46200,T2-46300,T3-46500
If the Banknifty Gap-Up opening sustain Below 45600 and taking resistance below 45600 then the open Targets for T1-45400,T2-45300,T3-45100
Major Levels 46000,45800,45500
If the market stande in this area of 45500 to 45800, then it is possible that even today the market will remain in the range.
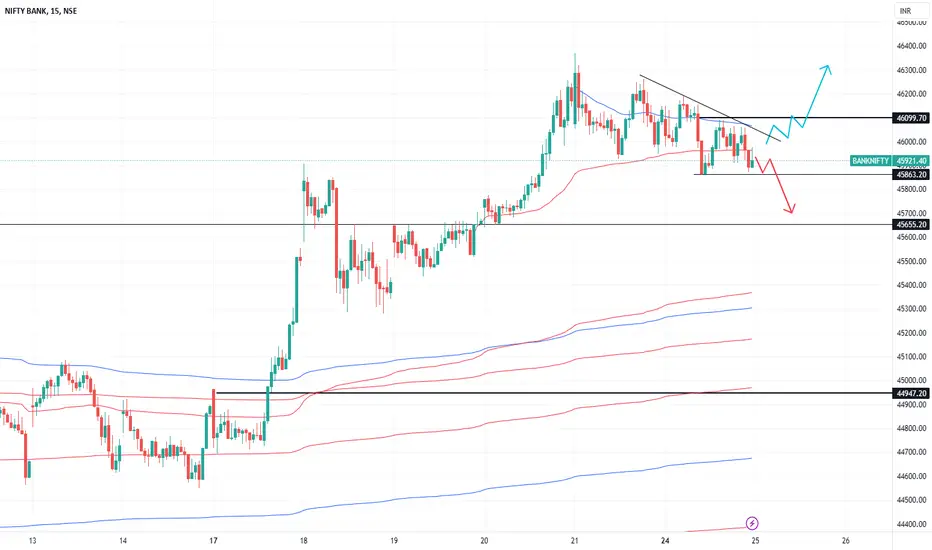
Bullish flag pattern Reversal in BANKNIFTYBANKNIFTY
Key highlights: 💡⚡
📈On 15 Minutes Time Frame Stock Showing Reversal of Bullish Flag Pattern .
📈 It can give movement upto the Reversal Final target of above 45955+.
📈There have chances of breakout of Resistance level too.
📈 After breakout of Resistance level this stock can gives strong upside rally upto above 46950+.
📈 Can Go short in this stock by placing a stop loss below 45610-.

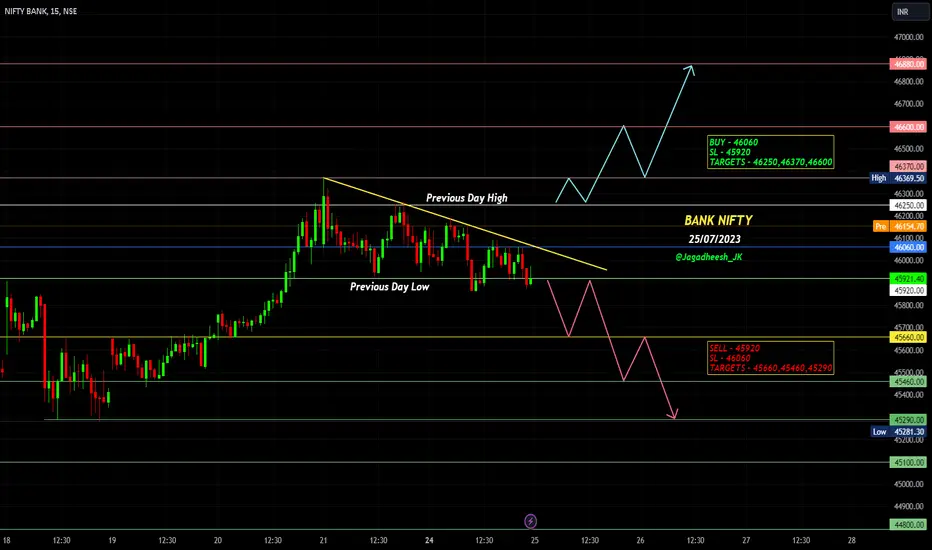
BANK NIFTY INTRADAY LEVELS FOR 25/07/2023BUY ABOVE - 46060
SL - 45920
TARGETS - 46250,46370,46600
SELL BELOW - 45920
SL - 46060
TARGETS - 45660,45460,45290
I am sharing BANK NIFTY levels this levels acts as important support & resistance for intraday. if you want to trade with this levels wait for 15 min Candle closing above that levels. You can trade with breakout and reversal both.
Please Note this levels are for intraday trading only.
Disclaimer - All information on this page is for educational purposes only,
we are not SEBI Registered, Please consult a SEBI registered financial advisor for your financial matters before investing And taking any decision. We are not responsible for any profit/loss you made.
Request your support and engagement by liking and commenting & follow to provide encouragement
HAPPY TRADING 👍
BANKNIFTY--Breakout or Breakdown??Price is continuously rejected to the upside from 45900 zone....
but failed to move upside...
if price breaks and retest will go for upside...
if price breaks below,45900 level, we will look for buy side in the demand zone @45600 level..
tomorrow also price mostly in a range...if falls below 45900.
bottom demand pushes the price up...multiple rejection area will pushes the price down..
we have a bullish gap left behind the demand zone...keep an eye on these levels.
until price breaks these we cannot say anything further momentum.
so tomorrow mostly price is in consolidation...between the demand and HH, if falls below 45900
If price breaks the trendline and gives us retest will go for buying...up to the ATH Level.
will see what happens tomorrow...in live market.

25 JULY 2023 EXPIRY DAY BANKNIFTY SUPPORT AND RESISTANCE LEVELSHello Guys,
Good Morning everyone,
According to the data today market is going to open Gap-Up
After A Gap-Up opening if Banknifty sustain Above 46200 and taking Support from 46200 then open target for T1-46300,T2-46500,T3-46600
If the Banknifty Gap-Up opening sustain Below 45600 and taking resistance below 45600 then the open Targets for T1-45400,T2-45300,T3-45100
Major Levels 46000,46200,45500
If the market stande in this area of 45600 to 46200, then it is possible that even today the market will remain in the range.

banknifty pre market analysis25JULY ANALYSIS:
Daily analysis:
Banknifty
side: if gives breakdown then sell(100%PS)
gapup: buy only when market breaks above 46120(50% morning, 70% evening)
gapdown: if gives breakout of 45900, then we can sell (PS100%)
BANKNIFTY--Plan A or Plan B ??Observations::
Today's Interesting point is price opens Gap down,
indicating that buyers are not interested to go beyond this level.
A strong bearish pressure is observed from the levels 46400.
price tested the HH, Previous HH, at 45900 levels, and price can't make a High again,
and a sign of strong bearishness is observed from 46200 levels..
we have a chance of Gap down on Monday,
and test the bottom side demand zone which is @45600 levels.
Plan A:
if price opens gap down and after testing the demand zone, price again breaks 46200 level,
if it wants to go up it has to take the help of previous ATH.
Because selling pressure from 46400 level, will again pushes the price down side and P.ATH is responsible for pushing the price upside.
Plan B::
After testing the demand zone, previous resistance acts,
again as resistance price falls again to bottom levels.
Now our key level is 45900-45800 is the only level, that can push the price up or down.
will see what happens on live market in the upcoming session.
Thank you for your support guys....Happy weekend.

banknifty pre market analysis24JULY ANALYSIS:
Daily analysis:
Banknifty
side: could consolidate for 1 more day, unless gives breakout upside after some consolidation
gapup: for gap up wait for price-action and then buy if market goes up after some consolidation (ps-50%)
gapdown: if gives breakout after some consolidation before 45900, then we can sell (PS50%)

[INTRADAY] #BANKNIFTY PE & CE Levels(24/07/2023) Today will be gap Down opening in BANKNIFTY . After opening if banknifty start trading below 45950 level then possible downside rally of 400-500 points upto 45550 Level. Any Major upside only expected in case banknifty starts trading Above 46050 level.

24 JULY 2023 EXPIRY DAY BANKNIFTY SUPPORT AND RESISTANCE LEVELSHello Guys,
Good Morning everyone,
According to the data today market is going to open Flat
After A Flat opening if Banknifty sustain Above 46200 and taking Support from 46200 then open target for T1-46300,T2-46500,T3-46600
If the Banknifty Flat opening sustain Below 45800 and taking resistance below 45800 then the open Targets for T1-45700,T2-45600,T3-45400
Major Levels 46000,46200,45800
If the market stande in this area of 45800 to 46200, then it is possible that even today the market will remain in the range.

BANK NIFTY INTRADAY LEVELS FOR 24/07/2023BUY ABOVE - 46250
SL - 46130
TARGETS - 46370,46600,46880
SELL BELOW - 46060
SL - 46180
TARGETS - 45920,45660,45460
I am sharing BANK NIFTY levels this levels acts as important support & resistance for intraday. if you want to trade with this levels wait for 15 min Candle closing above that levels. You can trade with breakout and reversal both.
Please Note this levels are for intraday trading only.
Disclaimer - All information on this page is for educational purposes only,
we are not SEBI Registered, Please consult a SEBI registered financial advisor for your financial matters before investing And taking any decision. We are not responsible for any profit/loss you made.
Request your support and engagement by liking and commenting & follow to provide encouragement
HAPPY TRADING 👍

BANKNIFTY--Continuation or Reversal ??Observations::
Today price broken the ATH again and showed a strong bullishness towards 46000....
Above ATH, we are going to mark the levels by using pivot point standard.
today it performed well above ATH.
So, on that basis i am giving the levels for tomorrow,
if we see on monthly pivots price broken the Resistance level R2 strongly.
price facing the resistance multiple times,and broken this level.
in monthly the next resistance is located at 46650 level.
Coming to weekly analysis, price broken the Resistance R4,at 46100 level....
and the next resistance is located at 46400 level.
Before continuation will it gives a pullback..or continue to move upwards.
on bottom side, a zone is formed combination of monthly resistance and weekly support.
if price again comes to this level, I am again looking for buyside...
if no chance will be on sell side to bottom levels.
All these are the pre and post market analysis, live market is entirely different. Will see what happens in live market.
