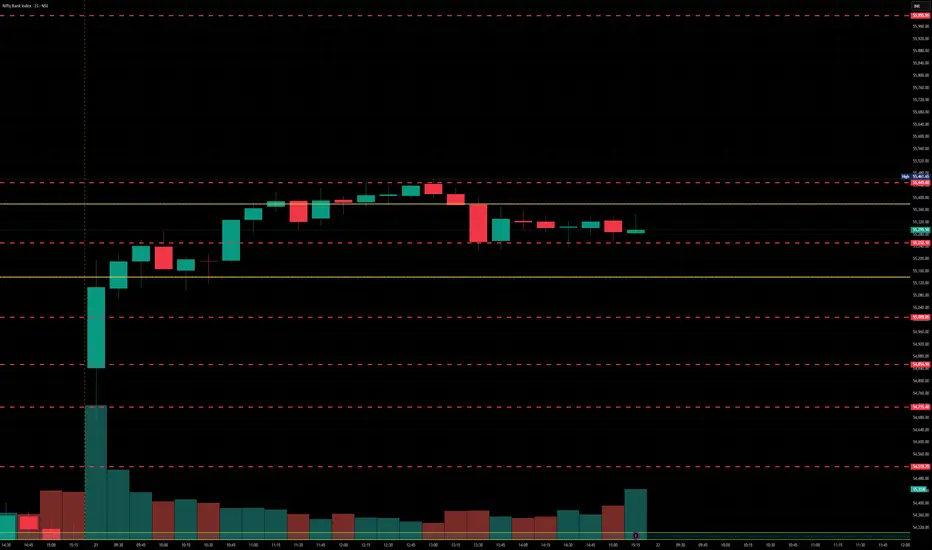
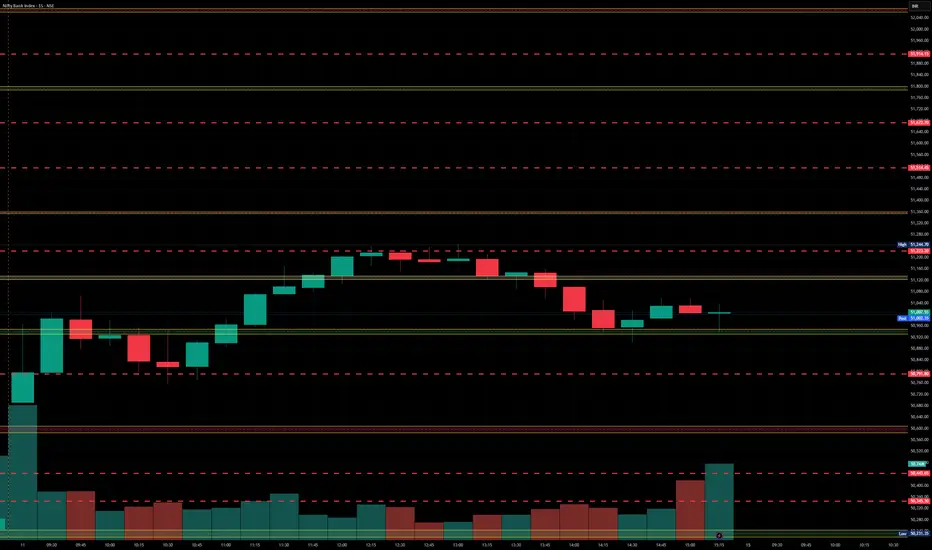
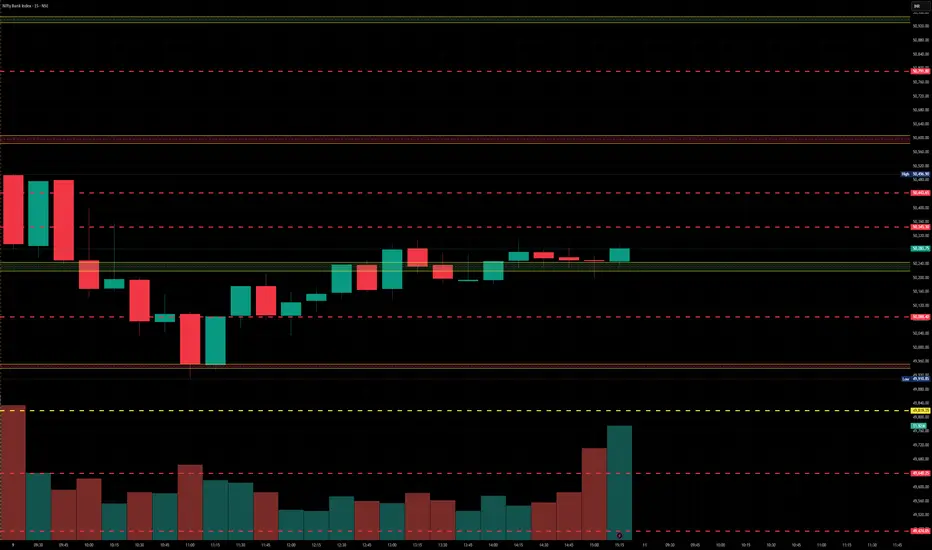
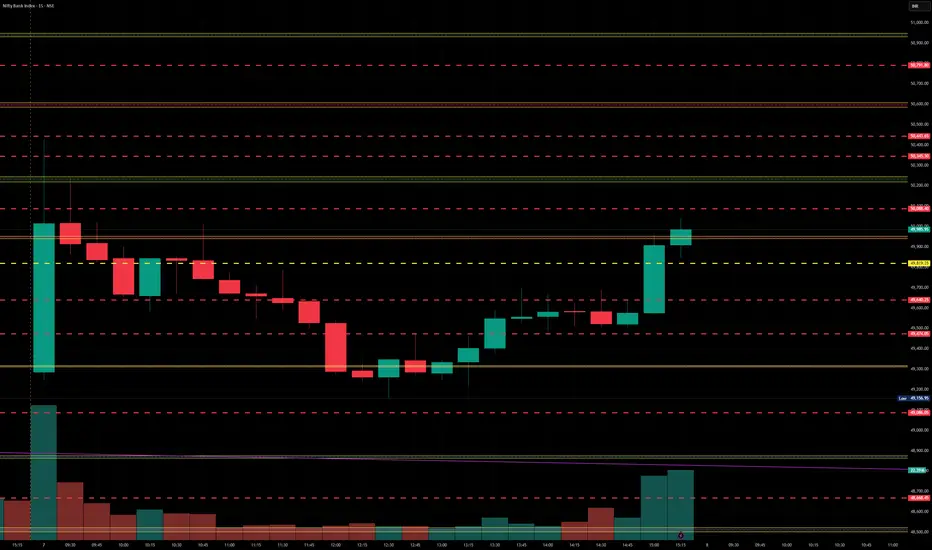
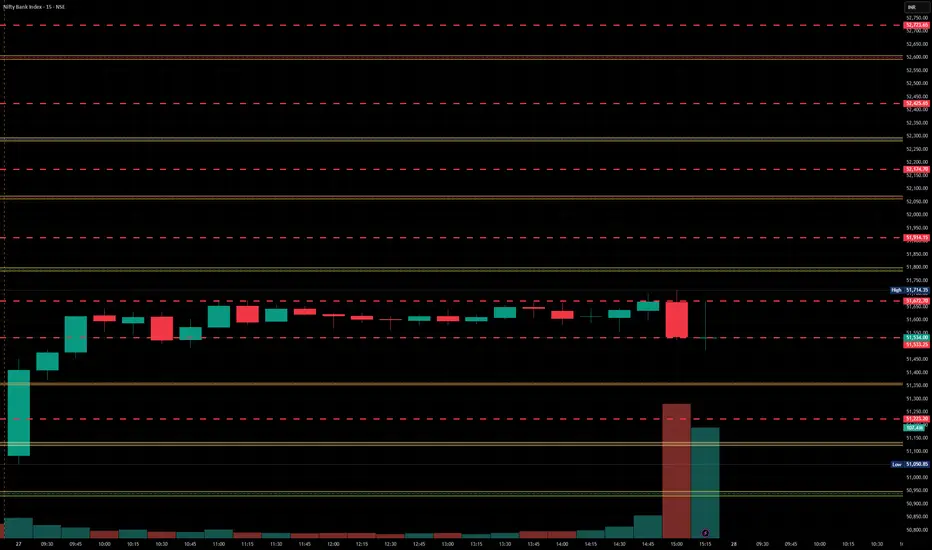
BankNifty levels - Apr 22, 2025Utilizing the support and resistance levels of BankNifty, along with the 5-minute timeframe candlesticks and VWAP, can enhance the precision of trade entries and exits on or near these levels. It is crucial to recognize that these levels are not static, and they undergo alterations as market dynamics evolve.
The dashed lines on the chart indicate the reaction levels, serving as additional points of significance. Furthermore, take note of the response at the levels of the High, Low, and Close values from the day prior.
We trust that this information proves valuable to you.
* If you found the idea appealing, kindly tap the Boost icon located below the chart. We encourage you to share your thoughts and comments regarding it.
Wishing you successful trading endeavors!
Bankniftyview
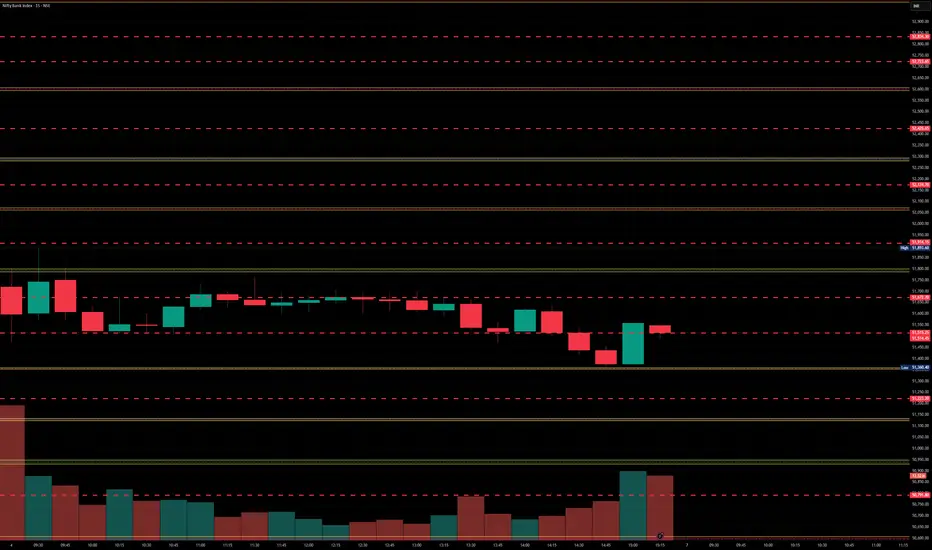
BankNifty levels - Apr 21, 2025Utilizing the support and resistance levels of BankNifty, along with the 5-minute timeframe candlesticks and VWAP, can enhance the precision of trade entries and exits on or near these levels. It is crucial to recognize that these levels are not static, and they undergo alterations as market dynamics evolve.
The dashed lines on the chart indicate the reaction levels, serving as additional points of significance. Furthermore, take note of the response at the levels of the High, Low, and Close values from the day prior.
We trust that this information proves valuable to you.
* If you found the idea appealing, kindly tap the Boost icon located below the chart. We encourage you to share your thoughts and comments regarding it.
Wishing you successful trading endeavors!

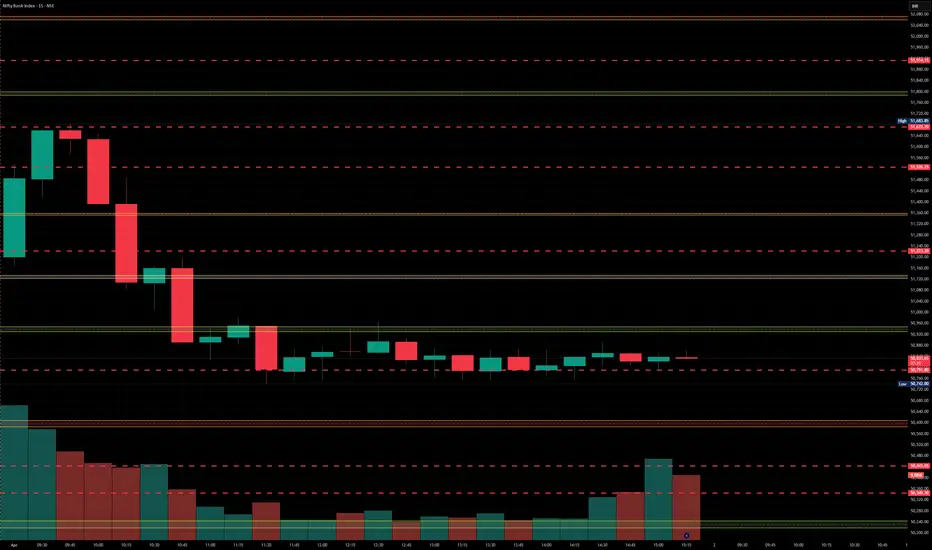
BankNifty levels - Apr 17, 2025Utilizing the support and resistance levels of BankNifty, along with the 5-minute timeframe candlesticks and VWAP, can enhance the precision of trade entries and exits on or near these levels. It is crucial to recognize that these levels are not static, and they undergo alterations as market dynamics evolve.
The dashed lines on the chart indicate the reaction levels, serving as additional points of significance. Furthermore, take note of the response at the levels of the High, Low, and Close values from the day prior.
We trust that this information proves valuable to you.
* If you found the idea appealing, kindly tap the Boost icon located below the chart. We encourage you to share your thoughts and comments regarding it.
Wishing you successful trading endeavors!

Banknifty levels - Apr 16, 2025Utilizing the support and resistance levels of BankNifty, along with the 5-minute timeframe candlesticks and VWAP, can enhance the precision of trade entries and exits on or near these levels. It is crucial to recognize that these levels are not static, and they undergo alterations as market dynamics evolve.
The dashed lines on the chart indicate the reaction levels, serving as additional points of significance. Furthermore, take note of the response at the levels of the High, Low, and Close values from the day prior.
We trust that this information proves valuable to you.
* If you found the idea appealing, kindly tap the Boost icon located below the chart. We encourage you to share your thoughts and comments regarding it.
Wishing you successful trading endeavors!

BankNifty levels - Apr 15, 2025Utilizing the support and resistance levels of BankNifty, along with the 5-minute timeframe candlesticks and VWAP, can enhance the precision of trade entries and exits on or near these levels. It is crucial to recognize that these levels are not static, and they undergo alterations as market dynamics evolve.
The dashed lines on the chart indicate the reaction levels, serving as additional points of significance. Furthermore, take note of the response at the levels of the High, Low, and Close values from the day prior.
We trust that this information proves valuable to you.
* If you found the idea appealing, kindly tap the Boost icon located below the chart. We encourage you to share your thoughts and comments regarding it.
Wishing you successful trading endeavors!
BankNifty levels - Apr 11, 2025Utilizing the support and resistance levels of BankNifty, along with the 5-minute timeframe candlesticks and VWAP, can enhance the precision of trade entries and exits on or near these levels. It is crucial to recognize that these levels are not static, and they undergo alterations as market dynamics evolve.
The dashed lines on the chart indicate the reaction levels, serving as additional points of significance. Furthermore, take note of the response at the levels of the High, Low, and Close values from the day prior.
We trust that this information proves valuable to you.
* If you found the idea appealing, kindly tap the Boost icon located below the chart. We encourage you to share your thoughts and comments regarding it.
Wishing you successful trading endeavors!
BankNifty levels - Apr 09, 2025Utilizing the support and resistance levels of BankNifty, along with the 5-minute timeframe candlesticks and VWAP, can enhance the precision of trade entries and exits on or near these levels. It is crucial to recognize that these levels are not static, and they undergo alterations as market dynamics evolve.
The dashed lines on the chart indicate the reaction levels, serving as additional points of significance. Furthermore, take note of the response at the levels of the High, Low, and Close values from the day prior.
We trust that this information proves valuable to you.
* If you found the idea appealing, kindly tap the Boost icon located below the chart. We encourage you to share your thoughts and comments regarding it.
Wishing you successful trading endeavors!

BankNifty levels - Apr 08, 2025Utilizing the support and resistance levels of BankNifty, along with the 5-minute timeframe candlesticks and VWAP, can enhance the precision of trade entries and exits on or near these levels. It is crucial to recognize that these levels are not static, and they undergo alterations as market dynamics evolve.
The dashed lines on the chart indicate the reaction levels, serving as additional points of significance. Furthermore, take note of the response at the levels of the High, Low, and Close values from the day prior.
We trust that this information proves valuable to you.
* If you found the idea appealing, kindly tap the Boost icon located below the chart. We encourage you to share your thoughts and comments regarding it.
Wishing you successful trading endeavors!
BankNifty levels - Apr 07, 2025Utilizing the support and resistance levels of BankNifty, along with the 5-minute timeframe candlesticks and VWAP, can enhance the precision of trade entries and exits on or near these levels. It is crucial to recognize that these levels are not static, and they undergo alterations as market dynamics evolve.
The dashed lines on the chart indicate the reaction levels, serving as additional points of significance. Furthermore, take note of the response at the levels of the High, Low, and Close values from the day prior.
We trust that this information proves valuable to you.
* If you found the idea appealing, kindly tap the Boost icon located below the chart. We encourage you to share your thoughts and comments regarding it.
Wishing you successful trading endeavors!
BankNifty levels - Apr 04, 2025Utilizing the support and resistance levels of BankNifty, along with the 5-minute timeframe candlesticks and VWAP, can enhance the precision of trade entries and exits on or near these levels. It is crucial to recognize that these levels are not static, and they undergo alterations as market dynamics evolve.
The dashed lines on the chart indicate the reaction levels, serving as additional points of significance. Furthermore, take note of the response at the levels of the High, Low, and Close values from the day prior.
We trust that this information proves valuable to you.
* If you found the idea appealing, kindly tap the Boost icon located below the chart. We encourage you to share your thoughts and comments regarding it.
Wishing you successful trading endeavors!

BankNifty levels - Apr 03, 2025Utilizing the support and resistance levels of BankNifty, along with the 5-minute timeframe candlesticks and VWAP, can enhance the precision of trade entries and exits on or near these levels. It is crucial to recognize that these levels are not static, and they undergo alterations as market dynamics evolve.
The dashed lines on the chart indicate the reaction levels, serving as additional points of significance. Furthermore, take note of the response at the levels of the High, Low, and Close values from the day prior.
We trust that this information proves valuable to you.
* If you found the idea appealing, kindly tap the Boost icon located below the chart. We encourage you to share your thoughts and comments regarding it.
Wishing you successful trading endeavors!

BANKNIFTY : Trading Levels and Plan for 31-Mar-2025📌 BANK NIFTY Trading Plan – 31-Mar-2025
📊 Market Overview:
Bank Nifty closed at 51,552, trading within a consolidation phase near the Opening Support/Resistance Zone (51,552 – 51,564). The price action at key levels will dictate the next move, so we need to be prepared for different opening scenarios.
This plan offers a structured approach to trading at key levels while maintaining a favorable risk-reward ratio.
🔼 Scenario 1: Gap-Up Opening (200+ points above 51,750)
A gap-up above 51,750 suggests bullish momentum, but sustainability above the resistance zone (51,848 - 52,129) is crucial for further upside. If price faces rejection, an intraday reversal is possible.
✅ Plan of Action:
If Bank Nifty sustains above 52,129, expect an up-move towards the next resistance at 52,335. A breakout above 52,335 could trigger a rally towards 52,500+.
If price faces rejection at 52,129 and reverses, expect a retracement towards 51,848 → 51,750. If it fails to hold 51,750, a deeper correction towards 51,552 is possible.
Avoid fresh longs inside 51,848 – 52,129, as this zone could act as a profit-booking area. Wait for a decisive breakout or rejection confirmation.
🎯 Pro Tip: If the gap-up is quickly filled within the first 15-30 minutes, it signals weak buying strength, increasing the probability of an intraday correction.
⚖ Scenario 2: Flat Opening (Within ±200 points, around 51,550)
A flat opening near 51,552 indicates indecision. The market will take direction after the first few candles, so breakouts or breakdowns from key levels should be watched.
✅ Plan of Action:
Upside case: If Bank Nifty breaks and sustains above 51,848, it may head towards 52,129 → 52,335. Observe price action near these resistance levels before entering fresh longs.
Downside case: If Bank Nifty breaks below 51,552, it could test 51,199 → 50,899. A breakdown below 50,899 will shift the trend bearish.
Sideways caution: If the market remains inside the No Trade Zone (51,564 – 51,848), avoid taking trades as volatility could trap both buyers and sellers.
🎯 Pro Tip: In a flat opening, wait for a clear 15-minute candle close above or below key levels before entering trades.
🔽 Scenario 3: Gap-Down Opening (200+ points below 51,350)
A gap-down below 51,350 could signal profit booking or fresh selling pressure. The critical factor will be whether buyers defend key support zones.
✅ Plan of Action:
If price sustains below 51,350, expect a decline towards 51,199 → 50,899. A breakdown below 50,899 may accelerate selling towards the Must Try Zone for Buyers (50,800 – 50,899).
If price finds support at 50,899 and rebounds, it may attempt a recovery towards 51,199 → 51,552. A strong close above 51,552 could shift momentum back to the bulls.
Be cautious of bear traps – If the market gaps down but quickly recovers, it could trigger short covering, leading to an upside reversal.
🎯 Pro Tip: If the gap-down occurs near a strong buyer’s support zone, wait for a bullish price action confirmation before entering long trades.
⚠️ Risk Management Tips for Options Traders
🔹 Avoid over-leveraging – Use proper position sizing to manage risk.
🔹 Theta Decay Awareness – If the market consolidates, option premiums will erode rapidly.
🔹 Use Spreads for Protection – Instead of naked options, use spreads to limit risk and improve probability.
🔹 Trade at Key Levels – Avoid impulsive trades; focus on defined support and resistance zones.
📌 Summary & Conclusion
📍 Key Levels to Watch:
🟥 Resistance: 52,129 → 52,335 → 52,500
🟧 No Trade Zone: 51,564 – 51,848
🟩 Support: 51,199 → 50,899 → 50,800
🔸 Bullish Bias: Above 52,129, targeting 52,335 – 52,500
🔸 Bearish Bias: Below 51,350, expecting a fall towards 51,199 – 50,899
🔸 Neutral/Choppy: Inside 51,564 – 51,848, avoid unnecessary trades
🎯 Final Advice:
Stick to the structured trading plan and execute only at key levels.
Avoid emotional trading—wait for confirmation before entering trades.
The first 15-30 minutes after market open will provide better clarity—observe price action before committing to a trade.
📢 Disclaimer
I am not a SEBI-registered analyst. This trading plan is for educational purposes only. Please conduct your own research or consult a financial advisor before making any trades.

BankNifty level - Apr 02, 2025Utilizing the support and resistance levels of BankNifty, along with the 5-minute timeframe candlesticks and VWAP, can enhance the precision of trade entries and exits on or near these levels. It is crucial to recognize that these levels are not static, and they undergo alterations as market dynamics evolve.
The dashed lines on the chart indicate the reaction levels, serving as additional points of significance. Furthermore, take note of the response at the levels of the High, Low, and Close values from the day prior.
We trust that this information proves valuable to you.
* If you found the idea appealing, kindly tap the Boost icon located below the chart. We encourage you to share your thoughts and comments regarding it.
Wishing you successful trading endeavors!
BankNifty levels - Apr 01, 2025Utilizing the support and resistance levels of BankNifty, along with the 5-minute timeframe candlesticks and VWAP, can enhance the precision of trade entries and exits on or near these levels. It is crucial to recognize that these levels are not static, and they undergo alterations as market dynamics evolve.
The dashed lines on the chart indicate the reaction levels, serving as additional points of significance. Furthermore, take note of the response at the levels of the High, Low, and Close values from the day prior.
We trust that this information proves valuable to you.
* If you found the idea appealing, kindly tap the Boost icon located below the chart. We encourage you to share your thoughts and comments regarding it.
Wishing you successful trading endeavors!
BANKNIFTY - Trading Levels and Plan for 28-Mar-2025📌 BANK NIFTY Trading Plan – 28-Mar-2025
📊 Market Overview:
Bank Nifty closed at 51,534, consolidating within a No Trade Zone after a sharp rally. The index is currently at a decision point, where price action at key levels will determine the next move.
This structured plan will help you trade effectively under different opening conditions.
🔼 Scenario 1: Gap-Up Opening (200+ points above 51,750)
A gap-up opening above 51,750 would place Bank Nifty near the Opening Resistance Zone (51,851). The key focus should be on whether the index sustains above resistance or faces rejection.
✅ Plan of Action:
If Bank Nifty sustains above 51,851, it could trigger a rally towards the Profit Booking Zone (52,185 – 52,335). A breakout above this level may extend gains to 52,500+.
If price faces rejection at 51,851 and reverses, it could lead to a pullback towards 51,593 → 51,534. Watch for support confirmation before taking any long positions.
Avoid aggressive longs inside 51,750 – 51,851, as this area could witness profit booking. Wait for a proper retest before entering trades.
🎯 Pro Tip: If the gap-up gets filled within 15 minutes, it signals weak buying strength and may lead to intraday correction.
⚖ Scenario 2: Flat Opening (Within ±200 points, around 51,534)
A flat opening suggests that market participants are waiting for confirmation before taking decisive action. In such cases, it's best to trade only at key breakout/breakdown levels.
✅ Plan of Action:
Upside case: If Bank Nifty breaks and sustains above 51,593, it could move towards 51,750 → 51,851. Observe the price action at these levels before deciding on further longs.
Downside case: If Bank Nifty breaks below 51,534, it could test 51,388. A breakdown below 51,388 may trigger selling towards 51,205.
Sideways caution: If the index trades between 51,534 – 51,593, it indicates a choppy market. Avoid trading inside this range unless there is a clear breakout.
🎯 Pro Tip: In a flat opening scenario, wait for at least one 15-minute candle close to confirm the direction before entering a trade.
🔽 Scenario 3: Gap-Down Opening (200+ points below 51,334)
A gap-down below 51,334 could indicate weakness and profit booking, bringing the index closer to key support zones. The next move depends on whether buyers defend these supports.
✅ Plan of Action:
If price sustains below 51,334, expect a decline towards 51,205. A breakdown below 51,205 could lead to a deeper correction towards the Buyer’s Support Zone (50,987 – 50,891).
If price rebounds from 51,205, it may attempt a recovery towards 51,388 → 51,534. A strong close above 51,534 could invalidate bearish sentiment.
Be cautious of bear traps – If price quickly recovers after a sharp gap-down, it may indicate short covering, leading to an upside reversal.
🎯 Pro Tip: If the gap-down occurs near a strong buyer’s support zone, look for signs of reversal before initiating new shorts.
⚠️ Risk Management Tips for Options Traders
🔹 Avoid over-leveraging – Stick to a fixed capital allocation per trade to reduce risk.
🔹 Theta Decay Awareness – If the market consolidates, option premiums will decay rapidly, impacting option buyers.
🔹 Use Spreads for Protection – Instead of naked options, use spreads to control risk.
🔹 Trade at Key Levels – Avoid random trades; enter only near strong support and resistance zones.
📌 Summary & Conclusion
📍 Key Levels to Watch:
🟥 Resistance: 51,851 → 52,185 → 52,335
🟧 No Trade Zone: 51,534 – 51,593
🟩 Support: 51,388 → 51,205 → 50,987
🔸 Bullish Bias: Above 51,851, targeting 52,185 – 52,335
🔸 Bearish Bias: Below 51,334, expecting a fall towards 51,205 – 50,987
🔸 Neutral/Choppy: Inside 51,534 – 51,593, avoid unnecessary trades
🎯 Final Advice:
Stick to the structured trading plan and execute only at key levels.
Avoid FOMO trades—wait for confirmation before entering.
The first 15-30 minutes after market open will give a clearer direction—observe price action before committing to a trade.
📢 Disclaimer
I am not a SEBI-registered analyst. This trading plan is for educational purposes only. Please conduct your own research or consult a financial advisor before making any trades.

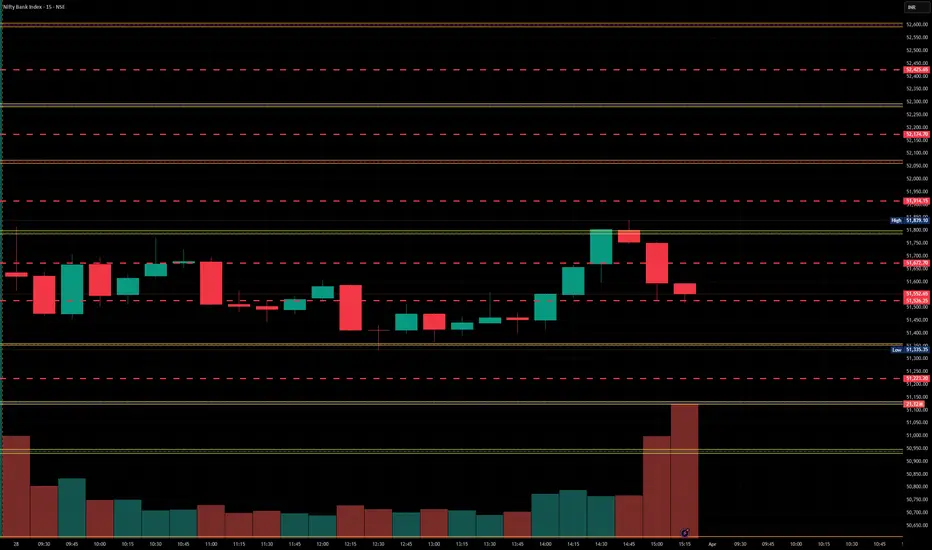
BankNifty levels - Mar 28, 2025Utilizing the support and resistance levels of BankNifty, along with the 5-minute timeframe candlesticks and VWAP, can enhance the precision of trade entries and exits on or near these levels. It is crucial to recognize that these levels are not static, and they undergo alterations as market dynamics evolve.
The dashed lines on the chart indicate the reaction levels, serving as additional points of significance. Furthermore, take note of the response at the levels of the High, Low, and Close values from the day prior.
We trust that this information proves valuable to you.
* If you found the idea appealing, kindly tap the Boost icon located below the chart. We encourage you to share your thoughts and comments regarding it.
Wishing you successful trading endeavors!
BANKNIFTY : Levels and Plan for 27-Mar-2025
📊 Current Market Status:
Bank Nifty closed at 51,180.70, showing a slight decline after testing resistance zones. The index is currently in a critical decision zone, where price action at key levels will determine the next directional move.
Let’s analyze the trading plan for different opening scenarios and set up a structured approach to trade safely.
🔼 Scenario 1: Gap-Up Opening (200+ points above 51,400)
If Bank Nifty opens above 51,400, it will directly test the Opening Resistance (51,424 – 51,564). This zone has previously acted as a supply area, so we need to see if bulls can sustain above it.
✅ Plan of Action:
If price sustains above 51,564, it can trigger further upside momentum towards 51,851 (Last Intraday Resistance). A breakout above 51,851 may lead to a sharp rally towards 52,100+ levels.
If price gets rejected at 51,564 and starts reversing, look for shorting opportunities, targeting 51,424 → 51,271 → 51,180.
Avoid aggressive long trades if price fluctuates within 51,424 – 51,564 (sideways resistance), as this could indicate a choppy range.
🎯 Pro Tip: If the gap-up is weak and starts filling within 15 minutes, expect a retracement towards the Opening Support (51,218 – 51,271) before making a trading decision.
⚖ Scenario 2: Flat Opening (Within ±200 points, around 51,180)
A flat opening suggests a balanced market, and Bank Nifty will need confirmation before picking a clear direction.
✅ Plan of Action:
Upside case: If Bank Nifty breaks above 51,424, we could see a move towards 51,564, where price action must be observed for further bullish strength.
Downside case: If price breaks below 51,218, expect a retest of the Opening Support Zone (50,904 – 51,218). A breakdown below this zone can trigger selling towards 50,522.
Neutral/Wait & Watch: If the index trades inside the No Trade Zone (50,904 – 51,218), avoid unnecessary trades.
🎯 Pro Tip: A flat opening often leads to fake breakouts in the first 15 minutes. Wait for a confirmed breakout with volume before entering.
🔽 Scenario 3: Gap-Down Opening (200+ points below 50,900)
If Bank Nifty opens below 50,900, it will enter a high-risk zone, with major support at 50,522 (Wave 4 Upper Band).
✅ Plan of Action:
If price sustains below 50,904, expect a test of 50,522. A further breakdown could lead to heavy selling towards 50,300 – 50,100 levels.
If price takes support at 50,522 and rebounds, look for a possible pullback trade, targeting 50,904 → 51,180.
Be cautious of bear traps—if price quickly reverses after a sharp gap-down, it might indicate a short-covering rally.
🎯 Pro Tip: In a gap-down scenario, avoid panic selling. Watch for reversals from key support levels before shorting further.
⚠️ Risk Management Tips for Options Traders
🔹 Avoid over-leveraging – Keep your position sizing in check to prevent excessive losses.
🔹 Theta Decay Awareness – If the market is consolidating, option premiums will decay rapidly.
🔹 Hedge Your Trades – Instead of naked options, use spreads to reduce risk.
🔹 Wait for Confirmation – Don't enter trades impulsively; wait for a breakout or breakdown retest.
📌 Summary & Conclusion
📍 Key Levels to Watch:
🟥 Resistance: 51,424 → 51,564 → 51,851 → 52,100
🟧 No Trade Zone: 50,904 – 51,218
🟦 Support: 50,904 → 50,522 → 50,300
🔸 Bullish Bias: Above 51,564 for targets of 51,851 – 52,100
🔸 Bearish Bias: Below 50,904 for a move towards 50,522 – 50,300
🔸 Neutral/Sideways: If price stays between 50,904 – 51,218, expect range-bound action.
🎯 Final Advice:
Stick to the plan, follow key levels, and don't chase trades.
Avoid trading inside No Trade Zones.
Let the market settle for 15-30 minutes before making aggressive moves.
📢 Disclaimer
I am not a SEBI-registered analyst. This trading plan is for educational purposes only. Please do your research or consult a financial advisor before making trading decisions.

BankNifty levels - Mar 27, 2025Utilizing the support and resistance levels of BankNifty, along with the 5-minute timeframe candlesticks and VWAP, can enhance the precision of trade entries and exits on or near these levels. It is crucial to recognize that these levels are not static, and they undergo alterations as market dynamics evolve.
The dashed lines on the chart indicate the reaction levels, serving as additional points of significance. Furthermore, take note of the response at the levels of the High, Low, and Close values from the day prior.
We trust that this information proves valuable to you.
* If you found the idea appealing, kindly tap the Boost icon located below the chart. We encourage you to share your thoughts and comments regarding it.
Wishing you successful trading endeavors!

BankNifty levels - Mar 26, 2025Utilizing the support and resistance levels of BankNifty, along with the 5-minute timeframe candlesticks and VWAP, can enhance the precision of trade entries and exits on or near these levels. It is crucial to recognize that these levels are not static, and they undergo alterations as market dynamics evolve.
The dashed lines on the chart indicate the reaction levels, serving as additional points of significance. Furthermore, take note of the response at the levels of the High, Low, and Close values from the day prior.
We trust that this information proves valuable to you.
* If you found the idea appealing, kindly tap the Boost icon located below the chart. We encourage you to share your thoughts and comments regarding it.
Wishing you successful trading endeavors!

BANKNIFTY : Intraday Trading levels and Plan for 25-Mar-2025🧠 Bank Nifty Trading Plan – 24th March 2025 (Educational & Action-Oriented)
Chart Timeframe: 15-Min | Analysis based on key price behavior and support-resistance zones.
🔍
📈 GAP-UP Opening (Above 50,904 – 51,218)
If Bank Nifty opens with a strong gap-up above the Opening Resistance of 50,904, prices will be entering a retracement resistance zone up to 51,218.
✅ Plan of Action:
• Watch for price exhaustion near 51,218 – a zone where sellers may attempt to trap late buyers.
• Avoid aggressive buying at open. Instead, wait for a rejection candle (like an inverted hammer or bearish engulfing) near resistance.
• If reversal signs appear, look for Put Option entries (OTM PE) with tight SL above 51,250 on 15-min close.
• Bullish continuation only above 51,218 with strong volume. That opens upside targets towards fresh highs.
🛑 Avoid chasing CE after gap-up unless there's a retest and breakout above 51,218.
📌 Key Zone to Watch: 50,904 – 51,218
📊 FLAT Opening (Near 50,460 – 50,570)
Opening near the resistance/support band of 50,462 – 50,570 could lead to consolidation initially.
✅ Plan of Action:
• First 15–30 minutes: Let price settle. If it holds above 50,570, we may see an up move towards 50,904.
• If price breaks below 50,462, expect quick profit booking, and the index may fall toward the green support zone (50,111 – 50,216).
• This is a stock-specific intraday day. Avoid index scalping unless directional clarity comes after first 30 min.
💡 Tip: Straddle players may enjoy decay here, but don't hold beyond consolidation breakout.
📌 Key Levels:
Support: 50,462 – 50,216
Resistance: 50,570 – 50,904
📉 GAP-DOWN Opening (Below 50,216 or 50,111)
A bearish open below the Opening Support Zone (50,111 – 50,216) indicates potential for sharp intraday correction.
✅ Plan of Action:
• Immediate demand may be seen around Last Intraday Support (50,111) or deeper at Buyer's Support 49,852.
• Watch for reversal candles near these zones. A bullish engulfing or pin bar here offers good risk/reward Call buying opportunities.
• SL for CE entry should be below 49,800 on 15-min candle close.
• If 49,852 breaks, expect a sharp selloff. Stay away from longs. Look for PE entries targeting 49,500.
🟢 Safer CE trades only if price respects 50,111 or 49,852 with volume spike.
📌 Important Zones:
• Demand: 50,111 & 49,852
• Breakdown Trigger: Below 49,800
🧰 Risk Management Tips for Options Traders:
• Never go all-in at open – wait for confirmation from first 15–30 min candle.
• Use hedged strategies like bull call spreads or bear put spreads to limit loss and reduce theta decay.
• Respect SL strictly based on 15-min closing levels.
• If VIX is high, premiums will move fast. Trade light, exit early.
• Never average losing trades, especially in options.
📌 Summary & Conclusion:
For 24-Mar-2025, Bank Nifty's range has shifted upwards with new key zones in focus.
Watch for reaction near 50,904 & 51,218 for reversal signals.
Support remains strong near 50,111 & 49,852.
Let the market open, show intent, and only then enter. Patience = Profit!
⚠️ Disclaimer: I am not a SEBI-registered analyst. All views shared are for educational purposes only. Please consult your financial advisor before making any trading decisions.

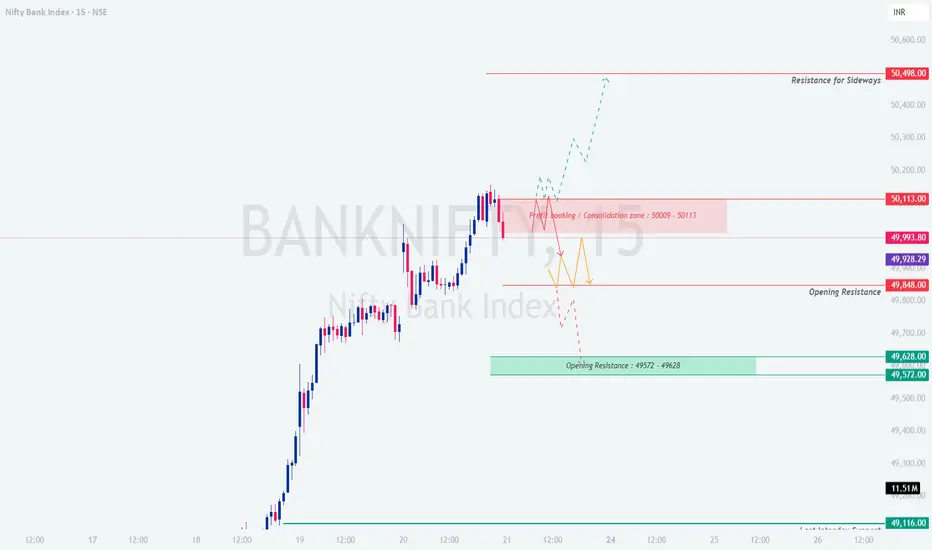
BANKNIFTY : Trading Levels and Plan for 21-Mar-2025📅 BANK NIFTY Trading Plan – 21-Mar-2025
📍 Reference Close: 49,993.80
📊 Chart Context: Bank Nifty is trading just below a crucial consolidation zone after a strong uptrend. Now, price is near a likely decision point, where either profit booking or another leg of rally may unfold.
📌 Opening Scenario 1: GAP-UP Opening (200+ Points)
🟢 Expected Opening Zone: 50,200 – 50,350+
A gap-up above 50,113 opens the day inside or above the Profit Booking / Consolidation Zone (50,009 – 50,113).
If Bank Nifty opens near 50,200 – 50,350 , be cautious of profit booking and wick rejections.
Price needs to sustain above 50,498 for a fresh breakout. If sustained, we may see an attempt to move toward 50,600+.
In case price struggles and forms bearish candles near 50,113 – 50,200 , short trades can be initiated with stop loss above 50,498 , targeting 49,848 and 49,628 .
🎯 Educational Tip: Avoid chasing trades during a gap-up unless price sustains above key resistance levels with a breakout-retest confirmation.
📌 Opening Scenario 2: FLAT Opening (Within 49,950 – 50,050)
🟠 Expected Opening Zone: 49,950 – 50,050
Flat openings require a wait-and-watch approach during the first 15–30 mins.
Monitor price behavior around 50,009 – 50,113 zone . If price consolidates here without breakout, it could be a signal for sideways to negative bias.
Shorting opportunity arises if price fails to break 50,113 and closes below 49,993 with strong bearish candles – downside targets are 49,848 → 49,628 .
For bullish bias, price must give a sustained move and 15-min close above 50,113 – in that case, expect a potential rally towards 50,498+ .
🎯 Educational Tip: During flat opens, let the market form its direction. Don’t pre-empt moves – instead, trade the reaction to key levels.
📌 Opening Scenario 3: GAP-DOWN Opening (200+ Points)
🔻 Expected Opening Zone: 49,700 – 49,500
Gap-downs into or below Opening Resistance Zone (49,572 – 49,628) need to be observed for reaction.
If price reclaims and sustains above 49,628 , it indicates strength and a chance to move toward 49,848 and possibly 49,993 .
If rejection happens from this zone and price stays below 49,572 , expect further downside toward 49,116 (Last Informed Demand Zone).
Avoid aggressive shorting on open – wait for retest and rejection from resistance to maintain risk-reward.
🎯 Educational Tip: On gap-down days, markets often trap early sellers. Always wait for price confirmation before entering the trade.
🛡 Risk Management Tips for Options Traders 💡
Do not buy deep OTM options, especially post 11:00 AM – time decay works against you.
Prefer spreads (like Bull Call or Bear Put) if expecting directional move with limited risk.
Set pre-defined stop losses and maximum loss per day (1–2% of capital).
Avoid revenge trading. One missed trade is better than blowing your capital.
Use higher time frame confirmation (like 15-min or hourly) before taking position.
Avoid holding weekly options overnight unless well in-the-money and hedged.
✅ Summary & Conclusion:
📍 Key Resistance Zones: 50,113 → 50,498
📍 Support Zones: 49,848 → 49,628 → 49,116
📍 The market is at a potential turning zone. React to price action at key levels rather than predicting.
📍 Maintain patience during first 30 minutes and wait for clean structure formation.
📍 Follow strict discipline with entries, exits, and stop losses.
⚠️ Disclaimer:
I am not a SEBI-registered analyst . This plan is created for educational and learning purposes only. Please do your own research or consult a registered financial advisor before making trading decisions. Always trade with proper risk management. 🙏
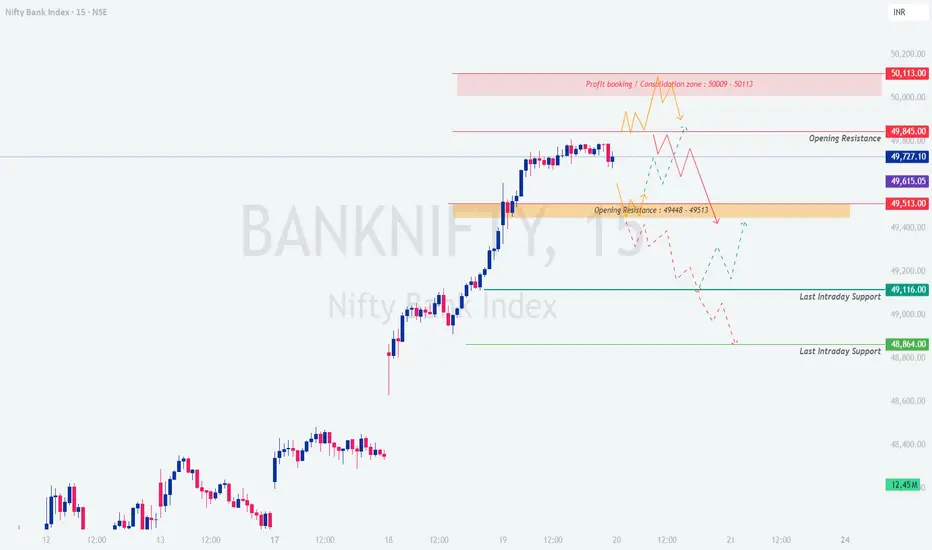
BANKNIFTY : INTRADAY ACTION PLAN – 20-Mar-2025🔔 BANKNIFTY INTRADAY ACTION PLAN – 20-Mar-2025
📊 Timeframe: 15 Min | 📅 Date: Thursday, 20-Mar-2025
📍 Reference Close: 49,727
📏 Gap Opening Reference: 200+ points
📈 1. GAP-UP Opening Scenario (Opening Above 49,900)
If BANKNIFTY opens above 49,900 (200+ pts gap-up), it will enter the red supply zone near Profit Booking / Consolidation Zone: 50,009 – 50,113 .
✅ Action Plan:
- Avoid aggressive longs directly at the open.
- Wait and watch for signs of rejection or exhaustion near 50,009–50,113 .
- If price starts forming lower highs or a reversal pattern (like bearish engulfing or pin bar), consider short trades with a stop loss above 50,113 .
- Safe traders should wait for a break below 49,845 to confirm short momentum.
💡 Insight: This zone has high probability of profit booking and trap formations for late buyers.
📊 2. FLAT Opening Scenario (Within 49,600 – 49,800 range)
If BANKNIFTY opens flat, likely between Opening Resistance: 49,448 – 49,513 and 49,727 :
✅ Action Plan:
- This is the most strategic opening zone—allow the price to settle for first 15–30 mins .
- A bullish breakout above 49,845 with volume can trigger a long entry towards 50,009+ , but do not chase without confirmation.
- If rejection occurs at 49,845 , short trades with target towards 49,448–49,116 are possible.
- Breakdown below 49,513 may trigger a gradual move towards 49,116 / 48,864 .
💡 Insight: This is a reactive zone. Follow market structure and avoid overtrading in chop.
📉 3. GAP-DOWN Opening Scenario (Opening Below 49,500)
If BANKNIFTY opens with a gap-down of 200+ points, below 49,500 :
✅ Action Plan:
- Watch support zones at 49,116 (first support) and 48,864 (strong support).
- If prices hold above 49,116 and show reversal candles, consider intraday long with tight SL below 48,864 .
- If price sustains below 48,864 with volume, expect further downside—do not try to bottom-fish blindly.
💡 Insight: Gap-downs often trap weak hands. Let the structure develop before acting.
⚠️ OPTIONS TRADING – RISK MANAGEMENT TIPS:
Use defined stop losses based on 15/30 min candle close. Avoid emotional exits.
Prefer in-the-money (ITM) options during trending moves for better delta and stability.
Avoid buying options when IV is high—especially after big gap openings.
Consider hedged strategies like bull/bear spreads to protect against volatility crush.
Keep risk per trade under 2% of capital to ensure survival over the long term.
📌 Summary & Conclusion:
Above 49,845: Watch for exhaustion → potential short near 50,009–50,113
Flat Zone: Wait for either breakout (49,845) or breakdown (49,513) confirmation
Below 49,116: Last supports lie at 48,864 – key zone to avoid catching falling knives
🚀 Let the price show intent. React smartly. Avoid trading just because the market is open.
📢 Disclaimer: I am not a SEBI-registered analyst . This post is for educational purposes only. Please consult your financial advisor before taking any position.
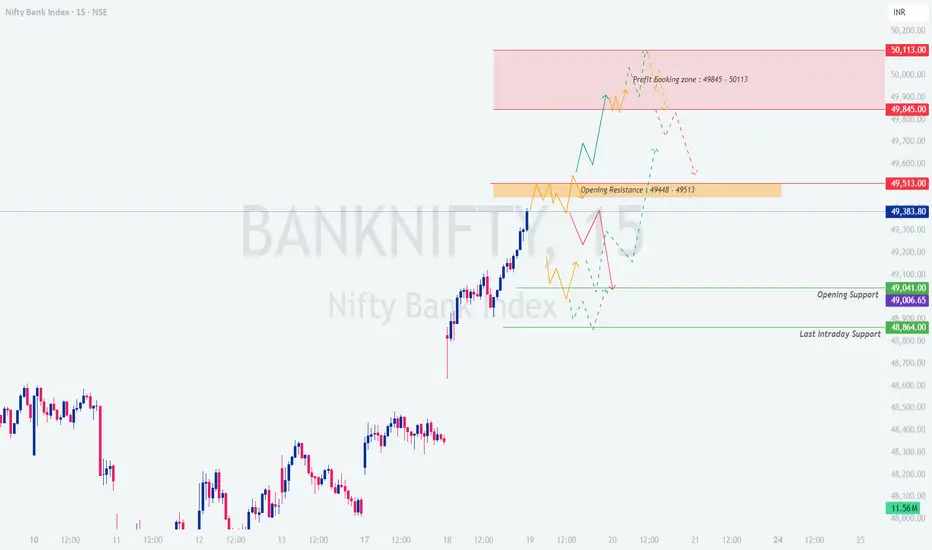
BANKNIFTY : Trading Levels and Plan for 19-March-2025🔥 BANK NIFTY – Intraday Trading Plan for 19-Mar-2025
📍 CMP: 49,383.80
📊 Chart Timeframe: 15-Min
📘 Scenario 1: GAP-UP Opening (200+ points)
If BANK NIFTY opens above 49,585, it will open within or near the upper boundary of the Profit Booking Zone (49,845 – 50,113) .
Opening directly in the Profit Booking Zone usually leads to short-term exhaustion due to profit-taking from recent long positions. Avoid aggressive long positions in the first 15 minutes; instead, monitor for reversal signs such as bearish engulfing or evening star near 49,900–50,100. If the index forms a tight consolidation or fake breakout within the red zone, a short trade can be considered with a stop above 50,120, targeting a retest of 49,585 and possibly 49,513. On the flip side, if price breaks above 50,113 with strong bullish volume and sustains for 15–30 minutes, a fresh uptrend may emerge. In that case, switch bias to buy-on-dips with SL below 50,000.
🧠 Educational Note: After a large gap-up, the early euphoria often fades. Wait for the first trap—either a breakout trap or breakdown trap—to reveal the true direction.
📗 Scenario 2: FLAT Opening (within 100–150 pts)
A flat to mild gap opening around 49,300 – 49,400 keeps the index close to the Opening Resistance zone: 49,448 – 49,513 .
This area may act as a strong inflection point. Watch how price reacts in the first 15 minutes around this resistance. If price breaks above 49,513 with volume and retests this zone successfully, it could head toward 49,845. Conversely, if rejection happens around 49,448–49,513, short opportunities open up with targets at 49,041 and 48,864. Do not take trades within a narrow range unless price gives a clean breakout or breakdown.
🧠 Educational Note: When the market opens flat after a trending day, expect rangebound movement early on. Let it break the opening structure before placing bets.
📙 Scenario 3: GAP-DOWN Opening (200+ points)
In case BANK NIFTY opens below 49,100, it will be around the Opening Support zone: 49,041 – 49,006 or even closer to the Last Intraday Support at 48,864 .
Aggressive selling at open should be avoided unless price breaks below 48,864 decisively. Look for signs of reversal around 49,006 or 48,864. If the market forms double bottom or bullish hammer with a strong follow-up candle, intraday recovery trades may work well. Upside targets in a bounce can be 49,300 and 49,448. If price fails to hold 48,864, expect a decline towards 48,700 – 48,550 zone. Stick to directional trades only after a 15-min candle close below key support.
🧠 Educational Note: Gap-downs often cause panic, but panic selling near support zones can give excellent risk-reward reversal trades. Wait for candle confirmation.
💡 Risk Management Tips for Options Traders 🛡️
✅ Use spreads (e.g., bull call or bear put spreads) to reduce risk from premium erosion.
✅ Avoid overtrading post-gap moves; trade only after structure is confirmed.
✅ Avoid buying OTM options blindly after a gap opening; they lose value fast.
✅ Follow 1:2 or better risk-reward setups. Don’t chase profits.
✅ Place stop-losses based on candle close, not ticks.
✅ Use position sizing to manage risk—don’t risk more than 1–2% of capital per trade.
✅ Don’t average losing option positions. Exit fast if view is invalidated.
📊 Summary & Conclusion
📌 Resistance Zones:
🔺 49,448 – 49,513 (Opening Resistance)
🔺 49,845 – 50,113 (Profit Booking Zone)
📌 Support Zones:
🟩 49,041 – 49,006 (Opening Support)
🟩 48,864 (Last Intraday Support)
🔄 Key Actionable Plan:
— For gap-up, wait for reversal signs in profit booking zone.
— For flat open, focus on breakout or rejection near opening resistance.
— For gap-down, look for reversal near support unless breakdown happens.
🎯 Trade the reaction, not the expectation. Let the price action unfold near key zones, and only then initiate trades with tight stop losses and proper risk reward.
⚠️ Disclaimer: I am not a SEBI registered analyst. This analysis is shared for educational purposes only. Please consult your financial advisor before making any investment or trading decisions.