BANKNIFTY : Levels and Trading Plan for 08-Nov-2024
Previous Day’s Chart Overview:
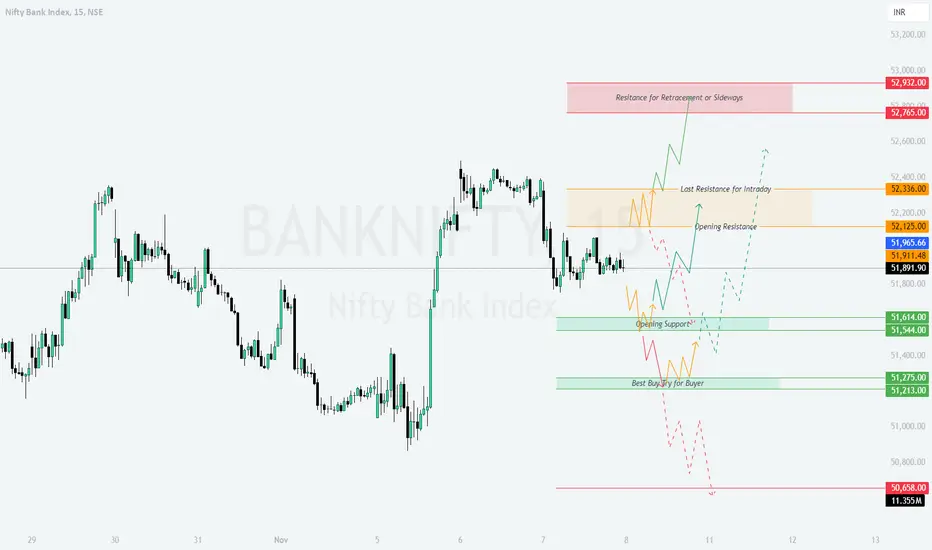
On 07-Nov-2024, Bank Nifty experienced mixed movements, with a notable consolidation phase following an initial upward trend. The chart identifies crucial levels of support and resistance that may impact price action on 08-Nov. The Yellow trend shows a sideways movement, the Green trend represents a bullish outlook, and the Red trend indicates possible bearish paths.
---
Trading Plan for 08-Nov-2024
Gap Up Opening (200+ points):
If Bank Nifty opens above 52,125.00 (Opening Resistance) and sustains, consider taking long positions on pullbacks near this level, targeting the next intraday resistance at 52,336.00 .
If Bank Nifty faces resistance near 52,336.00, look for shorting opportunities with a quick pullback target to 52,125.00.
A breakout above 52,336.00 may open doors towards the 52,765.00 - 52,932.00 range, where sideways resistance might curb the bullish momentum. Manage your profits or trail stops within this zone.
Flat Opening (within ±100 points):
If Bank Nifty opens near 51,911.48 and sustains above the 51,965.66 - 51,911.48 zone, look for long opportunities targeting 52,125.00 (Opening Resistance) .
Should it fail to hold the 51,911.48 level, be cautious as it may move down to test 51,614.00 (Opening Support) . Look for buying opportunities here if support holds.
If Bank Nifty consolidates between 51,911.48 and 51,614.00 , consider light trades only when there’s a breakout in either direction.
Gap Down Opening (200+ points):
In the event of a gap down near 51,614.00 (Opening Support) , watch for any buying pressure at this level. A strong bullish reaction here could provide an entry opportunity with targets toward 51,911.48 and 52,125.00 .
A breakdown below 51,614.00 could lead to further bearish movement towards 51,275.00 (Best Buy for Buyer) . Short positions may be favorable here, with stops around the opening support zone.
If Bank Nifty continues to slide below 51,275.00 , the next crucial level is 51,213.00 , a potential reversal point. Observe if support builds here for a trend reversal.
Risk Management Tips for Options Trading:
Set stop-losses strictly, especially near major support and resistance levels, to minimize downside risks.
Consider smaller position sizes and use out-of-the-money options to manage premiums in high volatility.
Utilize hedging strategies, such as spreads, to protect against unpredictable market swings.
Summary & Conclusion:
Bank Nifty’s price action on 08-Nov could provide significant trading opportunities, especially around key support and resistance zones. Exercise caution at the “Best Buy for Buyer” level around 51,275.00, as it could potentially lead to a reversal. Prioritize risk management to protect capital in volatile markets.
---
Disclaimer:
I am not a SEBI-registered analyst. This analysis is for educational purposes only and should not be considered as investment advice. Please consult a financial advisor before making trading decisions.
Bankniftyview
BANKNIFTY : Trading Levels and Plan for 07-Nov-2024Intro:
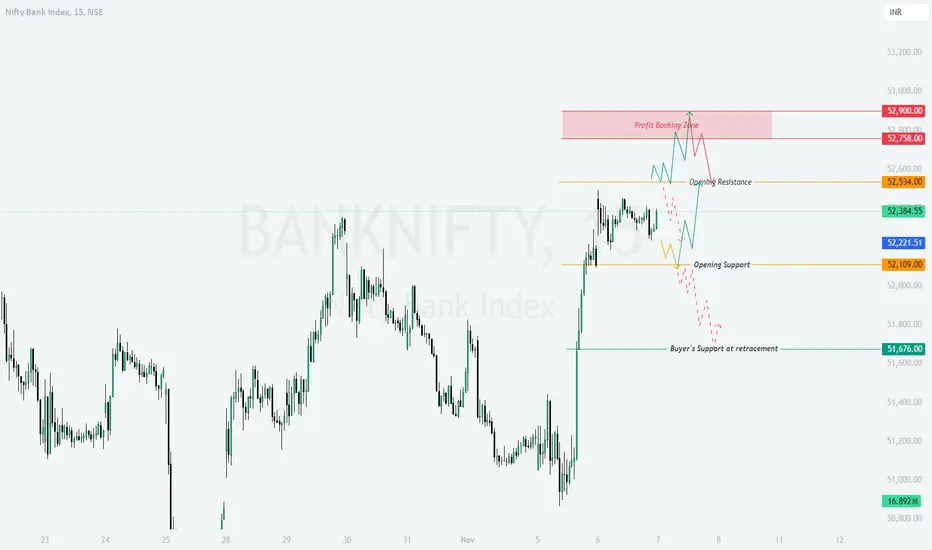
On the previous trading day, Bank Nifty exhibited a sideways trend in the zone that highlighted in yesterday's day plan and could not break that range, reaching resistance levels but pulling back slightly. The chart shows key zones for profit booking at 52,900 , opening resistance around 52,534 , and opening support at 52,109 . The price action at these levels will determine the trend continuation or possible reversal. Yellow lines indicate a sideways trend, green lines indicate bullish momentum, and red lines highlight potential bearish scenarios.
Opening Scenarios:
Gap Up Opening (200+ Points Above):
If Bank Nifty opens above 52,534 , watch for resistance around the 52,758 - 52,900 profit booking zone. A strong breakout above 52,900 can signal bullish continuation, providing entry opportunities for a quick upside trade with a stop-loss below 52,534 .
However, if the index faces resistance at this level, a pullback may ensue, suggesting a reversal towards the opening support at 52,109 . In this scenario, cautious long trades are advisable, targeting small profits while trailing the stop-loss.
Flat Opening:
If Bank Nifty opens around 52,384 , the opening resistance at 52,534 and support at 52,109 become critical zones. Price behavior around these levels will guide the trend:
A break above 52,534 could lead to a test of the profit booking zone ( 52,758 - 52,900 ).
A rejection at 52,534 can lead to a sideways trend, likely oscillating between 52,534 and 52,109 . Consider quick scalping trades with limited risk here.
If the price moves below 52,109 , expect a potential downward move, aiming for the buyer's support at 51,676 .
Gap Down Opening (200+ Points Below):
In the event of a gap-down opening near or below 52,109 , Bank Nifty may seek support at 51,676 . Observe if it finds stability here to confirm a buying opportunity for a potential rebound.
If 51,676 fails to hold, Bank Nifty may trend lower, with bearish momentum potentially extending to the lower support zone.
Conversely, a recovery above 52,109 could lead to a pullback rally towards 52,534 , presenting a quick rebound trade opportunity.
Risk Management Tips for Options Trading:
Use defined stop-losses based on support/resistance levels ( 52,534 , 52,109 , 51,676 ) to manage risk.
Avoid overleveraging, particularly during high volatility zones.
Consider deploying options strategies (e.g., spreads) to reduce premium costs and manage risk exposure.
Trail stop-losses as the price moves favorably to lock in profits.
Summary and Conclusion:
The key levels for Bank Nifty on 07-Nov-2024 are 52,534 (opening resistance), 52,109 (opening support), and 51,676 (buyer’s support). Monitor these zones for potential reversals or breakouts. Follow risk management guidelines strictly, particularly in options trading, to safeguard against adverse moves.
Disclaimer:
I am not a SEBI-registered analyst. The analysis and trading levels shared are based on technical patterns and personal views. Traders are advised to perform their due diligence or consult with a financial advisor before taking any trading action.
BANKNIFTY Breaks Out! TP1 Achieved—Higher Targets in SightBANKNIFTY Technical Analysis:
BankNifty has demonstrated strong bullish momentum on the 15-minute timeframe, successfully hitting Target 1 (TP1) at ₹52,057.50. The price action suggests a continuation towards the remaining targets, supported by key technical indicators.
BANKNIFTY Trade Summary:
Entry Point: ₹51,733.25
Stop Loss (SL): ₹51,555.40
Targets:
TP1: ₹52,057.50 ✅ Achieved
TP2: ₹52,479.00
TP3: ₹52,900.50
TP4: ₹53,224.75
Key Observations:
Bullish Momentum: The index has broken above significant resistance levels, indicating strong buying pressure.
Risological Dotted Trendline : Price is maintaining above the Risological Dotted Trendline, confirming the upward trend.
Increased Volume: There's a noticeable rise in trading volume, adding confidence to the bullish move.
Market Context:
The positive movement in BankNifty aligns with optimistic market sentiments in the banking sector. Contributing factors may include favorable economic data, strong earnings reports from major banks, or broader market rallies.
Outlook:
With TP1 successfully reached, the focus shifts to the next targets:
TP2 at ₹52,479.00: A break above this level could accelerate bullish momentum.
TP3 and TP4: Achieving these targets would signify a robust uptrend and potential new highs.
Recommendations:
Monitor Price Action: Keep an eye on how the price behaves around TP2. A strong close above this level with sustained volume could indicate a move towards TP3 and TP4.
Risk Management : Maintain the stop loss at ₹51,555.40 to protect against unexpected market reversals.
Stay Informed: Watch for any news or events that could impact the banking sector or overall market sentiment.
Conclusion:
BankNifty's strong breakout and the achievement of TP1 signal a promising opportunity for traders. The alignment of the technical indicator Risological Swing Trader with positive market sentiment increases the likelihood of reaching the remaining targets. As always, prudent risk management and staying updated with market developments are essential for capitalizing on this trade setup.

BANNIFTY : Trading Levels and Plan for 06-Nov-2024Previous Day's Chart Pattern Recap:
On the previous trading day, Bank Nifty displayed strong bullish momentum, with significant buying observed around the 51,900 support level. This momentum pushed prices higher, testing key resistance zones near 52,322 and approaching the Profit Booking Zone at 52,900 . The trend areas on the chart are marked with color coding, where Yellow represents a sideways trend, Green indicates a bullish trend, and Red shows a bearish trend.
06-Nov-2024 Trading Plan:
Opening Scenarios:
Gap Up Opening (200+ Points Above Closing Price):
- If Bank Nifty opens around the 52,322 resistance zone, traders should exercise caution as this could lead to profit-booking pressure near 52,534 .
- A confirmed breakout above 52,534 could lead to further bullish momentum, targeting the Profit Booking Zone at 52,900 .
- In case of rejection near 52,534 , look for bearish candles as a sign of weakness for a potential retracement back toward the Opening Support at 52,032 .
Flat Opening (Near Closing Price of 52,105):
- If the market opens flat around 52,105 , wait for the price action near the Opening Resistance at 52,322 .
- A successful breach and close above 52,322 can trigger a bullish move towards 52,534 and ultimately to the 52,900 zone if momentum sustains.
- Failure to cross 52,322 may signal a sideways move (yellow trend) between 52,032 and 52,322 . Intraday traders can trade the range until a clear breakout.
Gap Down Opening (200+ Points Below Closing Price):
- If Bank Nifty gaps down near 51,611 , observe the price action here. This level serves as an important buyer support at the previous breakout structure (BoS).
- A bounce from 51,611 may indicate buyer strength, aiming for a recovery back to 52,032 and higher.
- If 51,611 fails to hold, expect a bearish move toward the Last Intraday Support at 51,373 . This area will be crucial for bulls to defend to avoid further downside.
Risk Management Tips for Options Trading:
- Use tight stop losses, especially in volatile conditions. Adjust stop losses as per volatility in the market.
- Avoid holding options close to expiry without clear direction as time decay accelerates.
- Prefer trading options with sufficient liquidity to ensure better entry and exit without slippage.
- Maintain a risk-to-reward ratio of at least 1:2. Avoid chasing trades and wait for confirmations.
Summary & Conclusion:
For 06-Nov-2024, Bank Nifty’s crucial levels to monitor are 52,534 on the upside and 51,611 on the downside. A breakout above 52,534 may lead to bullish continuation, while a break below 51,611 could invite selling pressure. Monitor the chart closely, as Yellow, Green, and Red trends signal sideways, bullish, and bearish moves respectively.
Disclaimer: I am not a SEBI-registered analyst. The above analysis is for educational purposes only. Please do your research or consult with a certified financial advisor before trading.

[INTRADAY] #BANKNIFTY PE & CE Levels(04/11/2024)Bank Nifty is expected to open flat today. After the opening, it is likely to trade within a consolidation zone between the 51500 and 52000 levels throughout the session. A significant downside movement is expected only if Bank Nifty starts trading below the 51450 level, which could lead to a decline toward the 51050 mark. Conversely, a strong bullish rally may occur only if it breaks above the 52050 level, signaling potential upward momentum.

BANKNIFTY : Trading Levels and Plan for 04-Nov-2024Intro for Previous Day's Chart Pattern:
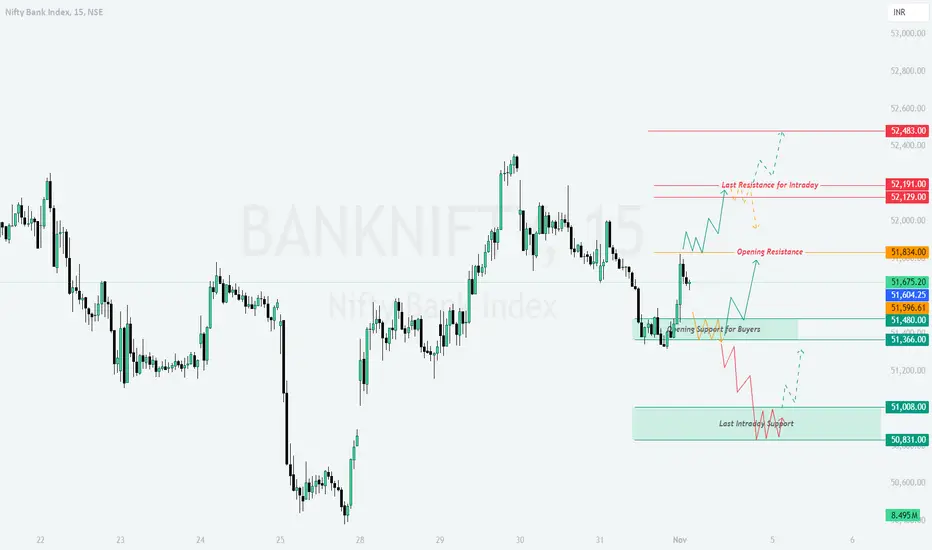
In the last two trading session, Bank Nifty displayed a mixed trend with a bounce off the support levels, suggesting buying interest from lower zones. Key resistance levels emerged near the higher range, where sellers maintained pressure. As per the chart, Yellow indicates a potential Sideways trend, Green shows a Bullish trend, and Red highlights a Bearish trend.
---
Trading Plan for 04-Nov-2024:
Opening Scenarios:
Gap Up Opening (200+ points):
If Bank Nifty opens with a significant gap up around 52,191 or higher:
- Watch for resistance near 52,191 (marked as “Last Resistance for Intraday”). A strong breakout above this level may provide momentum for further upside.
- If the price holds above 52,129, consider initiating long positions, but be cautious of quick pullbacks near 52,483, the higher resistance zone.
- If resistance holds, wait for confirmation before shorting, as the price may consolidate or pull back slightly to retest lower support levels.
Flat Opening:
If Bank Nifty opens flat around 51,675:
- Focus on the immediate resistance level of 51,834. A decisive break above this level can push prices toward the 52,000+ range.
- If prices struggle to breach 51,834, consider waiting for a dip towards 51,480, which is the “Opening Support for Buyers,” to enter long positions.
- For intraday shorts, wait for bearish confirmation near 51,834 before targeting lower levels, particularly if the price heads toward the 51,366 support area.
Gap Down Opening (200+ points):
If Bank Nifty opens with a gap down near 51,366 or lower:
- Observe the support zone around 51,366 and 51,008. If the price stabilizes in this range, it could be a good entry for long trades with a target towards 51,604.
- If 51,008 (Last Intraday Support) is breached, further downside could follow, potentially dragging the index down to the 50,831 level.
- Look for confirmation of strength or weakness before entering positions, as gap-down openings may lead to volatile price action.
---
Risk Management Tips for Options Trading:
- Use tight stop-losses in the volatile market conditions post-Diwali to avoid sharp losses.
- Avoid over-leveraging. Consider position sizing that aligns with your risk tolerance, especially near key support and resistance levels.
- Monitor option premiums closely, as high volatility can lead to rapid premium decay.
- In case of significant volatility, consider exiting options positions early to preserve gains or limit losses.
---
Summary and Conclusion:
The 04-Nov-2024 session holds potential for a continuation of recent trends, with key resistance and support levels in focus. Look for clear breakouts above resistance or signs of support holding to confirm directional bias. Sideways movement within key zones may indicate consolidation, while breaks beyond these zones may drive a more directional move.
Disclaimer: I am not a SEBI-registered analyst. This trading plan is shared for educational purposes. Please conduct your analysis or consult a financial advisor before making any trading decisions.
BANKNIFTY : Trading Levels and Plan for 31-10-2024
Intro:
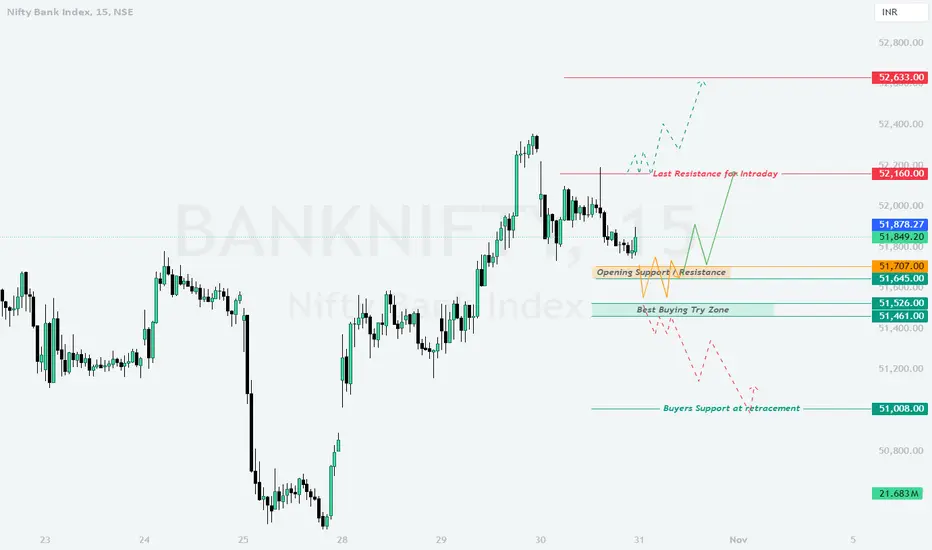
On the previous trading day, Bank Nifty experienced a range-bound movement with significant support and resistance levels being respected. For the upcoming session on 31-Oct-2024, we have identified key levels, with yellow marking the sideways trend, green indicating bullish movement, and red representing bearish tendencies. This plan includes strategies for each opening scenario.
Trading Plan for 31-Oct-2024
Gap Up Opening (200+ points above)
If Bank Nifty opens with a 200+ point gap up, it may quickly test the Last Resistance for Intraday near 52,160 . If the price can sustain above this level, a further move towards 52,633 is likely. However, if the index fails to hold above 52,160 , it may experience a retracement to the Opening Support/Resistance level at 51,707 .
– Watch for signs of rejection at the 52,160 level, as this may prompt a reversal towards support levels.
Flat Opening (within 50 points of the previous close)
In the case of a flat opening, the immediate level to observe is 51,849 . Sustaining above this point could enable a bullish move towards 52,160 . Failure to maintain momentum above 51,849 may result in sideways movement around the Opening Support/Resistance at 51,707 or even lead to a test of the Best Buying Try Zone near 51,645 .
– A move below 51,645 would likely signal weakness, potentially driving the index lower towards 51,526 .
Gap Down Opening (200+ points below)
A gap-down opening would bring Bank Nifty closer to the Best Buying Try Zone at 51,645 . A bounce from this area could lead the index back to 51,849 . However, if this level does not hold, watch for further decline towards the Buyers Support at Retracement at 51,008 .
– Persistent weakness below 51,008 would indicate a bearish sentiment, with potential downside targets emerging.
Risk Management Tips for Options Trading
Define your risk tolerance and adjust your position size accordingly.
Consider using protective strategies, such as stop-loss orders, especially around key resistance/support zones.
Avoid over-leveraging, and monitor volatility closely to avoid sudden adverse moves.
Summary and Conclusion
Key levels for Bank Nifty on 31-Oct-2024 include 52,160 on the upside and 51,645 on the downside. Monitor these levels closely for directional cues. Employ disciplined risk management to navigate through the volatility, especially when trading options.
Disclaimer:
I am not a SEBI-registered analyst. This analysis is based on technical levels and reflects my personal view. Please perform your own analysis or consult a financial advisor before trading.
BANKNIFTY : Trading Levels and Plan for 29-10-2024
Intro:
On the previous day, Bank Nifty showed a mixture of consolidation and upward movement and resistance at higher level from and to recommended levels , suggesting potential momentum above certain levels. The chart highlights yellow zones as areas likely to see sideways movement, green zones as potential bullish areas, and red zones for bearish momentum. Today, we’ll explore trading strategies for different opening scenarios.
Trading Plan for 29-Oct-2024
Gap Up Opening (200+ points above)
If Bank Nifty opens with a 200+ points gap up, it is likely to encounter resistance around the 51,478 level, marked as the Last Resistance for Intraday . If prices sustain above this level, we may see an upward movement towards the Profit Booking Zone / Sideways Zone between 51,955 - 52,160 . However, if it fails to break this resistance, expect potential retracement towards the Opening Support at 51,080 .
– If selling pressure builds, Bank Nifty may pull back further to retest 50,985 as an additional support level.
Flat Opening (within 100 points of the previous close)
With a flat opening, monitor the first 30 minutes for price action clarity. If Bank Nifty trades above 51,478 after initial consolidation, it could signal a bullish push toward 51,955 . A breakout above this resistance might lead the price to test the upper bounds near 52,160 . Conversely, if it struggles to hold above 51,478 , a sideways or slight bearish trend might develop towards 51,080 .
– Any dip below 51,080 may attract additional selling pressure, possibly pushing prices towards the Pending Buyer’s Order Zone around 50,638 .
Gap Down Opening (200+ points below)
In a gap-down scenario, focus on 50,985 as a crucial support level. If Bank Nifty maintains this level, it might attempt to rebound towards 51,478 . A successful move above 51,478 could bring sideways to bullish action up to 51,955 . If, however, the index breaks below 50,985 , expect it to test the Pending Buyer’s Order Zone at 50,638 , a key level for potential trend reversals.
– Failure to hold at 50,638 may lead to further bearish momentum.
Risk Management Tips for Options Trading
Set defined stop-loss levels for each trade based on market volatility; hourly candle closes can serve as an effective risk management tool.
Avoid over-allocating capital in options trading. Use smaller position sizes to manage potential market swings.
Consider trailing stops to protect profits if Bank Nifty moves favorably in your direction, especially during periods of heightened volatility.
Summary and Conclusion
Today, the primary levels to watch are 51,478 as the last intraday resistance and 50,985 as key support. A break beyond these levels could determine the market's directional bias. Adopting a flexible strategy and monitoring early price action can provide valuable insights for effective entries.
Disclaimer:
I am not a SEBI-registered analyst. This analysis represents my personal view and is based on technical levels. Please do your research or consult a financial advisor before making any trading decisions.

BANKNIFTY Lon Trade Setup on 15m Timeframe.Fresh long trade on BANKNIFTY.
Not at office today, so updating this trade from my phone.

BANKNIFTY : Trading Levels and Plan for 28-Oct-2024**Introduction:**
In the previous trading session on 25th October 2024, BankNifty displayed a Drop to the support line and showed sign of recovery in the last hour of the session, with notable movements observed around the 50,458 support level. Price action showed a consolidation phase with buyers stepping in at lower levels to prevent a significant downside. However, resistance zones around 51,083 acted as a barrier, limiting upward momentum. Heading into the session of 28th October 2024, we’ll analyze different opening scenarios to strategize effectively.
**Trading Plan for 28th October 2024:**
Gap Up Opening (200+ points):
If Bank Nifty opens above 51,083 with a 200+ point gap up:
- The First Resistance Zone to watch will be at 51,478. Yellow trend lines indicate possible sideways movement if the index tests this resistance and fails to break through.
- If momentum carries Bank Nifty above 51,478, the next target would be the Profit Booking Zone at 51,955 to 52,160, where significant selling pressure is anticipated. Green trend lines indicate a bullish trend with potential pullbacks.
- Observe for rejection signals near resistance before considering short positions. Sideways consolidation near 51,478 could indicate a potential retracement, targeting the 51,083 level as a support for a bullish continuation.
- A fallback below 51,083 would target the 50,775 level, acting as an intraday support.
Flat Opening:
If Bank Nifty opens around the previous close near 50,854:
- Key support levels to monitor include 50,775 and 50,458. Initial support at 50,775 should offer a foundation for buyers, allowing an upward move towards 51,083.
- In the event of a breakout above 51,083, Bank Nifty may challenge 51,478, but watch for sideways movement (yellow trend) near this resistance level.
- Should the 50,458 level break on an hourly close, expect bearish momentum to intensify, possibly targeting the last intraday support at 49,899, as indicated by the red trend line.
- Look for bullish confirmation above 51,083 and bearish confirmation below 50,458 before committing to a directional trade.
Gap Down Opening (200+ points):
If Bank Nifty opens significantly lower, near 50,458 or below:
- The Opening Support zone between 50,458 and 50,326 should provide buying interest, with potential for a rebound toward 50,775.
- A decisive move below 50,183 could test the Last Intraday Support at 49,899. Failure to hold this level would likely increase selling pressure, potentially leading to further downside towards the 49,534 zone.
- In the case of a recovery from 50,458, watch for resistance at 51,083, with a cautious approach to bullish entries due to volatility risks in gap-down scenarios.
**Risk Management Tips for Options Trading:**
Use hedged positions like Bull Call and Bear Put spreads to limit exposure in volatile market conditions.
Maintain strict stop losses, especially in trending moves. Position sizing should be conservative to avoid outsized losses.
Avoid entering positions during extreme gap-ups or gap-downs without clear confirmation, as volatility is typically high at such times.
For short-term trades, trail stop losses and secure partial profits at key resistance levels.
**Summary & Conclusion:**
For the trading session on 28th October 2024, Bank Nifty will likely test major support and resistance levels with sideways consolidation (yellow trend), bullish potential (green trend), and bearish risk (red trend). Key levels to watch include 51,083 as a potential resistance and 50,458 as a key support. Patience and confirmation of price action are essential for effective entries and exits. Option traders should focus on spreads and hedging strategies to manage risks effectively.
**Disclaimer:**
I am not a SEBI-registered analyst. All levels and strategies shared are based on personal analysis. Please conduct your own research or consult with a financial advisor before making any trading decisions.

Bank Nifty Future map#Bank nifty is moving up but its a correction phase Denoted with WXY in elliott wave theory, above is the possible move. please share it

[INTRADAY] #BANKNIFTY PE & CE Levels(15/10/2024)Today will be gap up opening expected in banknifty. After opening if banknifty starts trading above 52050 level then possible strong upside rally of 400-500+ points. 51950 will act as an immediate resistance for banknifty. Downside expected 51550 level if reversal happens at this level. For today session 51550 will act as a strong downside support. Any major downside only expected below this level.

BANK NIFTY - Potential Bullish Move on Bullish Harami Formation
On the daily chart, a Bullish Harami pattern has formed, signaling a potential reversal after the recent downtrend. Here's my plan for this setup:
Entry: I'll be waiting for a 15-minute candle to break above the Entry Zone (51,784.80) . The high of that 15-minute candle will be my actual entry point.
Stop Loss: If any 15-minute candle closes below 50,194.30, I'll exit the trade to protect capital.
Target 1: 52,604.95 (First resistance)
Target 2: 53,375.30 (1:1 risk-reward)
Target 3: 54,965.80 / 54,840.50 (Major resistance area)
I'm watching for a breakout above the entry zone, ideally with strong volume for confirmation. The key here will be holding above the entry zone and making progress toward Target 1. If that happens, I’ll evaluate momentum for potential continuation toward Target 2 and Target 3.
As always, managing risk is crucial. If the price closes below the stop loss level on a 15-minute candle, I'll close the position. Let’s see how this setup plays out!
Disclaimer: This is not any financial advice, and for education purpose only.

BankNifty Long Trade on 15m Time Frame: Strong MomentumWe entered a long trade on BankNifty at 51155.90 on the 11th of October at 2:30 pm. The price has shown solid upward movement, and we have now set a trailing stop at 51,250 to lock in gains as we aim for higher targets.
Target Points:
TP 1: 51248.60 (hit)
TP 2: 51398.65
TP 3: 51548.70
TP 4: 51641.40
Trailing Stop: 51,250
Stop Loss (SL): 51080.85
The bullish trend remains strong, and we will continue monitoring the position for further developments as it approaches the remaining targets.

Nifty and Banknifty levels for 10th & 11th Oct
NSE:NIFTY1! & NSE:BANKNIFTY1! Levels
Nifty and Banknifty levels for 10th & 11th Oct
Please refer chart for more details

BANKNIFTY Short Setup after 2700+ Long Trade on RisologicalBANKNIFTY Short Setup after 2700+ Long Trade on Risological
So, finally we see a reversal on Banknifty after a massive rally of 3000+ points out of which we were able to catch about 2750+ points.
The chart looks bearish on 15m time frame and I took a small short, just a bit concerned about any potential sideway move.
Have a look at the chart Ive shared to get the entry, stoploss and profit targets of this BankNifty short trade.
Best regards!
Namaste!

BANKNIFTYNSE:BANKNIFTY
Long trem View of Bank nifty!
I hope it breaks the trendline and sustains !
Finger's crossed
Disclamier : You are responsible for your profits and loss.
The idea shared here is purely for Educational purpose.
Follow back, for more ideas and thier notifications on your email.
Support and Like incase the idea works for you.

BankNifty Trading SetupBankNifty has been trading within a 400-point range since Monday, Tuesday, and Wednesday, sustaining near its all-time high (ATH). If BankNifty crosses above 54,200 on Thursday and holds above that level for at least 15 minutes, our first target will be 54,400, and the second target will be 54,600.
This is for educational purposes only. We are not SEBI registered.

Stance remains the same Banknifty is bullish after correctionAs mentioned in previous analysis, banknifty might show some correction before continuing the bullish momentum. So I hope nobody was trapped today, as the market was fully sideways, now tomorrow will be a volatile day, a downside move followed by breakout above 54200. For levels check the chart or previous analysis.

BankNifty Today: 2900+ Points Profit Caught on RisologicalBankNifty Today: 2900+ Points Profit Caught on Risological Swing Trader
This is unbelievable!
BankNifty 2900+ Points one side move caught.
We got a confirmed entry at 51,230 and there is no looking back.
Our last take profit target was at 52,147, closed partially on TP4 and continued to hold the other partial position that is currently at 2900+ massive MASSIVE profit!!
For people who have been sending me DMs asking the indicato'r name, it is a paid indicator. Please Google - Risological Swing Trader.
Best regards,
Namaste!

Nifty and BankNifty UpdateCheckout the Nifty and BankNifty analysis. Also checkout our last analysis where we mention the selling levels

BankNifty 2300+ Points! MASSIVE MOVE Caught Using RisologicalBankNifty 2300+ Points! MASSIV MOVE Caught Using Risological Swing Trader
Guys,
This is UNBELIEVABLE!!!
My biggest BankNifty trade EVER!!!
2300+ points gain in BankNifty feels like direct access to the holy heaven!
Got a clear Entry of this CE side buy trade on 12 Sep 9:15 am at 51,230 price level.
The final profit target was at 880+ points anf I was holding 50% of this position which gave me a whopping 2300+ points of the remaining posiion.
How did I pull this off?
- Use 15m time frame chart
- Buy the monthly contract (not weekly).
- The monthly contracts are costlier, but it pays off in times like this.
- Follow the trend using the Risological swing trader
- You can either exit on every TP levels (Take profit), or
- Close partially on each level.
- Hold 25% of the position till the price reversal happens
- Price reversal means - the candle turning red on a long trade and green on a short trade.
Hope this helps!
Namaste!

[INTRADAY] #BANKNIFTY PE & CE Levels(20/09/2024)Bank Nifty is expected to open with a gap-up today. If Bank Nifty manages to sustain above the 53050 level after opening, we could witness an upward rally toward the 53450 mark. If it breaks the 53550 resistance level, this upward momentum could extend by an additional 400-500 points. However, any potential downside movement is likely only if Bank Nifty falls below the 52950 level, which could signal bearish pressure.
