BANKNIFTY : Trading levels and plan for 27-Dec-2024
Intro: Yesterday's Plan vs. Actual
In yesterday's plan, we anticipated critical levels such as the Liquidity Buildup Zone around 51,213 and a potential test of the Resistance for Consolidation Zone at 51,805. The market opened near the expected range, showing sideways movement (Yellow Trend) during the early session. A breakout above 51,568 eventually triggered a bullish rally (Green Trend), validating our target at 51,956-52,072.
Let’s prepare for 27-Dec-2024 with an educational approach to all scenarios.
Detailed Trading Plan for 27-Dec-2024
Gap-Up Opening (+200 points or more above 51,400):
If Bank Nifty opens with a significant gap-up, monitor the Opening Resistance at 51,568. Sustained trading above this level indicates a continuation towards the Resistance for Consolidation at 51,805. A breakout above 51,805 may lead to a rally targeting the Profit Booking Zone at 51,956-52,072.
⚠️ Action Plan: Wait for a retest of 51,568 for confirmation before entering long positions. Early entry without confirmation increases the risk of false breakouts.
💡 Risk Management Tip: For options trading, consider bull call spreads to hedge against a sudden pullback.
Flat Opening (Near 51,213-51,400):
In case of a flat opening, Bank Nifty is likely to consolidate within the Golden Retracement Zone of 51,173-51,213. This zone can act as a pivot for directional moves. A bullish breakout above 51,213 signals upside momentum, while a breakdown below 51,173 may lead to bearish pressure.
⚠️ Action Plan: Observe the first 30 minutes for price action. For bullish entries, target 51,568 and above. For bearish trades, look for confirmation of rejection at 51,173, targeting 50,850.
💡 Risk Management Tip: Use tight stop losses for trades within this zone to avoid getting trapped in sideways movements.
Gap-Down Opening (-200 points or more below 51,213):
If Bank Nifty opens below 51,213, immediate support lies at Last Intraday Support around 50,850. A breakdown below 50,850 may extend the bearish trend (Red Trend) towards the Buyer’s Support Zone at 50,463-50,302. Look for potential reversals at these key levels for contrarian trades.
⚠️ Action Plan: Avoid panic selling at the open. Instead, wait for confirmation of breakdowns or reversals before taking trades. A reversal at 50,463 could present excellent risk-reward opportunities for long positions.
💡 Risk Management Tip: Hedge your positions with put spreads in case of continued bearish momentum.
Summary and Conclusion
For 27-Dec-2024, the focus should be on the Opening Resistance Zone at 51,568 and Golden Retracement Zone at 51,173-51,213. Gap-up and flat openings demand patience and confirmation for directional trades. A gap-down could offer contrarian opportunities at deeper support levels. Always prioritize risk management through proper position sizing and option strategies.
⚠️ Disclaimer: I am not a SEBI-registered analyst. This plan is for educational purposes only. Traders are advised to conduct their analysis or consult with financial advisors before executing trades.
#BankNifty #TradingPlan #TechnicalAnalysis #PriceAction #OptionsTrading #StockMarketIndia
Banknityuture

BANKNIFTY : Trading Levels and Plan for 04-Nov-2024
Bank Nifty Trading Plan – 11-Nov-2024
Intro:
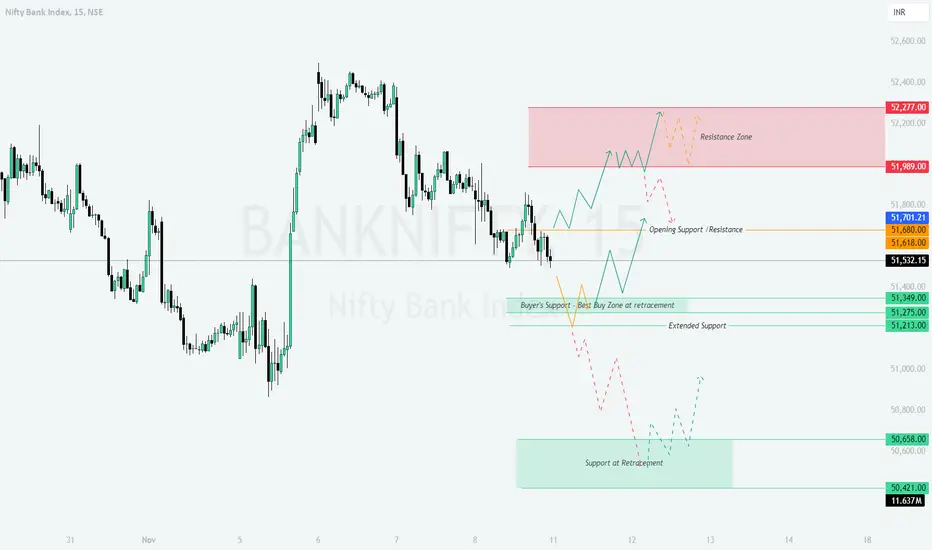
On the previous trading day, Bank Nifty exhibited distinct zones for resistance, support, and retracement areas, giving us a clear range to work with. The yellow trend lines represent periods of sideways movement, green indicates a bullish trend, and red represents a bearish trend. Key resistance is observed around 52,277, while support is at 51,275. Here’s a detailed plan based on possible opening scenarios.
---
Trading Plan for All Opening Scenarios:
Gap Up Opening (200+ Points):
- If Bank Nifty opens with a gap up above the Resistance Zone at 51,989, monitor if it sustains above this level in the first 15-30 minutes.
- Bullish Scenario: A sustained move above 51,989 can lead to a bullish trend toward the higher Resistance Zone at 52,277. Look for buying opportunities on pullbacks toward 51,989 for a potential upside move.
- Bearish Scenario: If it fails to hold above 51,989 and reverses, expect a retracement toward the Opening Support/Resistance at 51,680. Consider short entries below 51,989 with a target toward 51,680 if bearish momentum persists.
Flat Opening:
- If Bank Nifty opens flat around 51,532, wait for the price to stabilize for the first 15-30 minutes before taking any positions.
- Bullish Scenario: A move above 51,680 can trigger a bullish trend with targets toward 51,989. Look for buying entries around 51,680 with support from price action.
- Bearish Scenario: If Bank Nifty breaks below 51,349, expect bearish pressure with targets around the Extended Support at 51,213. Short entries could be considered below 51,349 if bearish signals confirm.
Gap Down Opening (200+ Points):
- A gap down opening below 51,349 could lead to early volatility. Watch if it stabilizes around the Buyer’s Support zone at 51,275.
- Bullish Scenario: If Bank Nifty holds above 51,275 and shows a reversal, consider going long with targets toward the Opening Support at 51,532.
- Bearish Scenario: If selling pressure continues and Bank Nifty breaks below 51,275, expect a move toward the lower Support at Retracement near 50,658. Look for short opportunities below 51,275 with a strict stop loss above 51,275.
---
Risk Management Tips for Options Trading:
- Use hedged positions like vertical spreads to manage risk effectively.
- Maintain a stop-loss level based on daily close to avoid getting stopped out due to intraday volatility.
- Limit position sizes based on your risk tolerance; do not over-leverage.
- Avoid chasing targets; exit around target zones to lock in profits.
---
Summary and Conclusion:
The market structure offers key levels to watch for both support and resistance. Sustaining above 51,989 could signal a bullish move, while a breakdown below 51,275 could lead to further downside. Exercise patience, wait for confirmation around these levels, and manage risk prudently.
---
Disclaimer:
I am not a SEBI-registered analyst. This plan is for educational purposes only. Please perform your analysis or consult a financial advisor before making any trading decisions.
BANNIFTY : Trading Levels and Plan for 06-Nov-2024Previous Day's Chart Pattern Recap:
On the previous trading day, Bank Nifty displayed strong bullish momentum, with significant buying observed around the 51,900 support level. This momentum pushed prices higher, testing key resistance zones near 52,322 and approaching the Profit Booking Zone at 52,900 . The trend areas on the chart are marked with color coding, where Yellow represents a sideways trend, Green indicates a bullish trend, and Red shows a bearish trend.
06-Nov-2024 Trading Plan:
Opening Scenarios:
Gap Up Opening (200+ Points Above Closing Price):
- If Bank Nifty opens around the 52,322 resistance zone, traders should exercise caution as this could lead to profit-booking pressure near 52,534 .
- A confirmed breakout above 52,534 could lead to further bullish momentum, targeting the Profit Booking Zone at 52,900 .
- In case of rejection near 52,534 , look for bearish candles as a sign of weakness for a potential retracement back toward the Opening Support at 52,032 .
Flat Opening (Near Closing Price of 52,105):
- If the market opens flat around 52,105 , wait for the price action near the Opening Resistance at 52,322 .
- A successful breach and close above 52,322 can trigger a bullish move towards 52,534 and ultimately to the 52,900 zone if momentum sustains.
- Failure to cross 52,322 may signal a sideways move (yellow trend) between 52,032 and 52,322 . Intraday traders can trade the range until a clear breakout.
Gap Down Opening (200+ Points Below Closing Price):
- If Bank Nifty gaps down near 51,611 , observe the price action here. This level serves as an important buyer support at the previous breakout structure (BoS).
- A bounce from 51,611 may indicate buyer strength, aiming for a recovery back to 52,032 and higher.
- If 51,611 fails to hold, expect a bearish move toward the Last Intraday Support at 51,373 . This area will be crucial for bulls to defend to avoid further downside.
Risk Management Tips for Options Trading:
- Use tight stop losses, especially in volatile conditions. Adjust stop losses as per volatility in the market.
- Avoid holding options close to expiry without clear direction as time decay accelerates.
- Prefer trading options with sufficient liquidity to ensure better entry and exit without slippage.
- Maintain a risk-to-reward ratio of at least 1:2. Avoid chasing trades and wait for confirmations.
Summary & Conclusion:
For 06-Nov-2024, Bank Nifty’s crucial levels to monitor are 52,534 on the upside and 51,611 on the downside. A breakout above 52,534 may lead to bullish continuation, while a break below 51,611 could invite selling pressure. Monitor the chart closely, as Yellow, Green, and Red trends signal sideways, bullish, and bearish moves respectively.
Disclaimer: I am not a SEBI-registered analyst. The above analysis is for educational purposes only. Please do your research or consult with a certified financial advisor before trading.

Banknifty Intraday (08-Jul-2024)The chart you provided is a 15-minute intraday chart for Bank Nifty with trading levels and strategies for July 8th. Here’s a breakdown of the key points on the chart:
Buy Signal:
-Buy above 52800
-Target: 53200+
Indicated by a green arrow pointing upwards.
Sell Signal:
-Sell below 52400
-Target: 52000-
-Indicated by a red arrow pointing downwards.
Resistance Levels:
-Around 53,213.55
-Around 53,100.00
Support Levels:
-Around 52,587.14 (EMA 20 close)
-Around 52,810.25
-Around 52,395.60
-Around 52,015.85
Current Price:
Bank Nifty is at 52,633.15, showing a slight decrease (-0.10%).

Bank nifty lowerTF trading strategyNSE:BANKNIFTY : what explained here is a very short term trading strategy at lower time frame without using any indicator. It is very low risk high reward trading strategy.
Identify the trend in longer time frame, in this example its 1 hour and trend is bearish. Now switch to one minute time frame
1) - Identify equal highs, the area where price failed to move three or more times. Above the highs will be many buy stops of short sellers. Marked as 1
2) - Allow price to move above and grab all those buy stops. An up candle is followed by many negative candle. This confirms trend resumes to downwards after taking out those stops. Marked as 2
3) - Look for imbalance or FVG ( Fair value gaps) look at the inserted picture in the chart if you don't know what is FVG. Marked as 3 and insert 1.
4) - Place the stop above the FVG box. Marked as 4
5) - Take entry when price breaks below the FVG box. Marked as 5
6) - Profit booking at 15 Minutes TF FVG created on 23.02.23 12.30 pm. Marked as 6 and Insert 2
Will teach you on opposite side trade on another occasion.
Do your home work with older chart data until then.
Good Luck

Banknifty Bulish Expanding & Peanut Banknifty Bulish Expanding & Peanut
Its seen that PCR below 1
USD IBR bulish
Fii strongly Sale Future and buying Option
Indication that should be going upwards for Bulish expanding Triangle if breaks peanut
Range 42700-42500 towards 44000

when all is well, its time to sellyes, we may witness a trending day today because the range banknifty closes on Friday was pretty tight. the cpr is also gonna be not very wide. added to these we have some gaps as well which the market may fill today. overall market sentiments are not that bad, the best way to yourself in the game is to maintain your RRR. remember one thing folks. in stock market
WHEN ALL IS WELL
ITS TIME TO SELL.
Best of luck traders.

Banknifty trade at support.we can take a long position above 30500 level for intraday beacause this is a important level of support and also a 30500 is a psychological level.
