Bullish potential detected for BOQEntry conditions:
(i) higher share price for ASX:BOQ along with swing up of indicators such as DMI/RSI.
Depending on risk tolerance, the stop loss for the trade would be:
(i) a close below the 50 day moving average (currently $7.83), or
(ii) below previous swing low of $7.69 from the low of 23rd June, or
(iii) below previous support of $7.60 from the open of 12th May.
Banks

#AN017: Dirty Levels in Forex: How Banks Think
In the world of Forex, many retail traders are accustomed to seeking surgical precision in technical levels. Clear lines, pinpoint support, geometric resistance. But the truth is that the market doesn't move in such an orderly fashion.
I'm Forex Trader Andrea Russo, and I thank my Official Broker Partner in advance for supporting us in writing this article.
Institutions—banks, macro funds, hedge funds—don't operate to confirm textbook patterns. Instead, they work to manipulate, accumulate, and distribute positions as efficiently as possible. And often, they do so precisely at the so-called "dirty levels."
But what are these dirty levels?
They are price zones, not individual lines. They are areas where many traders place stop losses, pending orders, or breakout entries, making them an ideal target for institutional players. The concept of a dirty level arises from the fact that the price fails to respect the "perfect" level, but breaks it slightly and then retraces its steps: a false breakout, a trap, a hunt for stops.
Banks are very familiar with the behavior of retail traders. They have access to much more extensive information: aggregated positioning data, open interest in options, key levels monitored by algorithms. When they see concentrations of orders around a zone, they design actual liquidity triggers. They push the price just beyond the key level to "clean" the market, generate panic or euphoria, and then initiate their actual trade.
How are these levels identified?
A trader who wants to operate like an institution must stop drawing sharp lines and start thinking in trading bands. A dirty level is, on average, a zone 10 to 15 pips wide, around a psychological level, a previous high/low, or a breakout area. But technical structure alone is not enough. It's important to observe:
Volume density (volume profile or book visibility)
Aggregate retail sentiment (to understand where stops are placed)
Key option levels (especially gamma and maximum pain)
Rising open interest (as confirmation of institutional interest)
When a price approaches a dirty level, you shouldn't enter. You should wait for manipulation. The price often briefly breaks above that range, with a spike, and only then does it retrace its steps in the opposite direction. That's when banks enter: when retail has unloaded its positions or been forced into trading too late. The truly expert trader enters after the level has been "cleaned," not before.
This type of reading leads you to trade in the opposite way to the crowd. It forces you to think ahead: where they want you to enter... and where they actually enter. And only when you begin to recognize these invisible patterns, when you understand that the market is not linear but designed to deceive you, do you truly begin to become a professional trader.
Conclusion?
Trading isn't about predicting the price, but predicting the intentions of those who actually move the market. Dirty levels are key. Those who know how to read manipulation can enter profitably, before the real acceleration. And from that moment, they'll never look back.

BANKNIFTY LOVERS Ready towards 60000 + ?/ ( SHORT TERM IBANKNIFTY 30 Mins counts indicate a bullish wave structure.
Both appear to be optimistic, and this index invalidation number is 56910 ( 30 Mins closing)
target are already shared as per implus move
Investing in declines is a smart move for long-term players.
Every graphic used to comprehend & LEARN & understand the theory of Elliot waves, Harmonic waves, Gann Theory, and tTme theory
Every chart is for educational purposes.
We have no accountability for profit or loss.

$KRE Swing Trade Strangle Call Debit Spread & Put Debit SpreadAMEX:KRE
Bto 6/17/25 3:48pm PDS Jul18 54/53 Paid 0.27
Open BB 8EMA at Trap bearish, with error at the gap down. keep position until confirmation to change trend.
Bto 6/25/25 3:50pm CDS Oct17 69/70 Paid 0.06
Open BA 8EMA , Confirmation pull back , and PBJ 200SMA/200EMA. This day NYSE:C NYSE:BAC Squeeze. More confirmation to go Long.

Direxion Regional Banks Bull 3X Shares | DPST | Long at $84.89In anticipation of interest rates going lower, a large number of regional bank insiders are buying a significant number of shares of their own stock. Such lowering will likely increase regional bank revenue and move ETFs like AMEX:DPST higher.
Thus, at $84.89, AMEX:DPST is in a personal buy zone.
Targets:
$106.00
$120.00

BANKNIFTY - 1 Day Time Frame Analysis📈 NSE:BANKNIFTY - 1 Day Time Frame Analysis
This chart shows a classic Inverse Head and Shoulders pattern forming on the daily timeframe of BankNifty. This is a bullish reversal pattern, generally indicating a potential shift from a downtrend to an uptrend.
Left Shoulder: Formed around April 23rd–25th, marked by a short-term low.
Head: The lowest point in the pattern, formed around May 8th.
Right Shoulder: Formed around May 28th, indicating buyers are stepping in earlier, showing strength.
The neckline resistance lies near 55,913, which the price is currently testing. A decisive breakout above this level, with good volume, could signal a further upward move towards the higher resistance zones like 56,526, 56,907, and possibly 57,292.
Key Support Zones:
55,167
54,791
54,479
Traders may look for a daily candle close above 55,913 for confirmation. Risk management is crucial as a failed breakout may lead to a retest of support levels.
TRADE PLAN:
🔹 Entry:
On a daily candle close above 55,913 (neckline resistance).
Preferably with strong volume confirmation.
🔹 Targets (Upside Levels):
Target 1: 56,526
Target 2: 56,907
Target 3: 57,292
🔹 Stop Loss:
Below 55,167 (recent support and right shoulder low)
Conservative traders can use a tighter stop below 55,400 (previous candle low).
🔹 Risk Management:
Use appropriate position sizing (risk only 1-2% of capital).
Wait for candle close above breakout level, not just intraday movement.
🔹 Invalidation:
If price fails to hold above neckline and breaks below 55,167, pattern becomes invalid.
This setup favors bulls as long as price sustains above the neckline.
Disclaimer: This analysis is for educational and informational purposes only. Please consult your financial advisor before making any trading or investment decisions.

Nat West breakoutClear breakout from 327, which was established resistance since 2016. Inverse Head and Shoulders pattern completed.
Volumes have been ramping up since Feb this year and the shares are not oversold on the weekly RSI yet.
Market likes their results today too.
In my opinion, heading for 400p.
Do your own research and this is NOT a solicitation to hold, buy or sell.

Don't lose hope on the Thai banks!Staying range-bound over the past 4 years, SET:BANK is now showing a change in behavior. Hugging around the upper bound, SET:BANK looks ready to break out

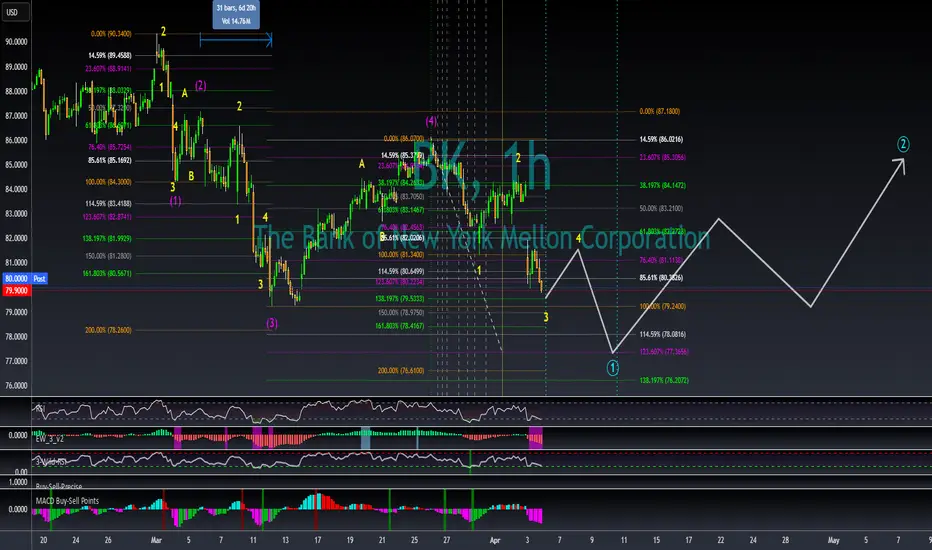
More downside for BK?My overall thesis is we are in the very early stages of a multi-year decline ultimately with the S&P 500 below 3500. I am estimating this symbol to be in wave position SuperCycle 2, Cycle A, Primary 1, Intermediate 5 and around the end of Minor wave 3.
The overall target bottom for Intermediate wave 5 and simultaneously Primary wave 1 is below Intermediate wave 3's low of 79.2315 from 12 March 2025. A movement extension to target is 78.00738 (114.59%) or 77.3584 (123.607%) and is depicted by the far right levels and percentages. Intermediate wave 3 was 31 trading hours long. The application of Fibonacci percentages to 31 trading hours is displayed by the vertical lines. The green vertical line represents the start of wave 5. The solid yellow line is 31 bars (100% of wave 3's trading hours). 161% and 261% are the light blue dotted lines thereafter. The current target bottom is around midday on 10 April.
If we are currently in Minor wave 3 of Intermediate wave 5, the target bottoms are 80.2234 (114.59%) or 79.5333 (138.197%) and depicted by the middle levels and percentages. The hourly chart is currently in the middle of signaling wave 3 which likely means we are looking to finish Minor wave 3 with today's close or within the first hour of trading tomorrow. As of the open tomorrow Minor wave 3 would only be 13 hours long which is shorter than wave 1. This likely means Minor wave 5 will be 13 hours or less whenever it begins.
I will begin more specific calculations on Primary wave 2's top once we finished Primary wave 1 likely next week. The very preliminary estimate if Primary wave 1 ends around 11:30 on 10 April would have seen Primary wave 1 last 198 trading hours and drop nearly 13.00 points. Primary wave 2 could top around 85.38 around 7 May.
KRE Regional Banks In Trouble?KRE is starting to scream Danger! Wave 3 up ending. Multiple head and shoulders (one massive) the current uptrending is now starting to CRACK! signaling that the right shoulder will now start to form.
I see no benefit for bulls to hold on as risk is now very high. Furthermore, this is a bad sign for the overall economy and markets as regional banks are US domestic. Bad JUJU!
Don't be a dick for tick! ))

2025 ICT Mentorship: Premium & Discount Price Delivery Intro2025 ICT Mentorship: Lecture 4_Premium & Discount Price Delivery Intro
Greetings Traders!
In this video, we dive into the fundamental concept of Premium and Discount Price Delivery—a crucial aspect of smart money trading that helps us understand how institutions approach the market with precision and efficiency.
Understanding Currency Pairs
Before we explore premium and discount dynamics, it's essential to grasp the basics of currency pairs. A currency pair, like EUR/USD or GBP/USD, represents the value of one currency against another. For example, EUR/USD shows how many U.S. dollars (the quote currency) are needed to purchase one euro (the base currency). Just like any other tradable asset, currency pairs fluctuate in value due to various economic and market factors.
Trading Is Part of Everyday Life
Believe it or not, everyone in the world is a trader. Whether you're buying groceries at a store or negotiating for goods and services, you're participating in trading activities daily. Some people aim to purchase items at a discount, while others can afford to pay a premium—it’s simply part of life.
However, banks and financial institutions take trading to another level. They don’t just trade haphazardly—they operate with extreme precision, aiming to make high-quality investments by executing trades at premium prices and targeting discount levels. This strategic approach allows them to capitalize on market inefficiencies and ensure profitable outcomes.
Why Premium and Discount Matter?
The concept of premium and discount price delivery is foundational for understanding how the market moves. By recognizing where the market is trading at a premium (overvalued) versus a discount (undervalued), traders can make more informed decisions and align their strategies with institutional order flow.
Stay tuned as we break down how to identify these zones on a chart and how to incorporate them into your trading strategy. Make sure to like, subscribe, and turn on notifications so you never miss an update!
Happy Trading,
The_Architect

Banknifty New Low Banknifty going to touch new low soon , then after going upward till then i am not bullish ,this is my view .

$NYSE:WOLF - analysis of annual cot levelsPlease remember that this idea does not constitute investment advice.
NYSE:WOLF
After a personal analysis of the institutional value of the COT, buy and sell program levels are outlined. Since the asset is at its minimum, the idea is to wait for the price to head inside the buy program, wait for a swing to form in the direction of the target level (the first sell program) and open the trade at the break of this. The position is medium-term (from 1-2 weeks to 1-2 months); without financial leverage and the maximum profit area is that outlined by the sell program. Personally I do not use stop loss as the trade does not involve the use of financial leverage, however if a level for the stop loss were to be identified, this would be below the buy program.
For any clearly ask me.

GBPTRY long biasHey guys.
I just found a demand pcp on gbptry D1.
Most likely price would test it and it will remain valid unless we don't get another demand level.
Destination is top supply area.
Stick with it 👍

JPM JPMorgan Chase Options Ahead of EarningsIf you haven`t bought JPM before the breakout:
Now analyzing the options chain and the chart patterns of JPM JPMorgan Chase prior to the earnings report this week,
I would consider purchasing the 245usd strike price Calls with
an expiration date of 2025-1-17,
for a premium of approximately $5.05.
If these options prove to be profitable prior to the earnings release, I would sell at least half of them.

TFC Truist Financial Corporation Options Ahead of Earnings If you haven`t sold TFC before the regional banks selloff:
Now analyzing the options chain and the chart patterns of TFC Truist Financial Corporation prior to the earnings report this week,
I would consider purchasing the 40usd strike price Calls with
an expiration date of 2025-1-17,
for a premium of approximately $3.85.
If these options prove to be profitable prior to the earnings release, I would sell at least half of them.

MBSB Cup & Handle Formation in the MakingShort term MBSB could be heading to support area around 0.700
If Cup and Handle pattern forms, TPs are the greenline marked on the chart.
Dividends have been good from this stock, plus it's a Banking stock.. with interest rates stable and potentially going down from here, loans are going to be cheaper and banks profit will grow Q-on-Q. It's also one of the only two Banking stocks that are Shariah Compliant.
I am looking to add position at 0.690 (support area) and keep it on my portfolio long term.

XRP - Roadmap to $3Hello TradingView Family / Fellow Traders. This is Richard, also known as theSignalyst.
📦XRP has been trading within a large range, bounded by two round numbers, $2 and $3, forming a symmetrical triangle.
Last week, after rejecting the lower boundary of the triangle, XRP turned bullish in the short term.
For the bulls to maintain control and regain the long-term trend, a breakout above the red trendline and the green structure is required.
Such a breakout would target $3 as the initial objective. 🎯
📚 Always follow your trading plan regarding entry, risk management, and trade management.
Good luck!
All Strategies Are Good; If Managed Properly!
~Rich

BAC Bank of America Corporation Options Ahead of EarningsIf you haven`t bought BAC before the recent rally:
Now analyzing the options chain and the chart patterns of BAC Bank of America Corporation prior to the earnings report this week,
I would consider purchasing the 47usd strike price Calls with
an expiration date of 2025-2-7,
for a premium of approximately $0.89.
If these options prove to be profitable prior to the earnings release, I would sell at least half of them.

$BAC Trade AnalysisThe daily chart for BAC shows a downtrend within a broader bullish channel. The recent price action has broken below critical short-term moving averages (8 EMA and 21 EMA) and is currently testing a key support level at S1 (43.05). The chart includes pivot points, trendlines, and dark pool activity, which provide additional context for potential price movements.
Key Observations:
1. Trend Analysis:
Uptrend Channel: The long-term green trendline remains intact, suggesting the broader uptrend is still valid.
Short-Term Downtrend: A lower high (LH) and a series of bearish candles indicate short-term downward momentum. The price is below the 8 EMA and 21 EMA, confirming bearish bias in the short term.
2. Support and Resistance:
Resistance Levels:
Pivot (45.87): The first resistance level, aligning with the 8 EMA.
46.24: A significant resistance level near the 21 EMA.
47.00: A dark pool level that may act as a ceiling if price rebounds strongly.
Support Levels:
S1 (43.05): Immediate support and current price zone.
40.95: Historical support level, providing further downside protection.
S2 (38.60): A critical support zone aligning with dark pool levels and prior lows.
3. Volume Analysis:
Recent volume spikes on red candles suggest distribution, but the bounce on the most recent green candle (December 20) indicates potential accumulation near support at 43.05.
4. Dark Pool Levels:
47.00: A dark pool print from December 5, marking potential institutional resistance.
39.70–39.49: Significant dark pool activity from earlier in the year, which may act as a magnet if price continues lower.
5. Moving Averages:
The price is below both the 8 EMA and 21 EMA, indicating bearish momentum.
A recovery above these moving averages would signal a potential trend reversal.
Trade Setup:
Scenario 1: Bullish Reversal from S1 (43.05)
Trigger: A strong bounce off S1 with price reclaiming the 8 EMA (~45.36) would confirm bullish momentum.
Profit Targets:
45.87 (Pivot): First resistance level and a key target for a short-term trade.
47.00: Dark pool resistance level.
48.08: The upper range of the recent downtrend and potential long-term target.
Stop-Loss: Below 42.50, as a break below S1 invalidates the bullish setup.
Scenario 2: Bearish Breakdown Below S1 (43.05)
Trigger: A daily close below 43.05 with increased volume would signal bearish continuation.
Profit Targets:
40.95: Previous low and historical support.
39.70–39.49: Dark pool levels and a strong institutional support zone.
38.60 (S2): Key pivot support for a deeper downside move.
Stop-Loss: Above 44.50, as a move back above this level would signal recovery.
Scenario 3: Consolidation Before Directional Move
If the price remains range-bound between 43.05 and 45.87, traders can look for breakout trades in either direction. Volume and candlestick patterns will be key indicators.
Final Thoughts:
Short-Term Outlook: Watch for price action at 43.05. A bounce with strong volume would favor a bullish trade, while a breakdown opens the door for further downside.
Long-Term Outlook: The green trendline suggests that the broader uptrend remains valid. A deeper pullback into dark pool levels (~39.50) could offer long-term buying opportunities.

Could South Korea's Currency Crisis Signal a New Economic ParadiIn a dramatic turn of events that echoes the turbulence of 2009, the South Korean won has plummeted to historic lows, breaching the critical KRW1,450 threshold against the US dollar. This seismic shift in currency markets isn't merely a numerical milestone—it represents a complex interplay of global monetary policy shifts and domestic political dynamics that could reshape our understanding of emerging market vulnerabilities in an interconnected world.
The Federal Reserve's recent "hawkish cut" has created a fascinating paradox: while lowering rates, it simultaneously signaled a more conservative approach to future reductions than markets anticipated. This nuanced stance, combined with South Korea's domestic political turbulence following President Yoon Suk Yeol's brief martial law declaration, has created a perfect storm that challenges conventional wisdom about currency stability in advanced emerging economies. The won's position as this year's worst-performing emerging Asian currency raises profound questions about the resilience of regional economic frameworks in the face of complex global pressures.
What makes this situation particularly intriguing is the response from South Korean authorities, who have deployed sophisticated market stabilization measures, including an expanded foreign exchange swap line of $65 billion with the National Pension Service. This adaptive response showcases how modern economic management requires increasingly creative solutions to maintain stability in an era where traditional monetary policy tools may no longer suffice. As markets digest these developments, the situation is a compelling case study of how developed economies navigate the delicate balance between market forces and regulatory intervention in an increasingly unpredictable global financial landscape.

BTCUSD Wyckoff Accumulation Phase completedLets assume that the strength in the US dollar wont last for too much longer, as Central Banks try and work out how many more trillions are needed in the system.
The BTCUSD had been in a trading range for some time and this week we convincingly left it, with a big dose of Bullish price action.
Will it last? IDK. I am long BTCUSD so I am fundamentally in the Bitcoin 🚀 camp so I am also talking up my own book.
However, if we look to Wyckoff and transpose his teachings on the stages of the accumulation phase, we get quite a convincing outlook to the upside.
It could all be down to the fact that we see what we want to see, or it could be a run on the banks to the crypto-sphere.

JPM Leg 2?After a massive consolidation breakout, we are seeing a picture perfect ascending triangle forming,
Above $248 , $250 will come quick
