TSX Financials Inside Week Inside MonthI am leaning on the month eventually going 2 to the downside here and opening some further selling throughout the financials sector.
Correlation to the 10 year yield has been spot on for months now pay attention to see if it continues.
Would buy the dip if we see a nice pullback
Banks

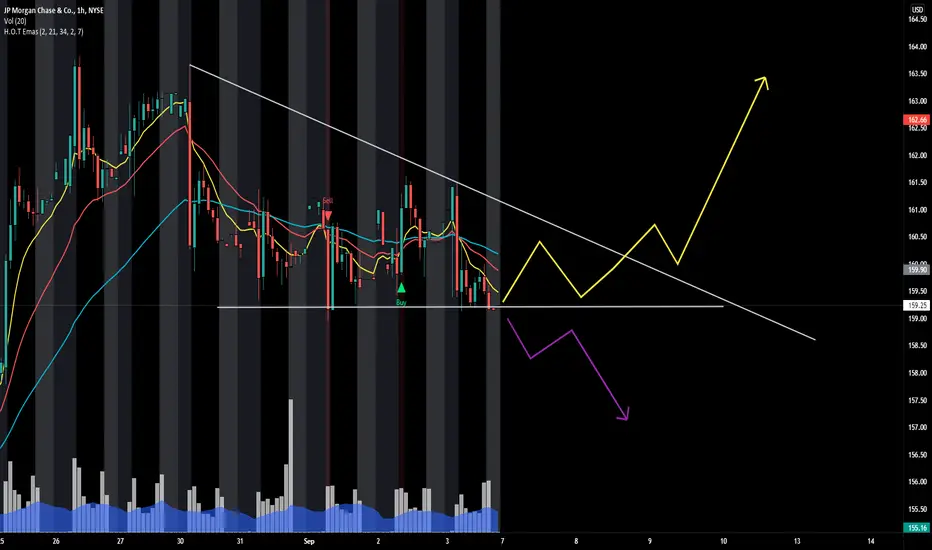
JPM make it or breakGreat opportunity on JPM
Sitting at support from this triangle, if banks continue to be weak this week, there is a chance it will lose support and have a leg to the downside,
Another possibility is a breakout to the upside targeting ATH
Short BankniftyExact Reversal from Fib Retrachment Level ,
Also Breakdown in Symeetrical Traingle Pattern
Bought Some Put Options in Bank Nifty @ 36800 Levels
SL is 37200 And Target 36200 and 35950
Lets See What Happens on Monday
HAPPY WEKEND! 😊

BITCOIN SHORTS - we will need to fill the imbalance before.A nice pull back into the imbalance before a rally down. All analysis looks to sells. If price decides to move down, we will definitely see a low be broken before looking for buys.

$PYPL | WEEKLY WATCHLISTBasing very nicely after quite the pullback from the highs which looks healthy. This week, we can potentially see PayPal confirm upside if we can break above key resistance level shown. Looking for an impulsive move up to the $285-288 region. My fractal is denoted in the light blue candle pattern and lines up with my bullish thesis nicely. Just something to note.

EUR/USD | Institutional Analysis | Quasimodo PatternOn weekly timeframe, a potential liquidity could float below the double bottom. This is the most likely target. A continuation Quasimodo set up detected on Daily timeframe, so if we believe on our target we could grab the sell opportunity as described on charts. Additionally, we can find an internal liquidity, an extra reason for the market makers to push the price lower.
This opportunity seems to be safe as continuation with a strong target closely below.
Feel free to write your opinion on comment section.
Stay tuned with our ideas for updates and more opportunities!

EURUSD LONG - EQH created on a 1 hour order blockNo signs of stopping bullish momentum. equal highs created will be looking for entries on the 1m

Historic event timeline (single page) Mostly I tried to get the major events on one page;
decided to get 2021 on it's own - rest of the info going back to 2013
Zoomed in 2021 chart;
Just interesting to see this on a timeline and thought it was worth sharing.
See educational content below in the related ideas section.
Disclaimer
This idea does not constitute as financial advice. It is for educational purposes only, our principle trader has over 20 years’ experience in stocks, ETF’s, and Forex. Hence each trade setup might have different hold times, entry or exit conditions, and will vary from the post/idea shared here. You can use the information from this post to make your own trading plan for the instrument discussed. Trading carries a risk; a high percentage of retail traders lose money. Please keep this in mind when entering any trade. Stay safe.

Institutional Analysis: Too many retailers runs on profits1. Overall there is a downtrend in the market. So, we are looking for continuation.
2. Too many fresh buyers comes into play. This a sign of short term reversal.
3. Too many retailers runs on profits. This is strong sign of short term reversal.

Institutional Analysis: Strong Manipulation on Strong Support The price reached the institutional candle. Many sell banks positions will close resulting in a strong reversal.
The most demanding traders would expect the price to approach as close as possible to the low of the institutional candlestick, but even now the entry gives a good risk / reward and the stop loss keeps us safe from a break of the double bottom that has formed.
Trade is in the direction of the trend of larger timeframes, so it is considered safe although small timeframes are considered reversal.

EUR/USD SHORT ANALYSISdaily time frame rejection in this area with long wicks (exhaustion)
looking for a massive drop this week.

Institutional Analysis: Daily on crucial zoneDaily timeframe has already broken the area of liquidity below the low of April and has shown a slight upward mood.
We must pay attention to the two lows of Autumn because if the market does not intend to return to these areas, it will certainly break this zone to collect massive liquidity. The trade at this point is quite risky with not so good risk / reward.
The best idea is to let the price get as close as possible to the aforementioned lows so that our stop loss can be placed in such a way that a break does not take us out with the mass of retailers who have placed pending orders just from below.
After the entry we should pay special attention to the red dangerous zone in which is the institutional candlestick that gathered the positions from above. At this point there are open buy positions which the banks will try to close by creating a rather small retracement. Maybe a very small partial could be justified.
The trade should reach the target relatively easily in the first half of September.
Related Ideas Link has the same analysis from monthly perspective.

Institutional Analysis: Price on crucial support zonePrice approaching crucial zone. A confirmed manipulation has already formed at the top of the range, that means that the price have to return to that level to let banks get rid of losing positions.
The fact that August breaks the previous lows means that a potential manipulation lurks. This is an extra reason to believe that the price will raise soon.
However, the lows of September and November can offer plenty of liquidity to banks. Trade now is risky, but if the price goes down we will be able to place our stop loss below these lows to stay safe even from an eventual break - and take profit below the level that bank will start selling their open positions.
Keep in mind that reversal is always risky, but the impressive reward sometimes justifies the pluck. You can drop timeframe to find the correct moment to jump into the reversal. Risk/Reward ratios is around 1:7. Risk recommended to be no more than 0.5% on reversals.

$BLK: The Undisputed Heavy WeightAs we look forward into the future we may continue to see Blackrock's influence grow from an asset management company into something far greater. With deep pockets and potentially blue skies for the market along with a rising rate environment, we'll see if $BLK can get it done in the weeks / months / years to come.


$XLF Financials failing at resistanceThe XLF ETF which tracks the financial sector of the U.S market has been battling to break resistance at $37 and the 50 day moving average. With the push lower in yields, fundamentally this is generally quite negative for banks and financial firms as this substantially decreases their profit margins.
We could potentially retest the bottom of the range at $35.00 and if that breaks then $33 could be in site which is around the 200 day moving average.

ES 4450 Late Chasers will be lit up: 4250 - 4150As Volumes begin to dry up and Seasonality begins to take hold as Euphoria
morphs quietly into "Fear" the ES will begin a large retracement.
Globex has been another Low Volume affair with the Retail Chasers continuing
to BTD with diminished conviction.
The chart remains in a Bull Trend, with extreme divergences.
We are preparing for a very nasty 10% correction, followed by another 9% @
minimum.
Ideally, and it is far too early to know - 3600/3800 Range should reduce the
appetite for the ES as Financials continue to fall apart.
Cohesion in Banking has been extraordinary. I have been an Chemical/Chase/JPM
Customer since 1991. This morning I received a notification from CHASE in which
they informed me I had not used my CHASE Credit Card in over 9 months - Citing
a lack of activity against a Large Revolving Line of Credit.
American Express, Member since 1991 - has dropped my credit score internally
from 835 to 717. The reason - an undisclosed Line of Credit, which I do not have.
My LOCs have not been reduced, although they appear to be creating causation.
Interesting times indeed for Money Center Banks.

BNKS ETF BEARISH topping patternOverall technical elements look toppy on US BNKS.
A head and shoulder pattern has emerged and RSI remains sluggish below 50%.
However, we are seeing a mid-term wedge/range develop - with some minor RSI divergences emerging. Short-term bounce risk.
Suggest to sell any rebounds into the zones closer to highlighted resistances in purple.
MACRO => Given the flattening in the US yield curve - it makes fundamental sense for US banks to struggle as their margins will get squeezed.

JPMorgan to $80 by October 2022NYSE:JPM
Jamie Dimon and his army of minion traders at $JPM are printing the classic bear pattern of a H&S top (green). Measuring that formation, that should put us at a local bottom sometime in October.
From there I would expect the Santa Rally to be our retest of the neckline, before creating the base of the much larger H&S pattern in yellow. Measuring that pattern out gives me my price target of $80 when it is all said and done by October 2022.
And yes that is a price gap at $110 (purple box) that I expect to be filled in these moves.
- Penny

ICICI Beautiful Cup and Handle PatternICICI Bank is Forming Beautiful and clean Cup and Handle Pattern - 15% Gain expected in a month.

Expiry Blueprint for tomorrow BANKNIFTYWe take three possibilities and try to explain the expiry day for tomorrow


FXCM USBANKS Basket Hourly Rally in Longer-Term WeaknessFXCM's USBANKS basket is in the bearish area on the daily chart on the left. The basket is an equal weighting (20% each) of JPM, BAC, WFC and C. A bearish cross of the EMAs and stochastic potentially align short-term traders with the daily. If signals occur, movement of stochastic to 20 level and maintenance of that level increase the chances of a successful trade. Trend following indicators may be useful in this case as a potential exit tool. Stop above hourly high in conjunction with risk management techniques.
