Capital Liabilities @ Money Center Banks - JPM, CITI, WELLS, BOADeposit gains were concentrated @ JPMorgan Chase, Bank of America, Wells Fargo
and Citigroup.
Liabilities expanded dramatically faster than smaller, Regional Banks throughout 2021.
The government's Fiscal Policies unleashed Trillions of dollars to support small businesses
and individuals via stimulus checks and unemployment benefits.
There were mass bailouts of Industry, enormous amounts of money was given to Corporations.
As you can see from the Chart above - growth was extraordinary as hoarding among individuals,
and corporations reached a peak until very recently.
JPM, CITI, WELLS, BOA made it clear additional deposits (Liabilities) were NOT welcome.
Their answer - go pound sand in Money Markets. Effectively there is no sweep as Short Term
T-Bills are unavailable.
Why herd Cash into a Corner? No one puts baby DX in a corner.
Apparently they do and did. It's not for good either.
At a time when Banks are attempting to bolster their balance sheets, call in loans on consumer
lines of credit, reduce mortgage lending, auto lending and revolving debt lines... the pushback
clearly demonstrates the lack of Tier 1 collateral.
Apparently that is not Cash.
Let's see if they can get a big chase going in Equities and entice some willing Cash into the Big
Casino. Given the Value proposition - TINA.
There is always an alternative, we simply crossed the Rubicon long ago with respect to common
sense and a willingness to enforce the "No".
Banks

M2 Money StockWe are witnessing a Crisis on par with LTCM, similar to the Russian Bond collapse.
The Reverse Repo pool can be used in Net Effect to raise Rates.
"Net" as it has another insidious component to it - Money Markets will again come under duress as the DX moves below Par at 100 Basis.
Money Market Funds are seeing large inflows as Primary Institutions are telling Corporate Depositors to stop placing Liabilities on their Balance Sheets (Deposits are a Liability) - Interest Rates are relatively low for Money Market Accounts.
We are watching a liquidity crisis begin to unfold. Wells Fargo cutting off personal loans - banks will be in trouble beginning in August.
Loans are how Banks profit.
The moratorium of eviction and mortgage defaults is lifted on July 31st.
Defaults on loans are assured. Wells Fargo calling in all personal loans now in order to buffer the approaching defaults.
When cash in Banks is reduced - the ability for Banks to weather a series of defaults is impaired - the impairment only serves accelerates the liquidity crisis merely weeks away.

NEW UP WAVE FOR BANKS .I myself have now gone net long 90 % ALL BANKS for what lloks to be the start of wave 5 up into late july to mid aug peak

ASCENDING TRIANGLE IN HDFC BANK!!TREND:-WEEKLY-BULLISH
DAILY-BULLISH
WE HAD GOT A BREAK FROM THE MAJOR TRENDLINE IN DAILY TF!!!!
-NOW FORMING A GOOD ASCENDING TREIANGLE IN THE DAILY TF
-WE ALSO GET TO SEE A FIB SUPPORT OF 0.382 IN REECENT TIMES

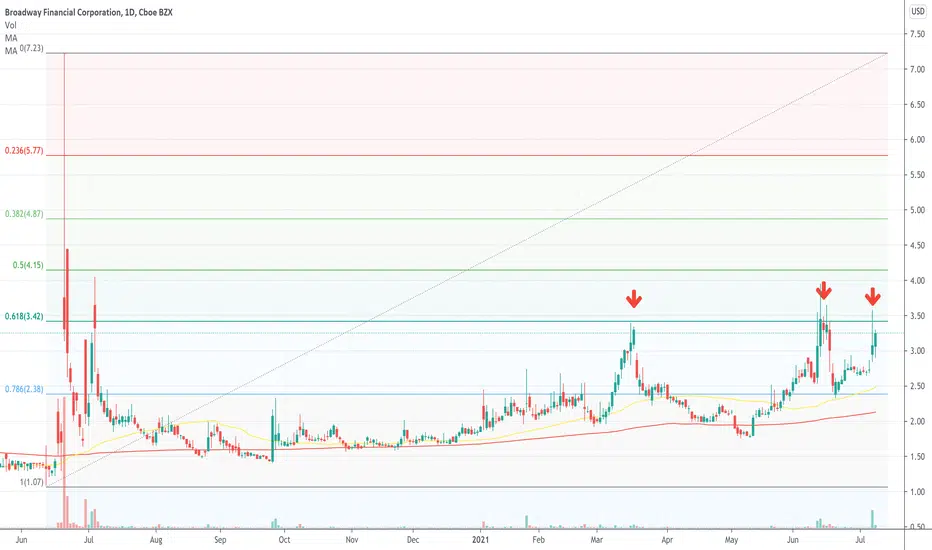
BYFC in a familiar place right nowBYFC has been doing well, obviously, there's no denying that. However, it has approached another key level that is clearly seen on this chart. The 618 fib has been a constant level of resistance ever time BYFC climbs this high, over the last year. So this week, volume is likely going to be the potential driver of direction. Will it finally leave the 618 fib in the dust or is history about to repeat itself again?
"In the past five days, shares of BYFC stock have shot up by over 12%. In the past six months, shares have shot up by a solid 53% or so. The main reason behind this solid gain is the overall housing market continuing to rise in value during this time. And as a company that is heavily correlated to the real estate market, BYFC is worth watching if the price of homes continues to rise. So, considering all of this, will BYFC stock be on your watchlist moving forward?"
Quote Source: 7 Top Penny Stocks to Watch That You Probably Haven’t Heard Of
BAC - Double bottom on dailyHappy saturday traders! Next week, we have a load of bank earnings and we start off with BAC and WFC tuesday morning. Here's my thoughts on BAC: Double bottom pattern on daily TF and put/call ratio of .76 . On Friday, 3800 38.5 7/16 calls were bought during the day. Options are looking for a 3.5% implied move. GL! I will post a WFC analysis later!

2nd Day Testing Fib Resistance On LMFALMFA has some pretty well established levels if you look beyond that one big spike earlier this year. With the 786 fib line showing to be a strong pivot, the stock has stalled twice now, failing to hold above this level. It was strongly denied this week and looks like the follow-through momentum just isn't there to finish out the week. However, bigger picture the stock is still significantly higher than where it was in late May .
Remember what Bruce said in that first ER:
“Revenues from our community association receivables business declined as we continue to develop a digital asset technology strategy to unlock the potential of this business...We expanded our core business of buying discounted debt and collecting it through court proceedings with the Borqs transaction. We entered the Borqs transaction projecting to net $2 million and we were pleased to realize a $5.7 million return.”
Quote Source: 4 Crypto Penny Stocks to Watch Under $5 Right Now

Fifth Third BankI chose this ticker mainly due to XLF reaching under the 50% stochastic zone (Currently 44%). The previous day was at 61%. This told me that I could possibly find a support on a stock within the sector. It just so happens that the IWM (Russell 2k) dipped down to 28%. During the middle to end of May the highs touched near the resistance price of $43 about three times. The previous high was broken and the current low hasn't broken the strong support "yet". Looks like a W pattern is setting up for a retracement up to 61% of the previous high. This company seems like a damaged company that has valuable growth. That's just my honest opinion.

A Success Tunnel for 360 DigiTech: Business TransformationChina's outstanding loan balance reached a fresh record of CNY 172.75 trillion in 2020 and keeps growing, spurred by the increasing digitalization and booming e-commerce market.
In China, 2020 was a milestone year for fintech. The year saw heightened regulatory scrutiny, intensified competition and business patterns were altered by the COVID-19 outbreak, both in the corporate and consumer sectors. The Matthew effect in the industry has been further exacerbated under such circumstances, where small-sized companies with less capital or poor risk resistance ability will be forced to quit the stage.
Although 360 DigiTech, Inc. (QFIN:NASDAQ) is a late starter, it is one of those niche players able to stand up to this fierce competition, mainly due to the reputation of its parent company – 360 Security Technology, Inc. (601360:SH) which brings significant brand visibility to the table.
Strong performance with low valuation
This USD 6.57 billion company is currently outperforming what the market expects. On May 27, 360 DigiTech released its unaudited financial results for the first quarter of 2021. The total net revenue increased by 13.1% to CNY 3.6 billion (USD 0.55 billion) from CNY 3.2 billion in the same period of 2020, while the non-GAAP net income reached CNY 1.41 billion (USD 0.2 billion) with an astonishing increase of 452.8%. The operating income along with the account under the non-GAAP measure achieved a growth of 745.7% and 533.0%, respectively.
However, given this relatively strong financial performance, 360 DigiTech's P/E ratio appears to have been lower than that of its peers for a long time, although it is currently ranked the highest among the top four. Lexin (LX:NASDAQ), a leading online consumption and consumer finance platform, is also using technologies to encompass risk management and loan facilitation systems, just as QFIN does, but its P/E ratio is far higher than that of QFIN. For example, in the third quarter of 2020, Lexin's P/E ratio was more than 5 times that of 360 DigiTech; by Q2 2021, Lexin was lower than 360 DigiTech for the first time, at the level of 8.1. Along with the progressively upward stock price, the necessity of re-assessing 360 DigiTech is becoming more obvious.
How the asset-light business model works
360 DigiTech is one of the earliest platforms in the industry to proactively initiate the transformation of reducing the proportion of self-operated loans and improving loan facilitation. This turned out to be an informed decision.
In the third quarter of 2019, 360 DigiTech first proposed its new strategic target for adopting the 'capital-light,' or more commonly as 'asset-light' business model. More colloquially, this refers to the company directly navigating the borrower to their cooperative financial institution, while collecting service fees from credit evaluation, credit management, or other technical-related services.
According to the published unaudited financial results of 360 DigiTech for the first quarter of 2021, the total loans originated by financial institutions were CNY 74.15 billion, of which CNY 37.25 billion (50.2%) was under an asset-light model and other technology solutions, achieving an astonishing increase of 211.9% over the same period in 2020.
Haisheng Wu, CEO of 360 DigiTech, stated that "...over 50% of the loans were facilitated under the capital-light model and other technology solutions..." and it is a "fundamental change to the nature of our business, from being capital-driven to technology-driven."
The highlight of this model is that as a loan facilitator, the company is not required to inject any margin for each loan. In other words, the credit risk of the asset-light business is borne by the capital; the loan facilitator is thus riskless. Besides, it can better respond to regulatory requirements and resist the impacts of uncertainty on business stability.
Moving further towards 'tech'
In policy terms, the tightening regulatory rules pose a little impact to loan facilitators like 360 DigiTech – even as fintech giants like Ant Group and JD Digits may suffer – as its targets are excess leverage and systematic risks. It creates opportunities for 360 DigiTech to jump a queue. The asset-light model is hence the core strategy of reducing the regulatory and credit risk. Besides, QFIN is trying to use less capital and more technology-powered services to open up more opportunities, both in terms of client acquisition and risk management.
The improved portfolio quality, as indicated by the relatively low delinquency ratio, was one of the contributors for its shining performance even in the special 2020, although it showed an upward-trending slope for the period during the epidemic. However, it seems reasonable: due to the lag of loan repayment as well as its timeliness of statistics, the negative effects of China's -6.8% GDP in 2020Q1 only started to appear in the second quarter of 2020, causing a history of high non-payment ratio of 2.82%. Up to date, the company's delinquency ratio has nearly risen back to the level before COVID-19, and we will keep an eye on its future performance.
Moreover, with a few innovations and technologies, for example, Argus RM Model, Intelligence Credit Engine (ICE), Cloud Bank System, Cosmic Cube System, Apollo Platform and AI Robots, 360 DigiTech is working hard towards the 'tech side' of the fintech business as well as being technology partners with banks. The strategic collaboration with Kincheng Bank (KCB) is a good example.
The bottom line
360 DigiTech's asset-light model works well, and it has the potential to pay off from the long-term perspective, which brings further expectation for its growth prospects. The company's business expansion plans are proceeding with KCB as the first step. These strategies will further improve the company's flexibility in this competition for market share.


Why do banks have a crisis?Resume
Banks are concerned about the balance of the financial sector, yet it seems to be threatened again and again by the global economic crisis.
The cause of the banking crisis is macroeconomic instability, poor supervision, bad tactics, poor management, inadequate control system, failure of operations and Cheating.
The authorities, whatever the cause, require a coherent plan to face these crises, examine the different points of their administration and make suggestions.
Introduction
The planet seems to be constantly hurt by banking crises of one kind or another. This is how the disadvantages of the 80s and 90s are considered the most severe compared to any other previous phase. In 1996, the IMF (IMF) estimated that about 130 territories had experienced banking crises since 1980, and that between 30 and 40 could still continue in crisis. The case may be improving, but only gradually.
The price for government budgets to solve these crises was quite high and, although estimates vary, there are several examples, in particular an analysis carried out by World Bank scholars, published in 1996, which calculates cumulative prices, expressed as a percentage of the annual gross domestic product (GDP) of each territory.
In the situation of the American crisis, which harmed savings and loan institutions, as well as small banks throughout the 1980s, and until the early 1990s, it has been 2 to 3%, for the Nordic nations, between 2 and 8%, in the crisis of Spain (1977-85) of 17%, in Hungary of 10%, in Bulgaria of 4%, in Mexico from 12 to 15% despite the fact that the figures Mexican officials are lower, in Venezuela from 13 to 18% and in various other cases, which make up Argentina and Chile above 25%.
In several of these, as well as in different economies in transition and developing, and in certain industrial territories, such as France and Japan, efforts are not yet exceeded and prices have the possibility of continuing to accumulate.
Focusing on economies in transition, the International Monetary Fund estimated in 1996 that bad debts of banks fluctuated between 14% and 65% of total assets. Taking into account that a general lack of reserves was recognized and that, to top it all, the published capitalization is often below the minimum 8% recommended by “Basel”, doubts remain regarding the solvency on which the banking system is inspired in several of those territories.
It is clear that the price that solving banking crises means for the government budget directly represents only a transfer in the national economy and does not equal the net real price in terms of losses in social comfort or gains for the economy in your group.
Any calculation of the real price must take into account administrative prices, the consequences of the deviation of macroeconomic policy imposed by the crisis, the probable benefits of avoiding a more serious crisis and the repercussions for the efficiency of financial intermediation by assisting institutions in bankrupt or in danger of it.
Banking has evolved in quite different ways in the different territories, due to a mixture of economic, political and historical causes. For example, the USA and Japan have banking systems that are considerably fragmented, both geographically and functionally, even though their fragmentation is disappearing.
Operations in many European nations have tended to be more consolidated, whether in terms of geography or functionality, or both at the same time. There are developing and developed territories, as well as in each of the previously communist economies, where state-owned banks were until recently the rule.
Today many of the transition economies are characterized by a polarization between monumental banks focused on broad economic sectors, stemming from the initial fragmentation of the banking system, and a multitude of small banks opportunistically established in the wave of liberalization, however in several cases with property or business concentration constructions that often did not comply with the prudential rules of developed nations, and that in a significant number have led to their early bankruptcy or closure. This evolutionary process should move forward.
Exemplifying, even though most of the nations on the planet now remain more or less involved with the term of market economy and with the desire that the State disregard the ownership of the banks or does not interfere in their occupations except the main one for supervisory purposes, there is still a long way to go before those ends are fully achieved.
As the rapid progress of technology will continue to transform or modify certain of the banking processes in all nations and possibly, banks as a whole will continue to move towards new business surfaces.
What distinguishes a bank?
The specific legal definitions of what a bank is, or what constitutes banking commerce, vary from territory to territory. Quite a few people might consider banks, first and foremost, as providers of credit, however this is not what makes banks exclusive, because credit is available from other sources, such as For example, commercial, retail or securitized suppliers in the capital markets. Nor does the granting of credit, by itself, precisely cause banks to be the object of the particular attention of the regulatory authorities, because the wrong choices when granting credits have the possibility of not being a cause for concern, unless the The company that grants the credit is also the one that captures the deposits. It is mainly accepted that the activity that makes banks in a certain sense something particular is the taking of deposits.
Reasons:
- A bank deposit is usually an unsecured capital obligation.
- By effect, it has an intense trust component.
- Approximately, borrowers require resources for longer periods of time than depositors remain willing to grant. Even overdrafts, which technically must be repaid on demand, are generally to be viewed as an almost illiquid obligation. As such, the conversion of terms is a vital aspect for the economic performance of a bank, and is in parallel a substantial source of danger.
- Deposits are money, especially in the sense of transactions: Current or sight resources present, or deposits with maturity in time, which have the possibility of being used in general, and are also allowed as ways to make payments and settle debts to third parties. .
As a result, banks are at the center of the payment system, whose efficiency is essential for the economy in their group.
Role of the central bank and supervisors
Central banks have the possibility of having an interest in the structural development of the banking sector, for 4 reasons:
- The central bank is concerned about the general equilibrium of the financial sector and will wish to supervise banks or ensure that they remain properly supervised by another body.
- Generally, the central bank should also be concerned with the efficiency of financial intermediation, particularly in the banking sector, and although in a market economy it seeks not to intervene directly in the activities of banks, it can nevertheless participate to guarantee a correct infrastructure and competence and excite collective initiatives for the common good. In emerging market economies, the banking area mainly plays a fundamental role, if other capital markets are not yet developed.
- The role of banks to generate money and credit in the usual course of their jobs causes the central bank to have an interest in banking performance from the point of view of a macroeconomic monetary policy:
- Regulatory authorities are commonly delegated to defend personal depositors against losses; in this regard, the power to prevent the capture of unauthorized deposits is also essential. Efforts to defend clients are believed to be justified by:
- The interaction of trust between banker and depositor
- Due to asymmetries in the information
Who supervises?
In certain territories, banking supervision is the responsibility of the central bank and in others, it is delegated to one or more separate agencies.
It is feasible that there are already conflicts of interest between the operation of macro-level monetary policy and supervision: The most common situation is that of a situation in which the fragility of the banks delays the correct limitations or stimulates a decrease in the severity of monetary policy.
There are examples of this case in the USA and Japan and in several economies in transition, but the probable tensions cannot be avoided simply by separating both responsibilities institutionally.
It should be clarified that neither in the USA nor in Japan are banks supervised exclusively by the central bank.
It is also feasible to replicate that the close relationship between the liquidity performance of personal banks and the central bank's money market operations, and in particular the fact that liquidity aid for a bank in distress should be provided by the central bank , require coordination and, optimally, the identification of both responsibilities.
In support of this criticism it should be noted that in many nations where supervision is executed by a separate body, the central bank maintains a kind of supervision department to look at the supervisory body's occupations to take care of any inconveniences that may arise. in support of liquidity.
Either way, the central bank will try at least once to assess its own counterparties should it be called upon to provide liquidity.
On the other hand, coordination must be achieved without resorting precisely to the division of responsibilities between the two areas. Since the supervisory mechanisms for the defense of the consumer have the possibility of being different from those necessary to affirm the general systemic equality, it could happen that these 2 points were entrusted to independent organizations, however, in practice this would also cause coordination problems and duplication.
In many nations the specific functionality of managing a formal deposit insurance scheme is exercised by a separate body, in most cases in the public private deposit area it exists in a few territories, primarily on the western European continent. In such cases, in order to avoid duplication of the regulatory task, the agency may allow authorization from the central bank for a bank or appropriate supervisory agency to qualify for admission to the insurance program, even if It is notable that in certain territories the insurance agency requests additional or duplicate information directly from the banks.
Bank structure
Capturing deposits is perhaps the point where the definition of banking business begins. However
In addition to admitting certain capital deposits adjusted to the liquidity needs of consumers, the classic occupations of banks integrate services to receive payments and operations with foreign currency, the granting of credits for working capital and commercial financing, private loans and certain longer-term investment financing, even though the latter is dependent on the bank's ability to secure long-term resources for itself. Banks also have the possibility of participating in a wide range of other financial or related occupations, such as business with financial apparatus, brokerage, issuance and the similar functionalities of registry and defense services, management of investment funds, corporate financing, collaboration in activities, financial advice, and insurance.
Furthermore, certain banks have the possibility of even wanting to diversify to understand occupations that go far beyond the parameters of finance.
On the other hand, banks manage, by their own choices or as a result of laws and regulations, to specialize in specific occupations or to target specific sectors or areas of the economy.
There are certain components that the authorities have to take into account when determining the occupations that banks will be able to undertake, or the composition that the group banking area needs, in order to:
(1) Regulate financial danger
Diversification can help to dilute dangers, however, it also widens them if, approximately, the new business areas are precisely more risky than the existing ones
(2) Danger of fame
As already noted, there is a danger of general mistrust, once a bank deteriorates and therefore the interests of depositors remain at risk, or if a stampede is shown as a result of financial losses or damage to fame. anywhere in the banking complex, even when it is formally isolated from the deposit-taking entity. Even if the drawbacks emerge in a separately capitalized subsidiary, the whole may find itself forced to commit extra resources to protect its fame.
(3) Banking competition
In certain territories, the desire to promote and preserve competition has influenced the authorities' tactics to develop the financial area, while, in others, efforts to determine competition are more visible and for this reason history shows different results .
In the USA, the limitations in force long ago, barely recently made more flexible on interstate banking, prevented the giant banks, with the probability of expansion, from having the possibility of establishing nationwide networks. The policy was designed to defend small local banks and assumed that competition between them was sufficient.
The bottom line is that progress toward overall bank efficiency was possibly delayed, and the huge array of small banks that proliferated turned out to be quite small and dependent on a fairly small business base to prosper. This caused many of these banks, along with an even larger number of savings and loan institutions, to fail in the 1980s.
The test shows that banking is more efficient in nations that have opened up to foreign collaboration, even though this may come at the cost of developing a truly domestic banking industry. Almost without exclusion, foreign competition and its experience bring benefits and perhaps the most relevant example is the United Kingdom, where London's position as a vanguard financial center owes much to the reception given to foreign organizations over the years. As a consequence, high-volume businesses around the world tend to be dominated by foreign-owned organizations, their participation in retail banking was less important, which represent a precious contribution to the national income of the United Kingdom.
Of course, not all nations have the possibility of developing subjectively gigantic financial sectors in their economies as the Unified Kingdom. What is needed is that financial intermediation is managed efficiently to support the rest of the economy. If the territory does not stand out for a comparative virtue in the offer of financial services, it is better that this is manifested in the rapid availability of superior services, imported if necessary, and that the local economy is subjectively concentrated more in other sectors than in trying to benefit domestic banking through limitations against competition.
(4) Social policy
It was expected that governments would participate or intervene in the banking area, under the framework of social policy, in particular to guarantee a convenient supply of retail services for the whole of society.
This region of participation must be transparent, implemented in rules and without pressure for banks to grant hidden subsidies to the budget or distort market forces at the behest of the government.
In several cases, it may not be economical for the commercial bank to provide basic banking services for all residents and areas.
• Deposit
• Savings
• Credit
• As well as sending money
As usual, it is considered desirable that those services be accessible, the regime is faced with the choice of providing them through public sector institutions, such as the postal system or a government bank, which in most of the old planned economies is a savings bank, either subsidizing private sector banks with the purpose of facilitating those services, or pressuring them to do so in this way.
In certain cases, the regime can go further and not merely fill the gaps that commercial banks do not fill, but compete with them in a wide range of services.
It is feasible that it is difficult to explain against a similar tactic if it is necessary to invest in subsidies for non-profit occupations, however, any mediation should be avoided in the services that the private zone comes to provide satisfactorily. These considerations are also relevant for limited banks
Technological advances, the introduction of cash machines, telephone banking and even mobile banks in certain territories, have the possibility of progressively minimizing the price of providing retail banking services, in which case several of the income inconveniences that they are observed to be eliminated with the time, even though they will remain for a period in some places. As banking habits spread, those who do not have the ability or do not yearn to have a bank account will be at a growing disadvantage.
(5) Industrial policy
In many nations there is a lack of bank financing for long-term investments in specific sectors, for which official mediation is justified. The financing shortage may reflect the general drawbacks banks face in relating loan maturities to deposit maturities, enabling them to lend on a prudent basis. In those situations, would-be borrowers have to seek resources through capital markets or other channels, however the most relevant issue is whether the scarcity of resources merely reflects a market failure in which case official participation can be justified. and be economically possible or if it is really a danger of unproductive credit, where no one should provide resources for the plan or support it through explicit provisions in the government budget.
Specialized banks
As a partial answer to the inconveniences previously exposed in the areas of social or industrial policy, it is feasible that they be created or established.
Specialized banks, which have the possibility of being separated into 2 categories:
- Banks that voluntarily decide to focus on a small number of occupations
- Banks established by the regime or with its support, with the sole purpose of dedicating themselves to certain specific occupations, or that are concentrated in a defined range of them.
The first of these teams does not need particular attention, except that the supervisory authorities have to assert that there is not a high enough concentration of danger, which could harm the interests of the depositors. Certain of the so-called “niche” or “boutique” banks become quite lucrative, however, in the same way, their results have the possibility of being volatile compared to those of more diversified banks.
In the second category, the majority of the cases include state-owned banks that have specific purposes, and private sector banks that have a type of restricted authorization.
The reality and nature of such banks may differ greatly from territory to territory, but they commonly comprise savings, industrial development, agricultural or foreign business banks.
For our own purposes, only 2 examples are inspected:
Savings banks
Savings banks specialize in providing a theoretically safe haven for family savings.
In most cases, they are either centrally or locally owned government-owned banks or private sector banks that operate with various limitations in the allocation of their assets.
Its beginnings lie both in the desire to provide an extensive income of basic banking services throughout the territory, for the aforementioned social policy causes and in the purpose of offering stability to savers through a government guarantee or by a careful asset performance.
The events of current years have refocused attention in a number of territories on the role, present or viable, of savings banks. Bank failures in different market economies have resulted in loss of resources for the tiny saver, or in high contributions of resources from the public sector or deposit insurance funds.
At the same time, the poor situation of the savings banks themselves in many of the previously planned economies, damaged first of all at a macro level, by high inflation, and then, in a number of cases, at a micro level by inadequate diversification of assets. , impoverished savers and proposed serious inconveniences to the authorities.
Those responsible for the regulation of the banking sector have the possibility of being unable to evade inflation, however, they should solve the deficiencies of banking tactics and management. An initiative that is viewed with interest is the implantation of the so-called “limited banks”, which would offer savings and payment services for families and, perhaps, for other small depositors, probably with parameters in the cost of anyone's deposits, in this way, they would be conditioned on the distribution of their assets, which is why perhaps they could only invest in government financial devices or grant loans for specific purposes, or backed by appropriate guarantees.
It is possible that interest rates on deposits were lower than in other banks, but with more stability and it could still be that deposits were openly insured by the regime. Agreements like this are attractive, particularly in territories where there is no confidence in the banking system in your group or where the conditions are not yet correct to implement a deposit insurance scheme.
However, it also has its problems, because deposits will be directed towards limited banks in times of uncertainty and will tend to move away from them in periods of greater security, which would have unfavorable repercussions for the rest of the banking system. Furthermore, if any government subsidy is available, for example, deposit insurance guarantees broader than those available to other banks, there will be unfair competition with other banks. Government obligated financing is occasionally consistent with the purpose of efficient financial allocation for the entire economy.
This suggests that governments should be careful with initiatives in this regard, even when they are sometimes justified by social causes or to compensate for market imperfections in banking.
Of course, every bank should be able, if it wants to, to conceptualize its activity within the borders of a small bank, but the fact that few voluntarily continue that path indicates that such banks have the possibility of not being commercially viable and, therefore, they would require, first of all, any kind of official support.
Industrial development banks
Such banks are established primarily to drive long-term capital formation. It is estimated that the collaboration of the State or organizations around the world is elementary since market forces and the usual limits of prudent banking management are not capable of providing the requested financing.
This approach can be justified if there is evidence of true market failure, or if there is a deliberate choice in government policy to contribute to one or several relevant sectors in this way.
The risks inherent in this approach are that aid will go beyond the parameters of those criteria, with the result that banks compete on disadvantageous terms for deposits, misallocate resources in the economy, or incur losses that they occasionally have to pay for. be absorbed by the whole society through the government budget.
It may not be correct to take into account the establishment of deposit insurance, except on a reduced basis, as long as a precise supervisory system is not established, consequently, the possibility of insurance claims is limited enough to make it actuarially viable. As an essential component, it is much better to support sectors or areas of the economy in the most viable transparent way and with the minimum of external damage to the mechanism of market forces.
This may mean that subsidies, etc., have to come directly from the fiscal budget, rather than being received less visibly through banks, or that, in the situation of interest rate subsidies, all banks are enabled, in some way, to compete in their intermediation.
The chronicle of these banks or banking-type organizations is diverse. One example of great success has been the Development Bank of Japan, which helped finance Japan's economic transition, primarily in the 1950s and 1960s. On the other hand, there are several examples of institutions like these, which failed, without reaching any achievement, however, it is not correct to name particular cases.
Causes of banking crises
The beginning of banking crises can be explained by a variety of causes. Several of them, as already mentioned, have the possibility of being related to the way in which the composition of the banking sector evolves or is oriented. The probable reasons are arranged in this paper, depending on whether they come from macroeconomic situations, microeconomic or regulatory components, bad tactics by personal banks, operational failures in banks, or fraud.
Macroeconomic circumstances
It is not uncommon for banking crises to be attributed to adverse macroeconomic events. In this way, macroeconomic instability is sometimes mentioned as the main source of bank instability, which is initiated by the conjunction of a collapse in the costs of assets, especially real estate, perhaps after a previous unsustainable increase, which At the same time, it may have been stimulated by erroneous macro-level policies or risky banking choices, a sharp rise in interest rates or a drop in the exchange rate, an instantaneous slowdown in the rate of headline inflation, banks mainly prosper along the way. through high inflation, particularly because of seigniorage and monetary illusion, unless the authorities take steps to regain such benefits, or the onset of a recession.
Obviously, all these components remain interrelated. Another source of problems, especially in the transition economies, was the abrupt changes. However, relative costs or the removal of subsidies, which put pressure on specific businesses or sectors in which banks participate.
Initially, bank managers and supervisors should ensure that banks withstand shocks such as these, within reasonable parameters of possibility, even when the question is posed, What is considered reasonable?
Because of this, unless the shock goes far beyond the range of modalities that could be understandably expected, macroeconomic conditions should not be readily accepted as the cause of bank failures. However, the shocks exceed the limit.
Economic politics
This issue includes all structural and supervisory boundaries that are under the direct control or dominance of the government or central bank.
- Supervision
There is a generalized initiative that every bank failure means a failure in supervision, but in other words incorrect.
On some occasions, a bank failure can justly be attributed to failures in supervision, however, almost by definition, it could never be the sole cause, since previously there was a failure in the bank that fled to the proper attention of the supervisor.
Furthermore, if supervision were so strict as to remove all probability of bank failure, banking could possibly be a too repressed and uncompetitive trade, thus failing in its elementary function of providing efficient financial intermediation to the rest of the economy.
Consequently, the authorities have to choose how restrictive and exhaustive the supervisory system has to be to function and the system must, occasionally, for reasons of efficiency and to avoid moral hazard, allow banks to fail.
- Inadequate infrastructure
These are seldom the only reasons for a bank failure. However, deficiencies in accounting or auditing go so far as to hide or delay the inconvenience of illiquidity or insolvency. The bank's consumer accounting failures become as critical as those same errors in the banks themselves. Failures in the legal infrastructure have the possibility of avoiding the exercise of property rights or the commitment and enforcement of collateral guarantees in support of bank loans.
- Liberalization
Deregulation in the financial area can sometimes cause risky behaviors that lead to later inconveniences. This is not an argument against deregulation, but rather a reason to ensure that bank managers and regulators are aware of its likely aftermath and are alert to those that prove to be unfavorable.
Such considerations have the potential to form the basis for benefiting a gradual approach rather than abrupt deregulation, even though in cases like those of old centrally planned economies, the rationale and generalizability of the necessary structural changes have been so extensive that it would not have been possible. gradualism feasible or could have developed new drawbacks. The deregulation of occupations may require more careful supervision to ensure that these are carried out and managed prudently.
certain banking drawbacks emerge or expand as supervision is not preserved at the requested rate.
- Government interference
Government interference in a bank's business, such as orders or pressure to lend to certain: consumers, probably at preferential interest rates, or to preserve or extend unprofitable branch networks can promote or hasten the onset of a liquidity crisis or solvency, or leaving a heavy inheritance in interaction with assets or culture. Other official measures, which have the possibility of being harmful, and which are sometimes shown, integrate the establishment of inadequate reserve requirements, either unpaid or with an interest rate below that of the market and certain obligations to finance the government deficiency, equally in off-market conditions.
- Moral danger
If there is a general initiative that no bank will fail, or if in difficult times financial aid is easily available to banks or their depositors, perhaps to the latter through a deposit defense system too much generous, moral danger is born. Banks come to act in a way that exacerbates rather than improves their situation, and depositors do not bother to discriminate between "good" and "bad" banks, thereby potentially prolonging their survival, but maximizing a crisis, a once in a while it happens.
- Lack of transparency
If, as a consequence of an inadequate legal or regulatory framework, or perhaps only as a cultural aspect, a bank's occupations do not have transparency towards depositors and other counterparties, or even for shareholders, the role of market forces in the decision of the bank's fate and the inconveniences are allowed to develop and multiply to a point that otherwise would not have been feasible.
Banking strategies and operations
In several cases, a bank's drawbacks are caused by deficiencies in its own tactics or by operational failures. It is debatable to what extent supervisors should also be considered as perpetrators for allowing inappropriate tactics to be maintained. Whether the latter are good or disastrous is often only known until after they are applied, and in a market economy it is questionable to what extent supervisors have to intervene. Bankruptcies have the potential to happen:
- From the production side: as a consequence of, exemplifying, erroneous or hasty operations in novel geographical or product surfaces
- On the input side, as a consequence of errors in raising awareness among staff, stimulating a totally new administrative culture, using technological information in a positive way, or functioning and organizing effectively.
Some of the most frequent operational failures are the following:
• Poor credit evaluation
• Exposure to interest rate hazards
• Exposure to exchange rates.
• Concentration of loans
• New areas of activity
• Unauthorized trading or taking positions
• Other faults:
- Low-quality personnel, or with reduced experience, as a consequence of a high turnover of personnel or a fairly rapid increase in trade.
- Poor administrative composition, with inadequate guidelines for responsibility and oversight.
- Impossibility or reluctance to control prices.
- Composition of rewards for the personnel that stimulates the excessive taking of dangers.
- Inadequate documentation, record systems, or audit entries.
- Excessive dependence on information technology systems, without appropriate support, with poor investigation and verification, without secure auditing standards, or without a good understanding of the systems by administrators.
- Absence of contingency plans to confront external or internal emergencies.
Fraud
I think I do not need to describe what causes this would produce a banking crisis in the bank itself.
Actions to prevent or resolve banking crises
Systematic.
The central bank's primary concern should be the equality of the financial system and not the survival of a particular bank. The effects of the feasible bankruptcy of a bank, make up a factor to be determined at the moment. On some occasions, the threat of a credit restriction, that is, an inordinate resistance to lending or attracting new resources, and concern about its macroeconomic consequences, also justify mediation.
Depositors' interests
In most nations, along with concerns about systemic equality, authorities recognize obligations to depositors, particularly retail depositors. To some extent, these have the possibility of being supported by deposit insurance, even though it is probably not effective or advisable to try to grant them to banks that do not comply with prudential standards, or in territories where supervisory systems do not yet have a satisfactory degree of confidence.
Liquidity
Generally, the central bank agrees to provide some liquidity support if it considers that we are talking about a temporary need and that internally the bank is solvent. However, in the exercise the lack of liquidity becomes merely a sign of imminent insolvency, by the way, insolvency can sometimes anticipate the lack of liquidity, even though it may be difficult to assess the true situation at the first moment in which help is requested.
Furthermore, a bank may one day find itself illiquid and therefore unable to continue to be without support, as long as in a longer-term view it is solvent, perhaps for a longer term than consumers and counterparties in the market. market remain willing to consider. The authorities have the possibility then to justify the custody of the bank for an extended period, although in a realistic way it is, more often, for its orderly liquidation and not for a resumption of occupation. The central bank can grant a certain cost of liquidity without incurring a credit risk, through its current mechanisms in the money market or through adaptations, such as: the purchase of securities, loans with collateral or releasing reserve requirements
Authority
To avoid or prevent a crisis it is essential to act with speed. For this reason, it should be specified who is responsible for its operation in most cases, however, not constantly, the central bank, and the aforementioned body, should have sufficient authority to adopt and implement elections, or be able to manage and carry out to conclude each of the elementary consultations, exemplifying, with the Ministry of Finance in the shortest period of time possible. It is also recommended that the public know the principles and conditions of participation, in order to avoid erroneous expectations and any subsequent complaint that the founded policy does not have consistency.
Confidentiality
It is essential that, where feasible, the central bank acts without any publicity to avoid, exemplifying, the spread of panic. This need may need to be determined, on one section, and the rights of depositors or the public to the information, on the other. Keeping the secret on the spot should not mean that the authorities are not the cause of your activities.
Acceptance.
If the central bank should intervene in support of a bank, it will have to have a clear initiative of an occasional exit, be it through liquidation, absorption or rehabilitation of the same or another measure that is considered correct. There is a problem if the bank is deemed huge or critical enough to allow it to fail, because the authorities could be faced with a virtually unlimited obligation to support it.
Limits
Except in extreme cases, the central bank commonly wishes to restrict its mediation in any banking crisis, in terms of specifying the public price, in order to avoid the assumption of unlimited support and the consequent moral danger.
Expense recovery
Support operations are affecting central bank profits or the government budget if aid is given directly from the budget or from the central bank's own resources, but with a viable reduction in the net transfers of its profits to the budget. Ideally, the framework for such financial arrangements is permanently in effect, so that the support operation is not delayed once it is elementary.
Conditionality
The central bank may insist that its support be conditional on the injured bank taking numerous steps to improve its systems, change its strategic direction, change its managers, and so on.
To some extent, this could be considered as part of the banking supervisory capacity, and also essential for the central bank to have a correct exit
Where feasible, any series of conditions should include incentives for the bank to rectify and improve its performance
Conclution:
Having already seen this, do you think Santander has repaired any of this since the 2008 crisis?
If several Banks do not begin to solve their personal problems, it is likely that in the economic crisis that can be generated today, it will cause the shares of these banks to begin to fall. Although of course there is always the possibility that some government rescue them.
Use any technical analysis, it will also validate the short. I don't need to explain any more reasons. The possibility of making an operation in CALL and selling its devalued shares in the hypothetical case that the economic crisis that several stock investors bet happens. In addition, the risk of loss would be small. Indicate the prices to take into account in a short operation. Greetings :).

CITY UNION BANK NEAR BREAK OUTCUB is nearing a triangle break out. Volumes are also coming. Watch out for this level, it can give very good movement in the coming days.

ASX:CBACommonwealth Bank, one of my safer stocks to watch.
With an uptrend that felt like it would never end, we finally have a good buying opportunity on our hands.
Uptrend and downtrend are both coming to a squeeze on a support/resistance line.
Looking to buy in around the $98 support if price holds.
Otherwise letting it drop and hoping to get in at the $87 support line.
DYOR
I hope this helps someone

Expiry Range for tomorrow BLACKLINESWe expect that the Bearish Character made today would be reflected tomorrow with above ranges to consider for the expiry strategies.

$GS to 391 extended target for the month of JunePlay for June opex. GS to 391 extended target. Set stop loss at 362.
Pennant formation

BTC/USDT SHORT...BITBAY:BTCUSDT
Like I already told you. DONT LAUGH AT ME...
I mentioned that I WILL NOT DO ANYTHING :) and you laughed at me. But it is okay.
Hope we will do better now and help each other and send me a more informative criticism not just bullsh^t comments.
I am here to share these trades
I have been telling you not to do anything unless we are close to that 30K wall. We need to hold that wall and or we will fall if we don't.
The only mistake i did with you guys is I DID NOT let you make aware that we will face a huge fight of FUDs and Official news even tho it is old.
This is not Bear Market (prolonged) this is just place we need to retrace from a raging heights from 10K to 30K to 40K back to 30K to 50K to 64K and we are here.
Still fvvck the government. Let's not say things about race. Government are one and their goal is to control us. Real Democracy is Decentralized. This is the time we can own something finally don't sell your BTC to the whales and bad whales. They will really buy it.
my techanalysis is still the same for the last week. I am the only consistent. I wont change. we are still shorting this then take profit to safe coins then move those short profits at buying more good project coins...
HODL wallet I have is...
$LTC $BTC $ETH $ADA $LINK $DOT $BNB

possible Head n Shoulders on JPM dailyPossibly head and shoulders may be forming on the D, we recently seen distribution before this sell off. Volume and price action will give us a better look. What do you think?


Straddle on expiry 34800 and 35000Banknifty is in tight range the expiry can be a huge rally or a fall , neverthless a calculated risk for being around 34800 can be expected to be executed.

Sector early indicator? Yes, Banks often are.The Banking sector, a sub-sector of the Financial sector - here represented by NASDAQ Bank Index (BANK , in green) - often acts as an early indicator against the broader market (here represented by the DJIA in gray, and the NASDAQ in black)... falling from peaks: as early as from 1998, in Feb 2007, steadily declining from Jan 2011, continuing underperformance from July 2018, and in Dec 2019.

Banknifty FUT can be boughtPositional Call: Buy BANKNIFTY fut near 35228 tgts 35990/37300 SL: 34455
Bank Nifty future seems to be trading in strong upside channel. Recently it has pinched a low exactly at support and interestingly low coincides with 3 candles recently at same levels. With yesterdays close it gave birth to morning star pattern which is confirmed today with a new high compared to yesterday. So overall biased for longs.

The 10-year UST yield breaks its supportThe 10-year UST (nominal) yields seems to have broken on the downside, despite slightly.
If this movement were to continue, then the main winners would be :
- US government bonds: over the short term only.
- Precious metals and stocks in this same sector, which react positively to real yield drops. Indeed, like nominal yields, real 10-year yields dropped from -0,79% to -0,84% in one day.
However, the main losers of this new downside dynamic for yields would be banks, which benefit from a steeper yield curve (i.e. banks like when the difference between short-term and long-term rates increases)

