Banks


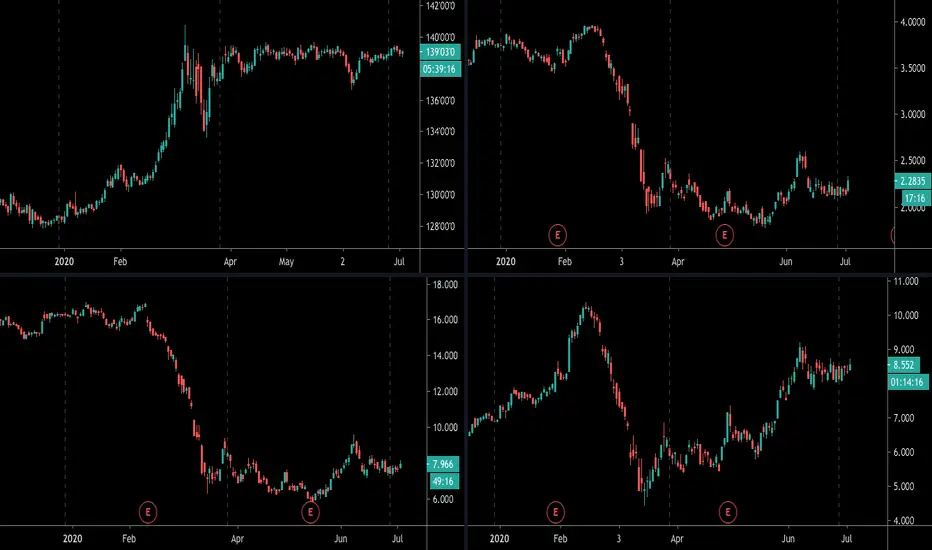
Boeing, United Airlines, Retail and Regional Bank ETFsWhat do all of these have in common from March 15th 2020-June 9th 2020?

Head and Shoulder on BNBank nifty has formed Reversal Pattern H&S with right shoulder little skewed to upper end but the neckline break signifies a trend to downward is possible for the coming days and weeks.

IF a GAP Down opening on MONDAY on BNif we get to taste a GAP down on monday and on 2M chart we get confirmation of bearish price action then a sudden free fall can not be avoided in BN. Do keep yourself watched!

JPM 115posted a chart like this previously. Looks like a bull flag. Held well above 95. looking for that 100 break and then free run to the next resistance. Alerts are set. Banks are never going to fail so.... :)
long calls though

GS Goldman - Where is it heading?We are at ascending channel but key support area we break down further out of the bullish moment - we will have the bears come out...!
Now, I was very bullish on banks overall - even when they had there earnings. For this moment time technical aspects lets concentrate - if we go further below our next support area would be: 193 - 188 areas & Resistance areas would be: 219-225 areas.
Go through lower time frames once direction is confirmed, you could even add alerts to your charts or if you're feeling very confident add orders in.
Enjoy - have a great weekend.

We are in an unprecedented fiscal experimentEconomic downturns are usually accompanied (and perhaps prolonged) by a tightening of private credit, as you can see on this chart of S&P 500 performance vs commercial and industrial loans from all commercial banks. Lending significantly lags stock market performance, but a downturn in lending generally confirms a recession, and an upturn in lending generally confirms a new bull market.
This time, however, is different-- at least in terms of the initial response. The rapid downturn in stocks was met with a huge spike in new private lending, encouraged by massive Fed liquidity, and the recovery of stocks was as sharp as the initial selloff. Now, however, lending has turned back downward, and it's possible that over the next year we could see the same tightening of credit that usually accompanies a recession. The Fed can increase bank reserves, but it can't increase borrowers' collateral or their appetite for risk in a difficult economic environment.
Does this downturn in private lending, like the previous ones, confirm that we're in a recession and that stocks will slide from here? Will the next upturn in private lending signal that we're back in a bull market? Only time will tell, but the results of this experiment will have huge ramifications for both policymakers and investors for decades to come.
Hat tip to @TayFx for help constructing this chart. Also check out his cool charts of SPX vs. M2 money supply and Fed balance sheet:

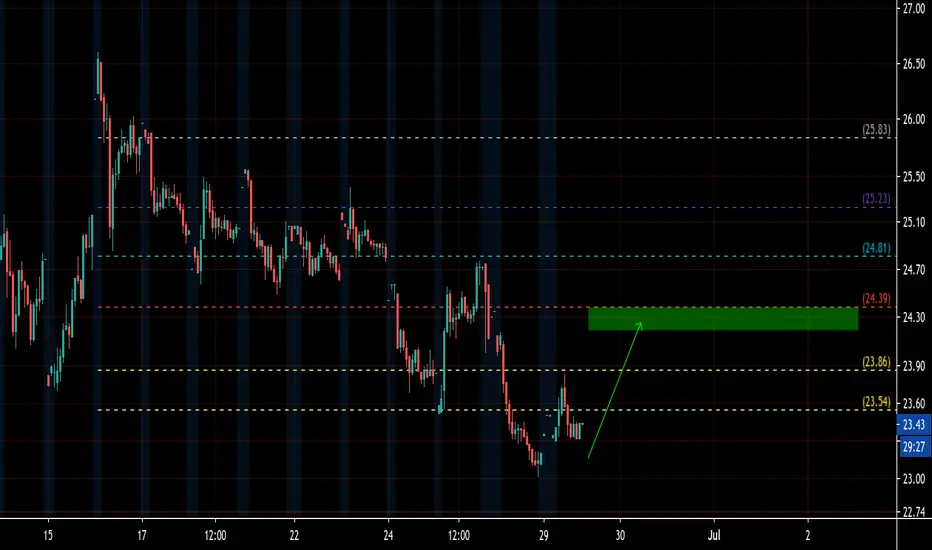
Watch this trend line for signs of a banking sector recoveryThe financial sector's technicals are looking more bullish after earnings week, with the MACD above the signal line and the price above a volume support. Banks reported mixed financial results, with sales 4.3% above Street expectations, but earnings 3.3% below Street expectations. The earnings came in weak mostly because banks set aside big piles of cash to guard against future loan losses. So overall, the reports were quite strong and banks look better protected against the coming solvency crisis.
I expect the narrative around banks to remain somewhat negative anyway, with CMBS delinquency rates up 3x in 3 months to 10.32%; Moody's downgrade-to-upgrade ratio near the highest ever; residential mortgage forbearance up to 8.7%; and the annualized corporate default rate higher than the 2009 level. These numbers appear to be worsening every month.
However, any news of stimulus from Congress could allay solvency fears for the near-term and send bank stocks into a new uptrend. Banks have currently made a downward-sloping trend line from their February peak, and with stimulus likely to be announced by the end of July, I think we're likely to see a move upward through the trend line this month. I don't know that I'm prepared to invest a bunch of money in bank shares with the narrative so negative right now, but August 31 calls on XLF at the $24 strike look like a reasonably low-risk gamble, especially if we get a trend line break. (I'd consider taking a real, long-term stake in XLF shares if it retested the $20 or $18 levels.) A couple ways to play this would be to alert the trend line and enter after a break, or to alert the supports at $23.50 or $23 and enter when it hits those supports. You'll get better prices on option calls if you buy the supports rather than a confirmed break of the trend line, of course.
(P.S. Goes without saying, but this is an idea only and not investment advice.)

Banknifty on the path of Break and make Its a happy short covering since last two days in the BN however a sense of confusion will evade only above the pink box (large). We will take Sell of Call options above this area aggresively and on Monday can witness retracement to test near term support level.
Follow us on twitter and Tlgm

Citigroup looks undervalued, but too risky to enter hereI did a deep valuation analysis on Citigroup today, digging into their earnings reports for the last three years as well as analyst estimates for the next 4 quarters. Here are my conclusions.
In forward P/S terms, Citigroup is nearly the cheapest it has been in the last three years. However, in forward P/E terms, it's nearly the most expensive it has been in the last three years. The valuation in P/S terms may be more important, because analysts expect the earnings numbers to climb steeply back up to meet the sales numbers within a few years. (Roughly 23% earnings growth rate expected in the next 4 quarters, and nearly 4% growth rate for sales.)
However, there are risks. Analysts are predicting a steep drop-off in sales next quarter due to the pandemic's impact on consumer credit, which is sharply down. Then they expect sales to recover from there. However, an alternative scenario is that the pandemic is prolonged and we don't get a vaccine this fall, in which case credit might continue to deteriorate and Citigroup's sales might fall off even more steeply in Q4 than in Q3.
I'm also worried about the outlook for the mortgage market. Current housing prices are artificially high, but there's a reckoning coming for residential real estate whenever Congress allows mortgage forbearance to expire. (Expiry is scheduled for August 31, but there's talk of extending it to next year.) If forbearance is extended, then renters and borrowers may not pay, which would hurt bank earnings. If forbearance is allowed to expire, then housing prices will fall and mortgage sales numbers will fall with them. Banks would seem to be in trouble either way, and I'm not certain analysts have accounted for this.
Thus, I will not be entering Citigroup here. I expect the narrative around banks to remain negative for the next quarter as bankruptcy and default rates continue to rise and credit continues to deteriorate. There's a good chance we will retest the bottom near $36/share sometime in the coming quarter; if so then I will revisit the numbers on Citigroup and consider an entry there.
(P.S. It's also worth pointing out that under normal market conditions, Citi's sales and earnings appear to grow linearly in dollar terms, which means that growth decelerates over time in percentage terms. In other words, Citigroup is not a compounder. That's reason enough to only trade this stock, not buy-and-hold for the long term.)

JP Morgan $JPM$JPM is still in bearish channel even though it is just above the 50SMA which is good sign for future trend. I would expect to hold above $115 before get in.
12 months Consensus Price Target: $111.99
if you find my charts useful, please leave me "like" or "comment".
Please don't trade according to the ideas, rely on your own knowledge.
Thx

Metro Bank seems primed for news break out. It affirms the June record accumulations. First breakout from June close support, without gap market interference. This could be a very good month in MTRO

JPM 115Looking at a triple bottom finally confirmed. Broke out of its downtrend channel and never broke previous lows. Volume picked up a little bit on Friday. Premiums above 100 are also pretty cheap. Will watch at the open. They have earnings as well. Idk how its going to look but we will see.

BAC - Long - Nice upside already in process NYSE:BAC
Here you can see the move has already begun on the 30M chart with a nice hit on the daily trendline u see at bottom. It may break over tomorrow or give us a nice entry if it opens down tomorrow. Stay tuned.

BAC - Long - Potential upside soon! We already formed bullish divergence and another may form if we open lower tomorrow with a potential 3rd bounce on TL for the push up. I'd keep my eyes peeled open on this one and other banks. NYSE:BAC

Letting the Banks do what the Banks want to doBoom. Entering London Session. Im pretty bullish on this pair for the time being. DXY is shooting so its only right for this pair to drop. Im expecting for the banks to push price against the trend and then continue pushing up. I have a fib zone drawn on the four hour in which price is currently in. My entry is near the .618 zone as well as a QP. Hopefully price is pushed down this low because id be very confident in this entry. I have a pretty small first SL in the case that I enter the trade and if I am wrong. This is definitely a trade I feel I should take. We shall see.

In a weakened banking sector, Credit Suisse stands outI've just finished reading through Moody's analysis of Friday's Fed stress test of banks. Honestly, a lot of it was over my head. However, from what I can tell, it looks like Credit Suisse may be the best positioned of the big banks to weather this crisis. In the Fed models, CS survived with more Tier 1 capital than any other bank, beating most of them by a wide margin. CS also has little exposure to loan losses. Here's the link to the Moody's report:
www.moodys.com
CS looks attractively priced at 8.53 forward P/E and 0.6 PEG. Its Starmine Equity Summary Score is 9.9/10, meaning that analysts widely regard the stock as a "buy." I'm generally bearish on banks as we head into the July earnings season, but it looks like this may be a gem in the rough, a quality company that's been unduly punished along with the rest of the sector.

COALINDIA's Black MagicCoal india is poised to test the sell zone however it is also heading to test the cluster POC from where a stark selling pressure can arise. Good to sell PE options in the stock

SIAULIU BANKAS (SAB1L)Hi,
Strong support 0.27 - 0.31
Technical criteria:
1) Previously worked strong support level (2009)
2) Fibonacci retracement 62%
3) Fibonacci Extension 162%
4) 50% drop from the recent high
5) Minor trendline
Regards,
Vaido

Bank of America small relief rallyafter a massive dump, believe we see a small rally and then another leg lower.
Ugly Chart and Bad Fundies for BanksExpecting something like this to play out with KRE (regional banks). So many headwinds for banks going forward, even if we avoid any further Corona problems (big if), we are expected to be in a zero or negative rate environment for years to come. Just look at what happened to Japanese and European banks under those conditions for long timeframes. It's not pretty.
Plenty of room to the downside after breaking through the primary wedge support line. Next stop looks like $33 area. Would expect some sort of bounce there before resuming downtrend to test the march lows.
Position:
12/18/20 25p
Would reassess if genuine reflation and growth begins in the economy. Long duration on the option so even if next move in stocks is upwards I plan to diamond hands these.
