Banks

XLF gonna hit new high XLF sees strong momentum on Tuesday trading and there's support @22.85. Trump's policy will benefit the financial sector anyway and we are expecting to see a pullback+bounce back to previous highest level and break through into a new territory!! Wait for the pullback to build the portfolio.

Ending of the Goldman Sachs rallyGoldmans Sachs had a great really from November 2016 until now. The chart is moving sideways now and shows singular sell signals . The investors are less modifying their $GS positions. They make themselves ready to close their position. The sideways chart shows irresoluteness about their actions.

RBS potential to reach 99$ price areaFor your long swing account. You will have many opportunities to add more to the trade so still once reaching 1:1-or-more ratio remember to consider taking profits to remove your risk.

short XLF @ 15 min @ trading capability for this 52nd week `16This is only a trading capability - no recommendation !!!
Next wkk i`ll confirm or change my opinion about this SetUp :)
Buying/Selling or even only watching is always your own responsibility ...
Best regards
Aaron

Nifty Targets 7250 Nifty is at Upper Channel Line, Dollar is Still Above 102, US Markets looking weak, Bear Trend is Intact if we look at magnet, BankNifty/Nifty is breaking below. BankNifty Will Under perform and Drag Nifty Down...

BankNifty @ 8000 Fundamentals -
1.. High Deposit Rate, Low Credit Growth
2.. NPA Crisis
3.. Low Intrest Rate = Low NII
4.. Scams in Banks
5.. Property Rates Going Down
6.. Global Sell Off Imminent
Technicals -
1.. Second Mountain + Head & Shoulder in Weekly
2.. Magnet Crossing Below

Bearish US Financials $XLF $KREYield curve is flattening with each rate hike as the short term floor is hiked higher. Not a stable environment for better loan growth. These are the leaders, do people really expect a hand off back to FANG?

BAC overbought by way too much!!!I'm shorting this big time on Monday. This rally has been nothing but started from speculations and headlines. Reality will hit soon.

BAC next stop 23.45?Since we keep moving higher I identified a flag pattern on the daily and 4H chart. Now we are breaking out of it and the next move should be equal to the flag pole which ends at 23.45. Personally I don't trade that kind of pattern but maybe someone of you guys out there is looking for some short to medium term targets to take profits. I am still looking for 27.50 longterm though (see previous post)


Short GS again! KEEP buying powder dry to add (scenario below)HUGE OPPORTUNITY FOR AGGRESSIVE, WELL-FUNDED TRADERS. Start Shorting today Tues 12/6 and keep shorting if you buy off on scenario below. I feel this is now a rare opportunity - but hold onto your Tums bottle all the same. GS is 231 with 20 mins. to go today, and it's been holding - but in a narrower range than usual. The RSIs (especially the default 14 pt IA AND HAS BEEN OBSCENELY OVERBOUGHT and it has ben my experience that the longer this RSI remains over 80, the harder and choppier the fall. Macd has signaled - as have the oscillators .
I love trading GS and made one short reco last week which worked out well in the first hour of trading. We are setting up for another pullback for the following reason: the stock has gone parabolic (you do not need me to tell you that!) and parabolas have two sides! Why so much gas in Goldman? Aside from Goldman Grads being in just about every federal and world banking arm, they surround the presidents - and Goldman kicks ass in their bond trading department -- WHEN there is bond volatility. Indeed, this year is setting up for that positive aspect for GS, along with huge deals and the obvious deregulation spark that lit up the financials. Goldman stands to have a great year - but we are a tad ahead of ourselves here - for a logical reason, but it is far from a fundamentally or technically sound reason...
But this insane run since the election may have started on fundamentals - but has shifted to Window dressing by the big retail Mutual Funds(at this moment - AND I FINALLY sense the gas drying up). Am I brilliant? Clearly not - but I have noticed a shift in IBD's "New Buys (by the top 1/3rd best Mutual funds )- and out of 99 funds active in GS, over weeks it has gone from mostly buying to now - out of 99 funds - 55 buyers and 45 net sellers. The smart nimble guys got in and took as much as a 50% upside bite ( or chomp) and now are taking profits and getting the hell out.
The stock has garnered so much attention, the remaining "big boys" who cater to the masses are just dressing up positions for the one time of year when their investors may actually look at the positions carefully - and managers don't want to be asked why or how they dont own GS -- God forbid. BUT BUT BUT..
Today, with the market firing to the upside several times - Goldman has stopped participating - where practically every other day , a few points in the S&P translated to points in GS as funds wanted in before losing more upside potential. Today, however, was important in that a few analysts changed their targets (I think one guy revised his from 189 to 245). HSBC came out and initiated with a 250 target. THIS SAYS THAT EVEN THE LATECOMERS TRYING TO SHOW A GOOD RESEARCH CALL ARE NOT SEEING MUCH MORE UPSIDE HERE.
Start building put positions by whatever style you use - but I would suggest leveraging the hell out of 25% of your trading money on this by rolling into the front week in the < $1.00 range. Use the rest for put or call spreads or whatever your style is -- but the spreads have been especially lucrative when you anticipate the premium deflation that results when the next week becomes the front week (a long way of saying do this on Friday close or Monday 1st 30 mins and you will make money 4 out of 5 times in this environment. I would keep a couple of near positions - and i have built positions out as far as 4 weeks.
It is remotely possible - and I say remotely - that Goldman holds up until the first of January. Hell - they could be doing a deal and decide to prop themselves up as much as possible because stock is currency somewhere in some enormous transaction - with Goldman, strange things definitely happen behind the curtain. But everything i see points to some real heart-thumping pullbacks once the pullbacks start - we could see some amazing jolts of easily 10 to 20 points, on multiple occasions, so trade them all individually if possible) on the downside, so try to hang in. Good luck


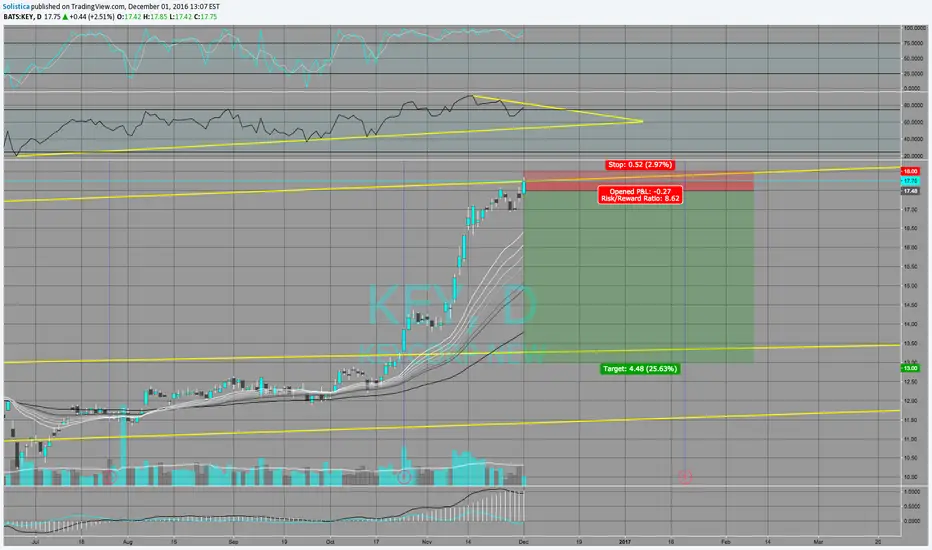
KEY Bank OverboughtLooking very overbought here from this recent Trump Bump, looking to profit on the re-trace, if there is one. Opportunity is here, if it breaks out, could be a good long, if it reverses here, could make for a fantastic short.
Great Near Term Short for Citi GroupRSI is starting to go through the roof, and Williams VixFix is significantly weakening. Almost everytime this has happened since early last year, it pullsback.

Short article on USDCADUSDCAD, 1 Hour.
Elliott Wave - suggests corrective waves (we're basically at the end of the B leg at the time I'm writing this), it might form an advanced pattern to go short. But nothing is complete yet, I'll update this topic when I see changes in the market.
News - RBC (Royal Bank of Canada) as well as other banks changed their mortgage rate (they actually increased it) and investors might not like this, causing a small devaluation of the canadian dollar. According to these news, the pair would do a upward move.
USDollar - We can also see that the US DOLLAR INDEX (DXY) is going up and almost touched a 14-year old high today (November 16th). So theorically, the value of the USD is increasing, and the value of the CAD is decreasing a little bit.
I might go for a short-term LONG position, from B to a little bit higher than A, than take profit (SL just below 5). But to be honest, with the USD going up and CAD going down, I think the currency rate won't be so good for Canadians. (USD/CAD going up on a long-term).


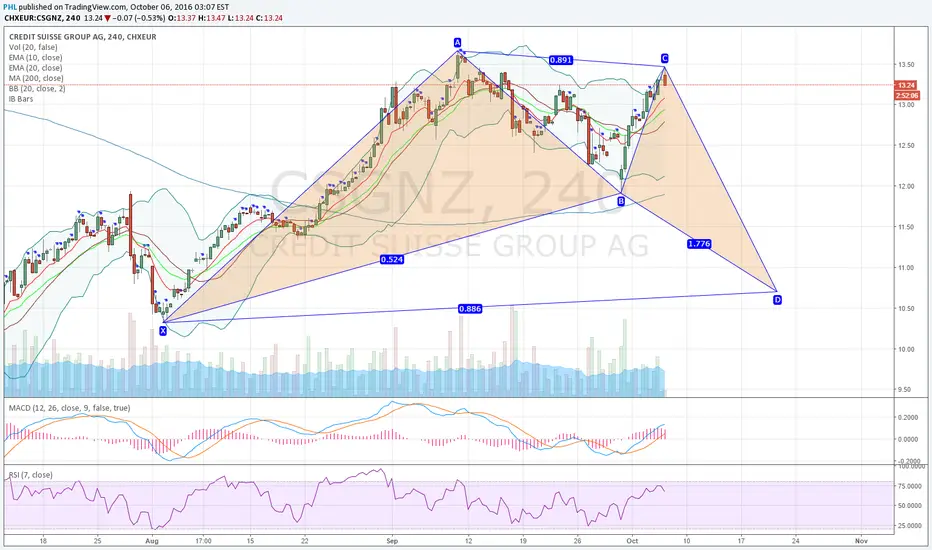
CSGNZ Credit Suisse potential bullish bat pattern on 4Hbuy CHXEUR:CSGNZ @ 10.70 (this idea is for the shares listed on the Swiss Stock Exchange)
UBSGZ potential bullish advanced cypher pattern on daily chartbuy @ 12.20 which is the D-completion of this bullish cypher pattern (please note: this idea refers to the CHXEUR:UBSGZ shares on the Swiss stocks exchange)


#UNICREDIT - NEXT EUROPEAN BANK WITH A BREAKOUTUnicredit is the next European Bank to stage an impressive base breakout. EU Banks are at a turning point, outperforming, and have a lot of catch-up to do. Technicals look great. Unicredit appears to move into a vacuum and I see immediate upside into 2.75/.77
I'm a chart analyst, not a fundamental analyst, but here are a few thoughts what could drive EU Banks outperformance. Fundamentals continue to look awful, however there are a few tailwinds from:
- bank CEO acknowledging structural weaknesses (DBK CEO y'day)
- serious consolidation talks
- FED rate hikes
