$BAC Moon Shot to next Target $28.00?With the 9, 20 & 50MAs above a
key resistance line does that
bode well for BAC?
We would say yes!
Bankstocks

$HSBC Possible small bounce then heading lower??Maybe there is nothing to it but
you bounce off the 200MA 3 times and your out!
Off the cliff you go!

WELLS FARGO ($WFC): Are They Gonna Send this Back to the 1800's?✨ New charts every day ✨
Like, Comment & Follow to help the community grow 🎉🎉
---
Depressing revenue and earnings predictions and a potential dividend cut aside, it is hard to justify shorting the big banks. Despite this, Wells Fargo's chart looks particularly bearish. While it is likely WFC will preform well in the future, it looks like for now this company founded back in the 1800's is about to get sent back to the 18.00's or lower. Given that, let's look for a short setup.
Resources: www.earningswhispers.com + www.marketwatch.com
---
1. Fractal Trend is showing a downtrend (Maroon bar color) on the Daily timeframe chart. This makes sense given how the big banks have struggled in terms of share price while dealing with COVID.
2. With this strategy, we are looking for short setups in a downtrend and as such want to enter short on retests of bearish order blocks plotted by Orderblock Mapping (Maroon) and/or bearish S/R levels plotted by Directional Bias (Maroon).
3. As you can see, we are close to getting a short entry from the strategy at R1. The goal here is to see a rejection of this level and continuation to the downside.
4. The target for this move is S2, although we will look for reactions at S1 and consider scaling a portion of our position off there to lock in profits.
5. We will exit this trade if our stop is reached or if Fractal Trend signals an uptrend (Aqua) while our trade is still open.
With all that said, it should be noted that a drop of this magnitude for the big banks represents a move not seen since 2009 back in the wake of the Financial Crisis. Thus, even though the setup makes sense, it also makes sense not to be overly aggressive with this short's position size and consider it more of an overall market hedge.

HSBC Pushing Upwards...HSBC is the best bank stock to buy and hold right now. Note the hold element in that statement. Take security in the support level mapped out @ 20.50. This is very likely to hold, but we could be in for some consolidation here. It's very likely that HSBC will hit the target in the 'entry price'. From there, we have two scenarios.
One is that it lifts off from that target due to the local support within the range charted. If this happens, then we can expect HSB to hit our target with very little effort.
The second scenario is that it consolidates and goes slightly below our entry, before potentially falling through/holding that level and sitting tight for a week or two. We need sufficient volume in this situation and we should be looking to get a safe entry at all costs. Whilst the volatility is residing, we can take a technical outlook and chart onwards from there. For now, however, I think the idea presented works perfectly in conjunction with what the chart says to us here. I would expect this target to be hit by the 1st June at the latest, but as early as next Tuesday.

BANK NIFTY Bearish Technical Analysis in LTFBANK Nifty TA Update:
BANK Nifty Now 19700 Point.
This is Rtest Level after breakdown The support.
So I can expect Next down leg soon
if you short or put then you can exit first Support At 19048 Point.
and after this support breakdown then next stoppage would be 18118 point.
so now I take put at 19730 Level and waiting for Close at support level .
Support: 19048/18200
Resistance : 19750/20300
if any candle close above 19750 level then this bearish chart exit and I will close my Trade.
and If open Put then Stop loss is 19765 Points.
Tight Stop loss because Risky is low and Profit would be very high.
so keep an eye on chart.
Please like and follow me for latest crypto and Stocks updates.
Thank you

BANKNIFTY Bearish Chart Analysis in LTFBANK Nifty TA Update:
BANK Nifty Now 19700 Point.
This is Rtest Level after breakdown The support.
So I can expect Next down leg soon
if you short or put then you can exit first Support At 19048 Point.
and after this support breakdown then next stoppage would be 18118 point.
so now I take put at 19730 Level and waiting for Close at support level.
Support: 19048/18200
Resistance : 19750/20300
if any candle close above 19750 level then this bearish chart exit and I will close my Trade.
so keep an eye on chart.
Please like and follow me for latest crypto and Stocks updates.
Thank you

Doing a Bancorp sell-off at $35.47First off, please don't take anything I say seriously or as financial advice. This is on opinion basis as always. That being said, let me get into a few of my key points. Bancorp has long potential, not many are disputing that. However, currently as a short term trade, I would suggest doing a sell-off at $35.47 as a negative retracement or bearish run seems imminent. Analyst are also currently giving it a sell rating as well.

WOW - Remembering all Mr. PresidentsLmao, I did not remember this. It's from long time ago trying to understand a little bit more this bank. Maybe is something irrelevant but it could be helpful to feed the curiosity some people still have and expand their knowledge with a better research. Also if i lose this idea again for some months I'll know where to find it now.
There I tried to find correlation between democrat presidents or republican and the action price development from that far, just for educational purposes like I said. Just to be able to dig a bit more and find political causes related to the historical growing of one of the biggest banks on Earth.
I found this when I was checking other "too big to fail" banks recent movements, to check the impact with all this infinite stimulus have been announced almost everywhere, and anyone with sufficient authority is printing money now. What a mess, isn't it?
Please hope you find your own conclusions from here, always keep that curiosity... and doubt.
Thanks!

BAC coming close to where we can open a long position?Bank of America with its decent yield of about nearly 4% and a decent balance sheet maybe a good bye during this down turn. The trend drawn above show that approx $18.10 might be a key point for the stock. I would wait for it to reach there and show us a bounce to confirm my idea before opening a long position. As always I am a long term investor looking to buy and hold equities. Please like and comment.
Thanks everyone!
"Be Fearful When Others Are Greedy and Greedy When Others Are Fearful" - Warren Buffet

Bank Nifty Intraday Setup for 01 April Expiry dayGood Morning Everyone,
#BankNifty #Intraday Range is 19623 to 18731 . Writers can be write 18700 PE and 19700 CE 1 April Expiry today . There is 90% chances That both of will be zero and has a good chance to make the awesome profit today. #Futures Traders wait for these levels to break to build your Position in Intraday or wait first 30 minute and setup your trade according it .
#intraday #Reliance #RelianceIndustries #RelianceMarkets #trading #tradingsignals #Nifty #nifty50 #banknifty

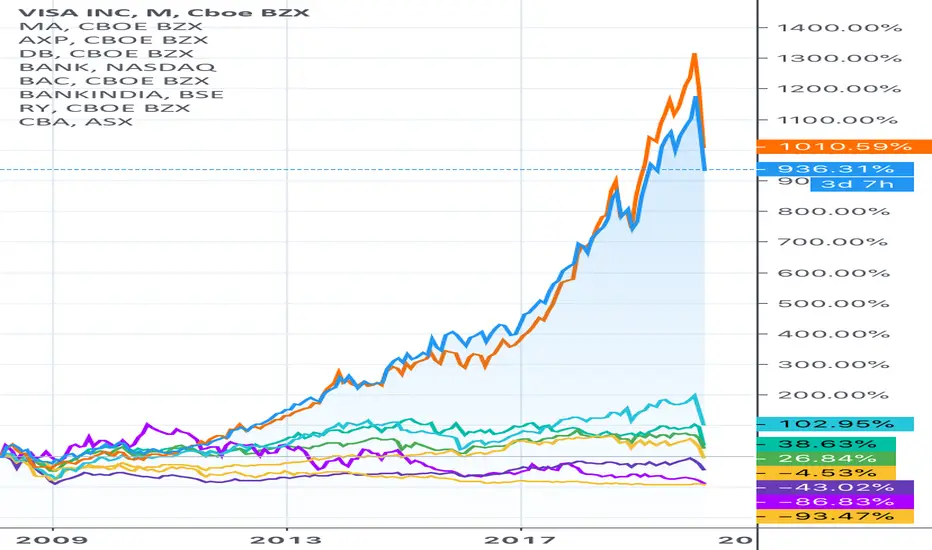
Bank Historical PerformanceThis is a quick chart to monitor how banks are performing. It includes companies such as Visa, Mastercard and American Express as well. If you think this should include other tickers, I’d be happy to include them.
Banks can't make money like this, look at Europe to see how badThe foundational problem here is that globally there is no growth story that does not involve assistance from central banks, which has been clear for a few years now. Regardless it has been great to be in stocks but, at the end of last year signs of the US consumer slacking off started to crop up. The first signs were in durable goods after that, transports fell off a cliff. Inflation has been with us for years but they measure it incorrectly by taking a bunch of products made in china, like TVs and clothing which mask the reality of the fact that everything involving real estate (rent, food...) has been inflationary. Everything involving human services has also been inflationary (health care, education, construction costs.) While everyone celebrates low unemployment rates, they are very inflationary. Try getting someone to build or fix anything without paying a fortune and it becomes clear.
The Yen as a flight to safety currency has been absolute BS for years now but that trade would not die, it has been with us since the 80s, if anyone cared about fundamentals it should have broken with the onset of Abenomics. The yen VIX ratio just broke down. Then gold surged against the Yen, XAUJPY blasting past all-time highs.
Nobody seems to care about this problem in Japan but what it means is that the Nikkei is about to get rekt. The only thing that has held that market up for many years now has been the reversal of the yen carry trade and people buying shitty Japanese stocks every time the trade reverses. They are about to get a margin call on a mass scale. How much money do the Japanese have in the S&P 500, they will be forced to dump right at the worst of the volatility spike. That SPX chart will be a sight to behold.
The next piece that you need for mass inflation is a disruption of the supply of goods, enter in Trump trade wars and tariffs...
Everyone who thinks this is all about the coronavirus will be very confused when they see what comes next, they will talk about what BS the reaction of markets is and, and ...
I thought that the story was going to unfold gradually over the next year, then the bigger disruption of the supply of goods started to kick in with china shutting down. This is almost certainly not long-lasting but it is a trigger event and the nail in the coffin is the drop in rates and yields.
Here is the problem, the markets will probably continue to correct for 6 more weeks or so. If it is fast and not gradual gold will get hammered short term with all the margin calls on everything else. Bonds and cash is where it's at for the correction. That being said I would not short gold at any time, this is not going to be a liquidity crisis like 2008 but people will look at that chart and dump gold assuming that it is going to do the same thing, they will pile on the shorts and drive gold to all-time highs when the short squeeze happens. After the big correction, it will be metals TIPS and gold miners.
Gold miners will correct at first but then enter a bull market. They are already making record-high profits because the cost of production is at the lows due to the valuation of oil and the local currencies where they operate vs. the USD.
The low the GDX just hit will likely be retested in an SPX crash, maybe lower. After that, they will remain among the few who's profits are growing. There will probably be a bubble in the GDX after the initial correction.
One could go on and on with arguments for metals (election year, CBs, Europe...)

Chart of the Day 3/3: Avoid Banks, this time is differentAs we contemplate the convergence of long-term US rates with that of Europe and Japan as well as the Japanification of the global economy, it is useful think about the potential impact on banks. Yes, low rates are not good for banks and as we have seen in Japan, perpetual low rates does not equate to an increase in velocity of money. That chapter in financial textbooks need to be re-written.
This series of charts will look at the American, European and Japanese banks and this time it is REALLY different. Not in a good way. As you can see, banks are testing long-term post GFC support levels. The key difference is, the last few times the banks tested trend line support, the stocks were oversold. This time, as you can see, banks are overbought on a weekly basis testing long-term trend support.
Whether this is bank-specific or a prelude to the wider trend, the jury is still out. This much I will say, the Americans do not know what they do not know in relation to the Covid-19 situation in the US. For an economy which strength has been measured largely by increases in temporary employment, this is an interesting situation to be in.

Chart of the Day 2/3: Avoid Banks, this time is differentAs we contemplate the convergence of long-term US rates with that of Europe and Japan as well as the Japanification of the global economy, it is useful think about the potential impact on banks. Yes, low rates are not good for banks and as we have seen in Japan, perpetual low rates does not equate to an increase in velocity of money. That chapter in financial textbooks need to be re-written.
This series of charts will look at the American, European and Japanese banks and this time it is REALLY different. Not in a good way. As you can see, banks are testing long-term post GFC support levels. The key difference is, the last few times the banks tested trend line support, the stocks were oversold. This time, as you can see, banks are overbought on a weekly basis testing long-term trend support.
Whether this is bank-specific or a prelude to the wider trend, the jury is still out. This much I will say, the Americans do not know what they do not know in relation to the Covid-19 situation in the US. For an economy which strength has been measured largely by increases in temporary employment, this is an interesting situation to be in.

Chart of the Day 1/3: Avoid Banks, this time is differentAs we contemplate the convergence of long-term US rates with that of Europe and Japan as well as the Japanification of the global economy, it is useful think about the potential impact on banks. Yes, low rates are not good for banks and as we have seen in Japan, perpetual low rates does not equate to an increase in velocity of money. That chapter in financial textbooks need to be re-written.
This series of charts will look at the American, European and Japanese banks and this time it is REALLY different. Not in a good way. As you can see, banks are testing long-term post GFC support levels. The key difference is, the last few times the banks tested trend line support, the stocks were oversold. This time, as you can see, banks are overbought on a weekly basis testing long-term trend support.
Whether this is bank-specific or a prelude to the wider trend, the jury is still out. This much I will say, the Americans do not know what they do not know in relation to the Covid-19 situation in the US. For an economy which strength has been measured largely by increases in temporary employment, this is an interesting situation to be in.

ABN AMRO BANK N.V. OversoldThe coronavirus COVID-19 overreaction pushed stocks to their lows.
Looking at the charts for ABN AMRO BANK N.V. we can say that this Dutch bank is heavily oversold.

Banco Santander: Bullish in 2020. Investment opportunity.The bank like the industry as a whole is on a long term bearish trend since the pre subprime mortgage crisis in 2007. On the 1W chart we see a clear bearish curve (RSI = 42.379, MACD = -0.083, ADX = 31.053, Highs/Lows = -0.0432) with Lower Highs and 3.1000 as the Support.
Since 2009, once the price crosses the 1W MA200 (orange line) SAN becomes a long term Sell opportunity. At the moment the RSI fractal is posting a bottom sequence and since we are that close to the 3.1000 Support we are turning bullish on Santander for the year and will sell once we cross the 1W MA200.
** If you like our free content follow our profile (www.tradingview.com) to get more daily ideas. **
Comments and likes are greatly appreciated.

Santander Looking Like an Interesting SetupBanco Santander looking like an interesting setup for a long term trade. It has broken the downtrend and it has broken horizontal resistance. Full disclosure I have been long since 3.80. I may add to my position if it holds support at 4.22

Bank Stocks: Bullish breakout. Strong long-term Buy Opportunity.BKX (Nasdaq bank index) has just broken above the Lower High trend line (dashed lines) of the 1W bearish (pull back) leg within the greater pattern of the multi year Channel Up since 2012. The technicals have turned bullish on 1W (RSI = 59.797, MACD = 1.140, Highs/Lows = 5.1079) and even the RSI is on identical levels with the last time a similar break out took place in 2016.
We are expecting a fairly similar bullish break out on the long term towards 140.00 - 149.80 (Target Zone).
** If you like our free content follow our profile (www.tradingview.com) to get more daily ideas. **
Comments and likes are greatly appreciated.

Goldman before EarningsGoldman Sachs failed triangle formation before earnings. Some lines and connection have been averaged with step-line over log (chart is self-explanatory).


Sberbank fallingSberbank shares have nice support starting from 200 and down to 187. After that there will be a gap till 174.

TD |Added to WatchlistTD showing strength compared to the other Toronto based financial institutions like CIBC, HCG, LB, etc., but may present a good opportunity to add to our "short Canada" trade.
