Storgeusdt,,,, Tecnicall analyst.. 📈Storge corrected after its good rally, now it is inclined to go up to continue its uptrend, and as you can see the reverse bart pattern is evident on the chart According to Fibonacci, the targets I drew on the chart are Storge targets.
Bartsimpson

Bitcoin Update 30.10.2023Bitcoin seems to be at a critical point. I think two scenarios emerge here. If Bitcoin closes hourly candles above $35,000, it will open a bull flag and therefore has the potential to run up to $38,000. However, if Bitcoin is rejected at $35,000, it will retreat to $33,700, and hourly candle closes below this support level will create a Bart pattern, pulling Bitcoin down to $31,000. Since it doesn't matter what I feel or don't feel and the only thing that matters is the critical $35,000 resistance, I think this level should be carefully monitored.

Ripple: The End of an EraThe pump is coming.
Ripple bears have only one thing left going for them: rektage. Post-settlement there is nothing holding the pump back.
It's time!

Inverse BartBart Simpson has returned, he's upside down.
Bitcoin has a tendency to "Bart". Today that tendency has returned.
Could we see a full recovery? Possible. Also possible we reach somewhere between 27.5-29k or even 31-32, and then back down to 24.3-24.7 before really heading up.
Let's see!
Yet again, the published image doesn't match the chart, so here it is:

Bullish Bart Simpson Pattern 📊🐂The Bart Simpson Pattern: Imagine a price chart that suddenly shoots up, then sharply drops down, forming a distinct "hair" shape. That's the Bart Simpson pattern – a unique market movement that resembles the iconic hairstyle of the beloved cartoon character.
🐂 Bullish Vibes: While the resemblance to Bart's hair might be amusing, the pattern's significance is no joke. Many traders interpret the Bart Simpson pattern as a bullish signal. The sharp drop often provides an opportunity to buy the dip, anticipating an eventual upward move.
💡 Trading the Trend: The Bart Simpson pattern is a reminder that trading is about spotting opportunities in unexpected places. Just as the pattern appears when you least expect it, bullish momentum can emerge from seemingly bearish scenarios.
🚀 Bullish Potential: Why is the Bart Simpson pattern seen as a bullish signal? It's because the sharp drop can shake out weak hands and set the stage for a potential price reversal. When the market seems to mimic Bart's hair, it might be signaling a trend in the making.

BTC - Bartnalysis Technical analysis is adapting.
We can see this Bart pattern proved to be a strong support level, but was not able to hold up.
Since his head is only so big.
(Next time I'll make it bigger, so this doesn't happen - gotchu fam 🤝)
We have support levels at:
- Eye level
- Nose level
- Mouth level
Currently, price is sitting at forehead support levels.
Volume has been sliding 😏 and I would expect a reversal off of the this support area, or the nose support..
Likely by Thursday after the FOMC meeting.

Arb more action to the down side....coming back down 1.11Arb coming back down to the bottom of the zone, measured move of 1,11 on the way, bart simpson pattern formin on 5 min timeframe

BTC: Head and ShouldersDrop on the horizon.
Volume is looking so bad.
Weekly RSI pointing down.
Head looks like Bart Simpson formation.
Twitter full of moonboys at the moment.

Btc , technical analyst ,Bart pattern We see the Bart pattern
A lot in Btc chart .I think,The Btc will go to the very high places and will not see the bottom..

Filcoin, Bart patternAdditionally, the triangle on the witness chart is broken upwards We see the Bart pattern.

Reverse Bart Pattern BTC/USD 4 hourCrypto's most beloved and memed pattern, the Reverse Bart aka the el barto reversal developing on the 4 hour

SOL PERSONAL ANALYSIS IN THE LONG TERM (UPDATED) HELLFIRE!What is up guys? I have been off for a decent while since I have been very busy with life however I am back. Please be reminded that a high probable trade is among us with SOLANA and other assets which will begin to go down this day up to a maximum of 19.6$ with an expected pullback up to 22.2$. As you can see in the chart, the Relative Strength Index has clearly given an image of consistent long-term (daily chart btw) losses of buyer interest which could only mean one thing -- an impending doom of a massive sell.
How does the Relative Strength Index help confirm the foreseen downtrend? It is mainly a tool that shows the strength of a particular movement whether if it may be bearish or bullish. In this scenario, the RSI shows that each pump is considerably weaker in momentum than the previous one and the price action demonstrates no further upside action and is now entering a slow-downtrend or a consolidation period. Buyers are uncertain if they can keep up with the positive sentiment and bears are now preparing their moneybags.
If you have any more questions, please feel free to chat, comment, react and share!
---------------------------------

Bitcoin may have killed the bears, and maybe.....INDEX:BTCUSD
..Maybe it will be the boy who saved the bears?
Who know ...
AY CARAMBA

Bart pattern detectedI see Bart Simpson is back again. In my opinion this will lead to a drop. Please still do your own research

BNT Parabolic inverse BART moving SOONJust take a look for yoru self. ATH on this $10 its now just $0.60 cents. Its broken the down trend and the 50d moving address is now below the price. Its about to swoop back underneath and push this up. When this moves it'll move so fast market orders will be all that works. Best to get in now before it rises instead chasing the pump. Buy some a sit on it.

#BTC.DOMINANCE BART PATTERN CREATE !!Hello dear traders, we here new so we ask you to support our ideas with your LIKE and COMMENT, also be free to ask any question in the comments, and we will try to answer for all, thank you, guys.
Hello, dear traders welcome you to this BTC.DOMINANCE 2hr chart analysis.
CHART ANALYSIS:-This Bart pattern is forming so we can expect BTC dominance from here to be a power buying opportunity for 41.60% BTC pair, we will give you a slack BTC pair coin update soon.
Thanks for your time, we hope our work is good for you, and you are satisfied, we wish you a good day and big profits.
THANK YOU.

You may not like itBut this is the future of BTC. Get everyone bearish by breaking the trend line, while simply remaining rnagebound with tightening PA
What happens after we reach the CC at 44k?
Bart takes over.
Expect him

BTCUSDT CRAB PRZ Supply to neckline retestHi everyone. I'm watching a probably PRZ in some confluences after a bearish Scott Carney's CRAB pattern figured out. The volume decreasing along the consolidation so-called Bart Simpson indicates institutional price support. In the next two days at least we can expect a distribution phase in the 100-88.6% range of Fibonacci retracement. The 61.8% pivot level can be a TP1 in a reversal breakout of 88.6%. The actual price action reinforces an ideal pullback to touch Head and Shoulders' neckline which can be spiked at this supply sector, as predicted in my past overview "potential pullback...". An expected overbought condition in the next daily coincides with a key level for institutionals to liquidates high leveraged longs by sardines that came in the BARR impulsive breakout.

Bitcoin Bart Simpson Pattern CONFIRMEDAs pointed out by one of my subscribers... Bitcoin has officially confirmed a full Bart Simpson Technical Pattern!
Bitcoin Bart Simpson formation patternIn crypto, the Bart Simpson formation, or just Bart, is a short-term chart pattern.
In a Bart formation, the cryptocurrency market rallies sharply, usually on a shorter timeframe like 30M, and after a period of flat (sideways) action retraces all of its previous gains.
The name Bart came from the pattern’s likeness to the shape of Bart Simpson’s head.
On bitcoin markets, the Bart shows up only after long periods of sideways. In those times the volumes decline and not much is happening on the markets.
The idea behind the Bart pattern is that there was an attempt to start a run-up in the market. It could have been done by a single actor or by means of organic uncoordinated speculation, that doesn’t really matter.
The important information is that this attempt did not catch on. Bart is a signal of relative weakness on the market: The speculation is trying to get ahead of the market.
Bart pattern is always a “failed attempt” at something: Either a failed attempt at starting a run-up after a sideways period, or a failed attempt at building a bottom after a down trend.
Quite typically, crypto markets will show bart patterns at the end of a channel or triangle formation that has been in the making for a few weeks.
Ends of triangular formations are in particular a good place to spot bart formations, because the volume there is getting lower - a lot of traders go to the sidelines, waiting for a decisive move.
Remember that Bart is a failed attempt at starting a run-up. There was some follow through, but not enough yet. The market needs to build up the momentum a little longer, and in the meantime a fundamental event can happen that changes everything … In other words, there is no way to time the market from the presence of Bart patterns alone.
However, it does show some early confidence on the market.
So, those are the options:
If the market is failing to establish bottom, it is too early to be bullish. You may have better odds in short-term short positions, but you need to consider other technical analysis, such as support and resistance lines.
It is a super bad time to speculate with futures or any other time-limited contracts. With plain leverage though, the story is different. You could use contracts like the Bitmex perpetual swap to try and catch longing the next Bart. Shorting it is more risky if the overall structure of the market looks like slowly setting up for a run-up.
If there is a Bart on the hourly charts but you are normally looking at the D and W charts and your opinion there is bullish, you could buy spot for the mid- to long-term.

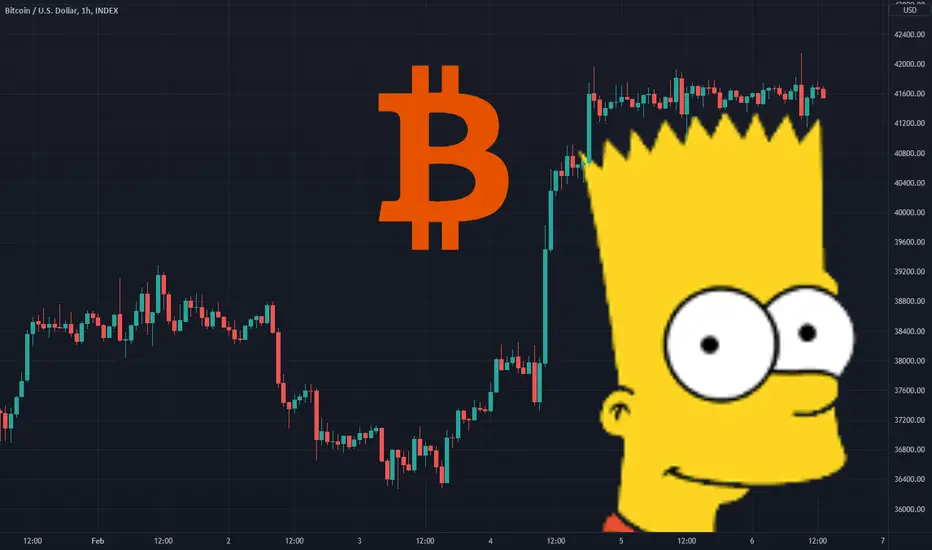
BTC USDT - 06 02 2022Possible Bart Simpson Pattern development, we are not in a bullish Trend daily, so Normally buy the support and sell the resistance,
We are not in a bullish Trend , so Normally buy the support and sell the resistance,
See 03 OCT 2021, how the configuration developed. the consolidation continued its upward movement.

BTC - Bitcoin - 15min. - Bart SimpsonI would not be surprised if we Bart this down…
Hole twitter and YouTube is already on 1.000.000$ again…

Possible Bart SimpsonWe hit the top of our descending channel fast, see my previous post, the we where rejected at the top of the channel resistance. The most probable outcome is down with a possible Bart which bitcoin loves to do.
