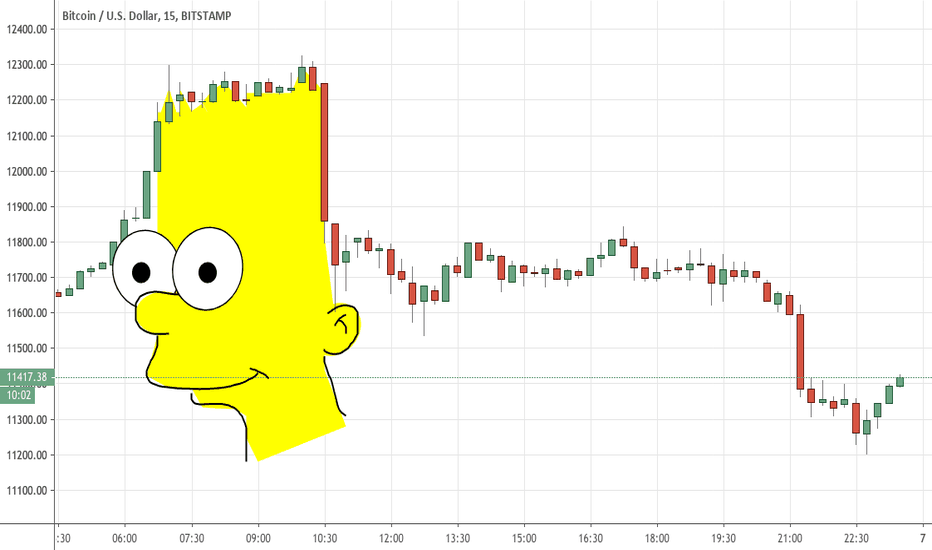
Mutant Bart Will Hit BTC with a retest and break of 3000$ soon. Are you ready?
There is literally no reason or usage for Bitcoin to be over valued.
Currently 30-40% miners already unplugged and today there is a 14-15% drop in difficulty in Bitcoin network.
insights.glassnode.com
Transactions dropped under 300k per day and continues to drop.
Activity is only between exchanges and very few whales. Otherwise BTC is a No Mans Town.
Bartsimpson
BTC/USD - Fall - Correction incoming.Hi people.
Few hours back I was still LONG and waiting for what BTC will tell. Now I cancelled my longs and we are going short for short-term correction. Too many wicks on top.. price is continuously rejected from higher prices. Too many chances to break out. But at the same time everything looks kind off nice and safe.. It seems too obvious that BTC is forming triangle or bull flag for many people = It will fall or If it will go higher it will at first stop out the majority of the people that are now long and patiently waiting for breakout up.. More likely "Bart simpson" will play out.
See you down there :) Waiting for buy again.
Using OBV Divergence To Detect Barts And Wyckoff DistributionBarts (AKA bull or bear traps) are a common pattern in cryptos. The OBV indicator can be useful for detecting Wyckoff style accumulation or distribution.
It's especially useful for Barts which have a very flat section of price action which makes the OBV divergence very apparent in some cases. If you see a flat zone that looks like a potential bart, track it on a couple different time frames and see if a divergence pops out, it might show which wyckoff mode it's in.
We have been trolled by yet another Bart Simpson pattern!We have been trolled by a textbook Bart Simpson pattern! What does this mean for bitcoin? Will we go up now for a double whammy back to back bart-man trolling pattern? will we fall back down to 9k again now?
I have no idea, i just wanted to draw a bart face on tradingview.. But you write down what you think is going to happen in the comments below!
Also did i do a good bart?
The "Bart" pattern in crypto-- Eating Shorts!!Last year, Bitcoin whales relying on technical analysis added a new weapon to their trading arsenal. This weapon is a chart pattern, known on social media as simply Bart.
It all started after the big boom of 2017 when Bitcoin showed its first signs of weakness. The price collapsed and so did the liquidity on all cryptocurrency exchanges. The bull market was over.
As a result, whales and exchanges alike had to come up with a different way to make money and survive. What followed next can be seen clearly on the Bitcoin (BTC) price chart.
At first glance, it looks like a regular pump-and-dump scheme — and, to some degree, it is exactly that. Cryptocurrency critics gave the pattern a catchy name, turning it into a meme on all social media: Bart.
www.google.com
Bitcoin - ALL TIME LOW CONFIRMED ! 100 MA WEEKLYLets get straight to the point, bitcoin is going down in the short term however so i'm here to prepare you for the best short you've had in your lifetime !
One of the first support lines of bitcoins big bull market surge is the 100 MA line which acted as support throughout the whole bull market, once bitcoin broke down below it you can clearly see it acted as resistance multiple times. PERFECT EXAMPLE OF BITCOIN BEING IN A BEAR MARKET!
Right now bitcoin is moving up to the 100 MA line again and it is going to have to choose to break it and end the bull market (which is very improbable looking at all the bearish signs and signs of bitcoin being overbought and topped out at this point) or test it, fail and go down finally testing the 350 MA this time and using that support to break the 100 MA in the next bull rally.
Please like & share if you liked this so i can keep making these TA's and trading setups for you FOR FREE :) !
XBT - I'm a master the times. Timing is Perfection.Hey everyone,
I've been quite passive for the past few days and it's weekend again. In my last few posts, I kept shorting Bitcoin and I strongly admit that I wrong. However, I can say that it seems like I'm a God when it comes to timing.
Here's a little story for my few followers.
On the 12th of November last year, I told my colleagues and friends within the crypto circle that Bitcoin was about to plunge really hard. Some listened but didn't give it much attention. Some others laughed hard and told me that they respect my opinion but think I'm crazy for thinking that would happen.
Two days later, the crash happened.
On that night, the entire coin circle was silent. It was like a ghost town.
As expected, I started getting messages the next day. The next morning, I had so many of em talking to me. Some calls, some chats. It felt awesome! "How did you predict that!", "How did you know??", "Do you know some insiders?? some whales??" ... The answer was simple.
I'm a master of time. Timing is KEY.
If you go back and check one of my ideas on trading view, you can see that I also foresaw that Bitcoin would make a huge move between March 29 -> April 2 with emphasis on April 1st. Don't get fooled on April fools!!
You guessed it, yes. It surged on April 1st. I personally thought Bitcoin would drop, but it didn't. This time, my prediction on price movement was wrong. But the timing was right as always. I've always been accurate with timing.
I'm a master of times.
Here's my prediction on what would happen after this price hike.
The next wave is coming and it's also on an uptrend again. We are now in correction phase and in a "Bart Simpsons"-ish pattern. We are correcting that price drop from that of the November story.
I am expecting a price hike of about 30 to 40% in a period of around 6 days.
I'll try to update as often as possible. See you in the next one guys!
Please follow me and keep passing by!
Peace!
New Bart PatternA meme develop in the crypto community around this unusual price pattern seen almost extensively in crypto currencies, characterized by its sudden rise in price, sideways movement, then sudden drop which had been widely popular in the entire duration of bear market 2018.
It has become so popular that trader @JamesRkaye made a trending post about it. Check his post by clicking the next image.
Just recently I've been hearing bears here and there for the past two weeks taunting another bart pattern will emerge.
Well times have change, the bart pattern we saw now look like these.
It would be fun to see double barts in the upcoming bull.
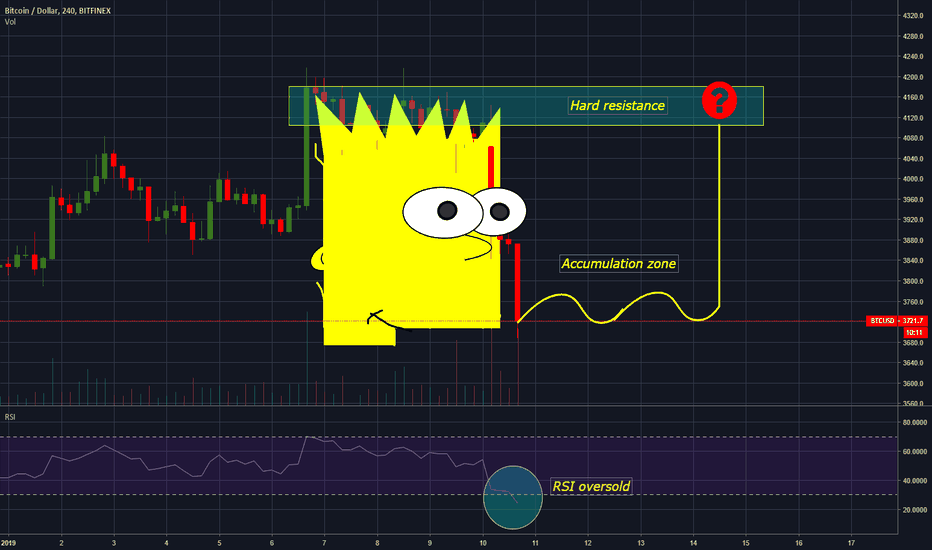
Bitcoin (BTC) Bart Head pattern, it will reverse?Classic crypto Bart's Head pattern
"The reason for these sudden pumps and dumps is likely to burn margin traders, whether short or long, by manipulating the market. While some believe that this is done by the exchanges themselves — which is entirely possible due to the lack of regulations — this might be related to large crypto traders"
Where from here? we will see a revers head after some accumulations?
Or it will go even lower?
RSI is oversold
Volume is only in pumps or dumps
But the history did not taught us anything, cuz everything is possible in crypto world...
Cheers!
@Zekis
BTC Falling wedge in a downtrendHi guys,
I am back after a short winter holiday break with new ideas for your. What's going on with BITSTAMP:BTCEUR at the moment? Up, down, up, down, down... and so on.
Come on guys, let's push this chart a little bit.
What I can see now is a falling wedge in this downtrend. And perhaps we will see a nice breakout on Sunday or Monday morning.
Another idea is that it it a simple Bart formation!? Let's see what the wales will do.
What do you think? Is it going up or down next? Please support me with a thumb up and a comment. I would appreciate this :)
I will try to update this post frequently.
See you guys, trade on, Muckrah
Bart Attracting Volume - Pulling In Short Entry ZoneLooks like the Bart dump out stopped out a lot of bulls which means it will probably be harder for price to get up as far as I was thinking.
I'm moving my region of interest to start shorting back to where I first projected it previously. The lower region is mainly a fib projection of the current bart.
This bart hasn't finished so it may expand lower which would change the fib projection.
I am not even going to attempt to predict the path it will take to get up to the shorting zone. It will probably be a tortuous path of barts and widening patterns.
All that matters is that it get outside the range to produce some kind of good RRR.
As long as it's stuck in this range any trade is probably throwing away money because it's very hard to define your risk with any degree of certainty.


