A look at the 10 most owned stocks by robinhood users 😂"Countertrend trading" and "We are oversold" these sentences just sound so stupid, I have a hard time believing this is a thing.
Here are a few of my finest comparisons:
"I put a pillow on my face and practice suffocated breathing".
"I compete in sprints with my legs tied together" Huh but why? "Well 2 legs have more power than 1 obviously duh silly" You keep losing! "YES BECAUSE THEY ALL CHEAT AND ALL KNOWING INSTITUTIONS MANIPULATE THE RACES!".
"I put my hand on the stove and now I am overburned way more than I should be, I will therefore keep my hand on and put the second one, should heal anytime".
"Counteroxygen breathing", "Countergravity jumping", "Counterheat cooking", "Countermudtorrent walking", "Counterultratide kayaking"...
"Stop buying umbrellas during this rainy season you fools! Don't you see we are overbought?", "Go to the pump station and fill your full car tank so you can stay at home don't you see Oil is oversold?", "Stop buying & drinking water during this heat wave you fools don't you see we are overbought?", "Stop buying ventilators and masks in this respiratory disease season you fools don't you see we are overbought?", "Stop avoiding sky stations in the summer we are oversold", "Why am I sunbathing by -5°C? Well clearly you are a noob and didn't notice seaside resort are very oversold this winter!"
It sounds so wrong xd
So, what are retail investors holding? First of all Tesla is not in the top 3 anymore, they have fallen to only #19. You have heard the theory a million times, and here the practical side of things confirms it: they hold and average in losers, they close at breakeven or take profit very quickly, they avoid winners, they get excited and buy at the top when the price goes parabolic.
Robinhood users have beautiful taste as you will see now.
Now, the top 10:
ACB was very oversold when wise & sophisticated investors took this opportunity. Aha! It got much cheaper, they can buy more now. They sure know how to smell a great deal.
Buying a car manufacturer on a downtrend for years and year, with declining sales and many financial issues, at the bottom clearly about to collapse and capitulate, smart, very smart. Buy parabolically as the stock capitulates? Pure genius. RSI at 7.50 was below 20.
Yes, in times of crisis companies with bad fundamentals and in a downtrend for 2 decades tend to do very well. Excellent perceptiveness by millenial retail investors.
Putting money in companies losing money and ignoring productive companies sounds like a great way to make a country prosper.
WallStreetBets legends have been spotted betting on another success story. How much lower can it go it's already down 97%. You don't loose if you don't sell.
(Multi)National-Socialist Umbrella corps time is soon over, I knew it! I can't wait for the big tech bubble to deflate. *Kondratiev
I... I don't know what to say... This is... They have the right to vote... I'm scared... That's some serious mental disability... Idk if I can laugh about it...
Not going to bother commenting. Same as previous.
I am thinking of shorting it but it's best if I stick to my own domain. Those investors stupidity is astonishing, I am not joking, I am shocked and even a bit worried.
Here's the top 10.
Hey, but what about highly performing stocks?
Unsurprisingly most of the top perf stocks are those expected to be a major part of the next Kond. cycle, and are seen as very important at the moment (but at the same time poor countries with old drugs are doing better than rich countries so... we'll see).
Quick check of a biotech company not in the "best performing" ones (which are mostly small ones) but a rather big name that is in the S&P500 (barely thought) and doign very well:
That's really something. Can you imagine how bad the world would be if there were no professional investors? Or if idiots keep reproducing at the current rate and smart women keep "focussing on their careers". 200 investors. That's it. OrganiGram has 90 thousand (265M market cap versus 10B for BIO). They'd rather invest in 4000 other companies rather than this one.
What about another top performer, Kodiak Sciences (2.25B mcap)?
They're not making positive earnings yet, but this is a growth stock, and we all know robinbros don't look at that, and we know they don't hold for years or decades.
RobinTrack is going to become my main indicator...
There are no big tank storage companies in the US I'm sad I wanted to check that. I already know what the result would be thought.
What about the FMCG sector?
Doing very well in this period of course (especially in the toilet paper area)
Delivery also doing good
Let's look at another top performer, a small cap...
I think that's enough, I made my point. I did not cherry pick the worse possible examples.
These people are STUUUUUPID. They are way too stupid to be trading even simple instruments in a protected environement and with regulations to protect them.
You can throw all the regulations you want, they will still be stupid and do dumb things.
And they think they can get their foot into Oil futures & other complex products.
Tough love: If you constantly fight the trend and let your losers run you are an idiot and you will lose everything.
There is a reason why the best in the world keep repeating the same advice.
Basics

Identifying Support and Resistance ZonesTechnical analysis basics. Identifying support and resistance zones, as well as using the stepped line chart to reduce noise and make isolating the zones easier.
(note: it did not record my voice for whatever reason. Hopefully its still clear)

So what is the secret? Part 2. Going from begginer to pro.Hello, so first of all I mentionned in this idea what I think are the most important rules to keep in mind, and a guideline on how to build a system / a career:
In this idea I would like to show what I think is the end goal, and how I would advice someone getting there.
I saw a nice chart on the internet "How traders think versus How trading actually works", I modified it a bit, this is my view on the subject:
I would not know how to explain to a complete beginner, but I think I understand the beginners that already read a bit about all this.
Let me explain what is in this pie:
About the watching the markets... some... people... still deposit money to cryptopia. Exchange went bankrupt. "It's just FUD", "don't look at the news they might convince you not to H0DL". Crypto community is the perfect example of what not to do, just unbelievable. Complete bunch of idiots. People that deposit money to a broker/exhange that went down have nothing to do in this business, stick to watching tv.
If I had to guide someone I think going throught these steps would be what I would choose:
0- If they are eager to buy and sell with real money, go on a small account and sizes as small as possible. If they are already not able to control themselves, no point even trying. Cannot advance they have to be able to control themselves first.
1- Start just reading, watching videos. There is alot of nonsense, trolling, and just dumb ignorant people that give their opinion. So do not take anything for granted and absorb it all. There are some warning signs. Kid that went huge leverage and made 10,000% returns at once and starts calling himself the legend, the master of charts... Most people can tell this is dumb, right? I am not sure to be honest. Well at least 1/3 can I imagine. If you can't, go to step -1 and build your understanding of the world, common sense, some mathematics too especially probabilities.
2- I would make a feedback on what the person knows, I do this myself all the time. Re-learn everything make sure the foundations are solid and that it is all natural don't need to overthink it. But with experience it will really become natural. Decide what you like more (this will change with time) and start going in that direction. Also check if what you like (catching the falling knife bottom right before the trend reverses and riding it to the top) is possible (no) or just silly (yes).
2- Write a plan or a set of rules. How do you want to do this? Any system can do. Have a system that tells you what to look for and then detail it a bit.
Say the rules are 1- Define the trend 2- Find out what is driving it and where it could end 3- Risk factors 4- Should I hop on & when? 5- How to set stop loss 6- Exit
For each number from 1 to 6 you write how you do this. Does not have to be perfect.
3- I would suggest starting with a risk reward ratio not too high I just do not think it is a good idea to have a reward much greater than risk at this point. Try being right about the trend as much as possible, avoiding the really bad days, not to gamble, not to chase losers, understanding more how markets move.
Stick to 1 or 2 (2 may be preferable to not get bad habits) markets. Maybe Bitcoin (and some alts) since it is very popular and also very educational, as well as gold, or indices if you prefer. Indices good. I think this is what I learned the first. Story time I remember (I think) the first chart I analysed was Bitcoin in 2014. It had no support till 100 to 250$ yikes. I was already a bear before I was a trader back in 2014. First markets I learned about and watched were the stock markets. Every one was always super serious about how many points were up or down and afraid of a big crisis, even when I was 8 or so I was thinking "oh calm down dude".
4- Time for a break. Might as well do that after a lose spree.
5- Review past trades. What was good? What went wrong? What happened that day? Why? Why did the price go up? Down? Following people on various sites helps for this rather than just being isolated, well I think it does, but careful there are plenty of idiots let's call them that, that just attribute price action to the dumbest things. When you start breathing talking finance, it becomes easier. At that point you may be 1 year in, you should start to get a feel of the markets and understand better how they move. Focus on working on your strong points weak points average points :p
6- You should have refined your trading, and try having a profitable or at least break even strategy over a great enough number of trade that you know it is probably not just a lucky - on unlucky - run. Being non delusional is important. If you kept winning in a raging bull market, be aware of that. You are on your own and there is no one to tell you that. Well there is MrRenev but people do not listen. I think now you should focus on avoiding really risky trades such as have the potential for massive slippage or just ahead of some important report, weed out the bad ones. Also, you get better at holding when you should hold, and exiting when you should exit.
7- Now is the time to increase that risk to reward ratio. The best, the really top trades, they all have high risk to reward ratios. It is broken. It is like hacking. You can get very profitable this way. There are some opportunities where the odds are high even thought the risk to reward is big. One of the reason why I do not recommend this earlier is you lose 5 in a row you do not know if you made a mistake or it is all normal. Better have plenty of winners and try looking "ok so did I enter too early or not how far did they go" etc. You just have more to work with. I don't think going high reward/risk from the start is really a good idea.
Once you are good at picking winners, and weeding out the really bad ones, you can focus on raising your RR while trying to maintain a decent winrate.
If you manage to get a high RR, above 5, then maybe you can focus on increasing winrate a bit again. It might be time to start looking at a new market too, if you are comfortable with the 1/2 you started with.
8- Permanent learning improving, adjusting to new conditions. At that point you know what to do and it gets more specific.
* You can use an indicator if you like it, but chill out with the indicators my gawd. Most of them don't even tell anything you cannot see on the chart for yourself when you have some screen time.

Basics special edition. The 4 kind of support.Can you tell from the chart what the main 3 supports are? :)
A- Horizontal lines.
The price has a tendency to react to these lines... Every one knows about horizontal lines of support and resistance.
These horizontal supports and resistances have to be drawn on swings high/low. Wicks or closes can be used...
Here are a few examples:
B- Diagonal lines
Another type of support, alot of people do not like this because they don't understand it "Uuuh trendlines are a scam when I hit my head on a wall then buy on the line for no reason other than the line I don't make money".
Very good like horizontal levels. Wicks or closes can be used...
Here are a few examples:
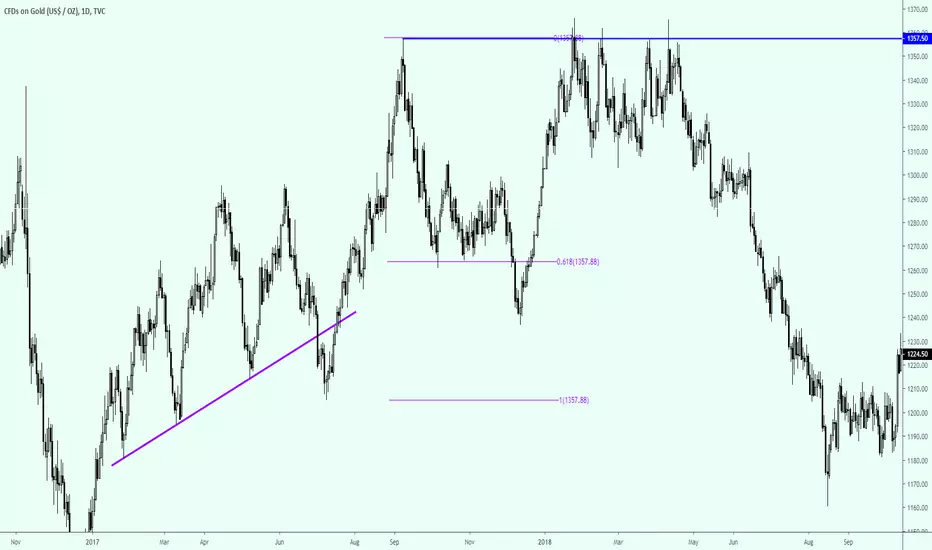
C- 0.618
An important one, I think especially with currencies but I am not sure about that.
Drawn from swing low to swing high. Alot of people look at it and think it matters, hence it does.
Here are a few examples:
D- Other
Those were the big 3. Horizontal lines, Diagonal lines, 0.618. I only like the 3 and ignore the rest.
Other elements can be used, such as moving averages, psychological round numbers, and I don't know what else that's it I would say.
Here are a few examples:
These are the basics that every one should know, but very few actually do. And they go risk 10% per trade not even knowing this lol. Good luck being in the 9%.
Of course, there is more to it than this, these levels can be relevant or not, drawing lines (a & b and even C sometimes) is more a skill than an "exact science" you can just automate. How to look at the correct supports and ignore the bad ones? What conditions to enter? Where to enter and stop loss and target? How to draw them correctly each time? This is for me to know and you to find out :)
HOW to indentify a TREND! MUST see for beginners! #EZ-learningHey tradomaniacs and becoming traders,
I love sharing my knowledge and wanna help everyone who is interested and trading. :-)
Check this "journal" and start to understand the market.
Most of us know how a trend works. BUT NOT WHY!
I hope this will help you out to understand and improves your abillity to indentify Trends.
Peace and happy learning
Irasor
Trading2ez
- Wanna see more? Don`t forget to follow me!
- Any questions? Wanna more stuff PM me!


End of the downtrend for the NANO/BTC pairPrices have stalled 5 times on the oblique resistance line and the very recent break (now 10pm) has just been confirmed since the price at which resistance was hit was 14076 Satoshi while the highest price that the candle reached over the session (over a 30 minute period) is 14700, or more than 4% variation.
This signals the end of the downtrend and the resumption of price increases.

LITE COIN back to 50% retrace | $100 breakout to $400 = $250 zoThe correction and "crypto-mini-crash" suggested in previous post playing out.
gotta love this action,

USDJPY > Simple candlestick signals easy to recognizeEducation > Basic Candlestick Signals
Chart > USDJPY > Non-Farm Payroll News Release > Friday, Oct. 6, 2017 - 8:30 A.M.
Analysis in chart
1. Large body w/small wicks indicate strength
2. Larger the body w/smaller wicks indicate greater strength
3. Long wick w/body at opposite end of candle indicates shift in trend momentum
4. Wicks at both sides w/smaller body in middle indicates indecisiveness and both sides have equal strength
5. Larger wicks w/smaller body in middle indicates increase of indecisiveness
* Personal analysis only. Please use your own rules and strategies prior to entering market.
** Forex trading involves HIGH RISK.
Before entering a trade, carefully consider your objectives, financial resources and level of experience.

Simple Trading Strategy > 10/20 SMASimple Trading Strategy > 10/20 SMA > Basic Education
Chart: EURUSD
Timeframe: Any
Indicators: 10 SMA / 20 SMA
10 SMA = Faster
20 SMA = Slower
If 10 SMA crosses 20 SMA to the downside = downtrend probable
IF 10 SMA crosses 20 SMA to the upside = uptrend probable
Very basic only ... be aware of false breaks/breaches, etc. This is a very simple strategy which can provide good results. Practice on Demo Account to test.
* Personal analysis only. Please use your own rules and strategies prior to entering market.
** Forex trading involves HIGH RISK.
Before entering a trade, carefully consider your objectives, financial resources and level of experience.

Locating Resistance and Support LevelsLocating Resistance and Support Levels > Basic Education
Chart: EURJPY
Timeframe: 4H & Above
Method: Line
If uncomfortable with ability to chart with Fibonacci, you may find using the Line Chart easier in identifying the Resistance and Support Levels.
From the closing price, simply locate the lowest low's and the highest peaks and draw a line straight across from the bottom of the low and the top of the peaks.
Always best to have multiple low's and peaks to draw from as this will help in a more accurate result.
From there, you can easily see the price of the Resistance and Support levels.
In addition, it can also provide a clear picture as well if any break or breach of a particular level was a true break/breach or was just a re-test by Bulls/Bears.
Forex trading involves HIGH RISK.
Before entering a trade, carefully consider your objectives, financial resources and level of experience.

Identifying Downward TrendlineIdentifying Downward Trendline > Basic Education
Chart: USDCAD
Downward Trendline identification w/Trend Reversal signals
Details in chart
Forex trading involves HIGH RISK.
Before entering a trade, carefully consider your objectives, financial resources and level of experience.

Identifying Upward TrendlineIdentifying Upward Trendline > Basic Education
Chart: EURUSD
Upward Trendline identification w/Trend Reversal signal
Details in chart
Forex trading involves HIGH RISK.
Before entering a trade, carefully consider your objectives, financial resources and level of experience.

AUDUSD 10/04/17Just my idea and analysis on the pair for the upcoming week, but on the 4 hr chart.
Looks like the beginning of an inverse head and shoulders pattern.
The RSI and Stochastic indicators both indicate that it is in oversold territory, and is due for a move upwards.
The key to this trade will be the current support line not being broken and a strong move up after it.
Will be looking to buy at the 0.74990 mark if the close if not below the support line.
SL would be set at the next support line at 0.7465
1st TP would be at the first resistance at 0.7585
2nd TP would be set at 0.7670
Would need to see a strong movement upwards to be able to fulfill this idea so trade carefully guys :)

Little trade on AUDNZDHey traders!!
We have had a HUGE move up, so I expect a relief. The market made a strong move down and it is now putting a consolidation pattern. I expect a break to the downside at the 1.272 extension which lines up with structure looking left.
Good luck in the market traders!!

Trend Continuation OpportunityWe have been moving harmonically to the downside, and we just broke major structure looking left.
Therefore, I would expect the trend to continue. There are a hundred ways to get involved, but not many ways in which I can get involved. Each trader has its own reasons for entry that match their philosophy and psychology, and you should too.
I will be updating this if I find a reason to get involved or if my outlook changed on this pair.
Trade your plan and hang tight through the drawdowns!!
Feel free to ask questions, criticize, or share your opinion!

Simple trade on AUDUSDPrice is reacting from a level of inner structure (look at the HTF), and that is the reason why I will not aim for a re-test of the highs. I am now waiting for a DB to occur, that will be my reason for entry on this trade.

The basics!We still have a few USD news events in front of us today, but I will keep an eye on this in case price is pushed down by the news and I get an opportunity to enter.

EUR GBP 4 HourVery strong movements from the get go today, been watching the movements since 22nd Sept.
Decided to jump in with small lots.
Currently learning to chart, so excuse errors - learning the basics of ABCD and support/Resistance.

EURUSD 15 - DAY 2 HOMEWORK ORDER ANALYSISMY 2ND HOMEWORK WITH MR PIPS OF ORDER FLOW
MOMENTUM
PROJECTION
DEPTH
