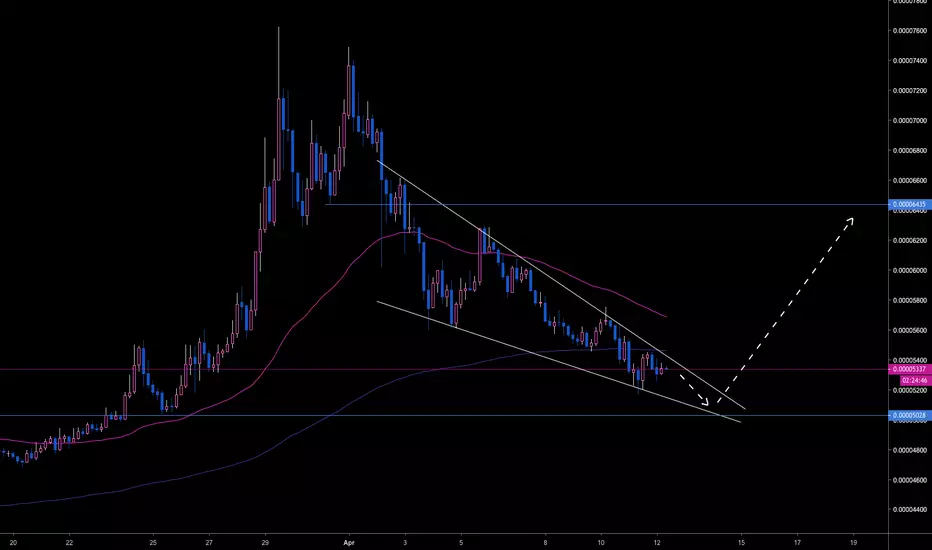
BAT Token - Things to Look at Before EnteringHi, here is my analysis on BINANCE:BATBTC
In daily, use the ascending support line for your protection stop. If it breaks below, look for the next support line for a re-enter.
I like the Donchian indicator to trade alts, so I built an indicator based on it. it is a powerful tool to catch breakouts. Here I used a 40-bars lookback, and it looks like just a fakeout, so I will wait for another stronger attempt before entering/buying BAT.
For a 80% chance of winning the trade,
wait for 110 bars Tilson T3 AND a breakout of the channels
Indicator used:
My Website: blockchainfiesta.com
Batbtclong

test strategy for BINANCE:BATBTC
correlation check
next target zone is 0.000065 - 0.00009401
#theminimalist

BasicAttentionToken/Bitcoin (21 May) #BAT $BAT #BTC $BTC#BUY
BAT has brought very good profit in the previous signal. Currently, BAT is forming a Falling Wedge formation combining Double Bottom formation. We have a big chance to conquer the 6500 zone in this wave
Current price : 4613
Buyzone : buy as close to 4500-4600 as possible
Sellzone : 5200-5700-6500
Stoploss if price is lower than 4400 and consider buying back around 4100-4150

looking for the LTF long setup based the weekly chartposted my weekly analysis here:
So we got a stop run under the 4h lows wich is a good sign for the bulls.
I simply want a break above that S/R level i highlighted to go long. A daily close above that level would be enough for me to get in because of the weekly looking so bullish.

BAT the most bullish looking alt coin out thereAs you can see we broke out of the weekly range and BAt had a nice reaction of the retest of it. That itself was THE perfect entry.
You can see now it is testing another weekly level/orderblock i expect another leg up from here so i will be looking for longs around this area( i will post a lower timeframe chart for this shortly after this
What is the target?
honestly, this might be one that just goes crazy parabolic aka DASH/ethereum 2 years ago So i am not really looking for targets but like long term hold where i will take some profits on logic places and will be looking to add if it gives me the opportunity.
I will for sure take maybe 30% profits at the 2.618 fib extension and see what price action is telling us for the rest.
Will post the lower timeframe analyses in the comment section

Head and Shoulder formation on 4H Looks like a clear H&S formation on the 4H timeframe to me. Will wait for 4H candle close above resistance and retest of support before buy in.
/This is just an idea and not trading advice. Please do your own research.

BATBTC longPossibility of a breakout for BAT. I think we see this playing out only if BTC can maintain above $5k
BATBTC will go BIG ?After recent events (Phase 2 of Brave Browser rewards system) might push.
Chart looks promising.

BAT Token Making Head & Shoulder Patterns Next Move 80% !!BAT Token are trying to make Head and shoulder pattern then we can take entry into two parts-
if fail H & S Pattern then we can take entry 3600
Target will be 4500 ,5000 and 5300
if Complete Makes H& S Pattern then Take Entry 2900
Sell Target Will Be 3600, 4500, 5000 and 5300.
Let See......!!
What Will be Next Move , i hope that Price can fly from the Given Buying Price....
Share Your Opinion in Comment Box.
if You Satisfied With My idea Then Dont Forgot To Hit Like .
Warning- I m Not a Financial Advisor this idea Only For Educational Purpose Only.
ThankYou....................!!

Basic Attention Token / Bitcoin (Bat/Btc) Buy opportunityBasic attention Token You can see here falling wedge pattern, already break up trendline and create HH.
The Falling Wedge is a bullish pattern that begins wide at the top and contracts as prices move lower. This price action forms a cone that slopes down as the reaction highs and reaction lows converge.
