ETHUSD - Bearish But patternThe price completed the bearish bat harmonic pattern.
The level is additionally confirmed by another Fibo measurement and the price is at levels where usually returned.
Yet, the surging USD is a bearish factor.
Bat

USDCHF SELL 0.8175On the 4-hour chart, USDCHF has stabilized and rebounded from its lows, forming a potential double bottom pattern in the short term. In the short term, USDCHF may continue to rise, with an upside target of around 0.8175, which is a potential short position for a bearish bat pattern and is within the previous supply zone.

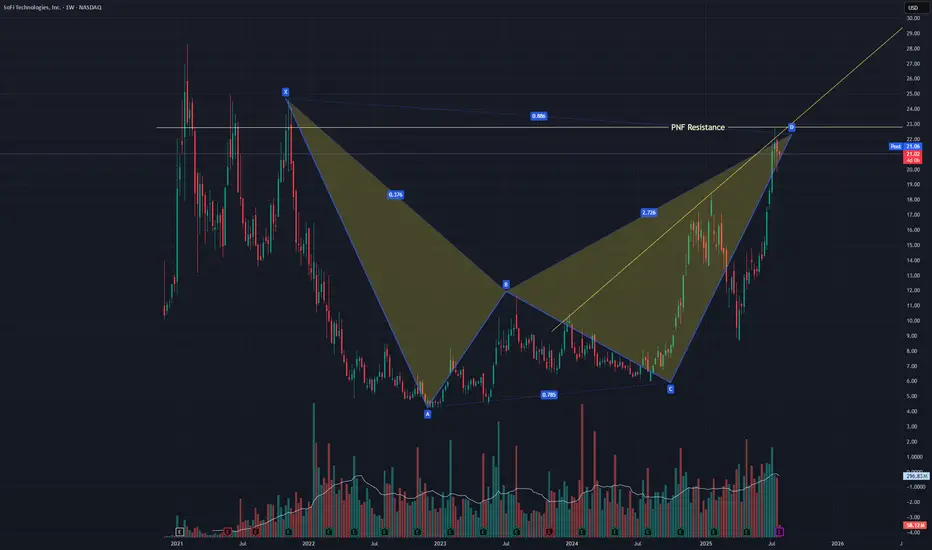
SOFI Pullback most likely comingNASDAQ:SOFI just finished a bearish bat harmonic and failed to break a resistance line I have from a PNF chart. It also failed a back test of a trendline of resistance in this uptrend. A pullback is likely but in this irrational market any thing could happen. I did a strangle +-5% just in case. I would not be surprised if I can close both with 20%+ profit.
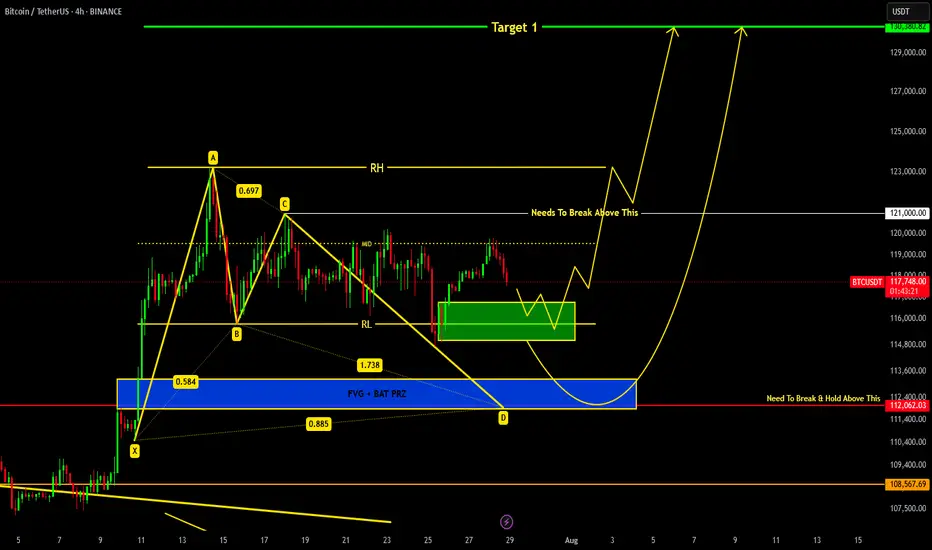
BITCOIN Current Update !!!we are heading towards support region around 116.8k-115k from where we can expect a reversal.
If price breaks down 115k level then a bat harmonic pattern is also forming which indicates it's PRZ at 113-112k region...
Remember 121k is key level which needs to be broken in order to remain bullish !!!
XAG longXAG prices may rise from $37.9, located at the FVG Zone and Leg of BAT Pattern , towards the targets .

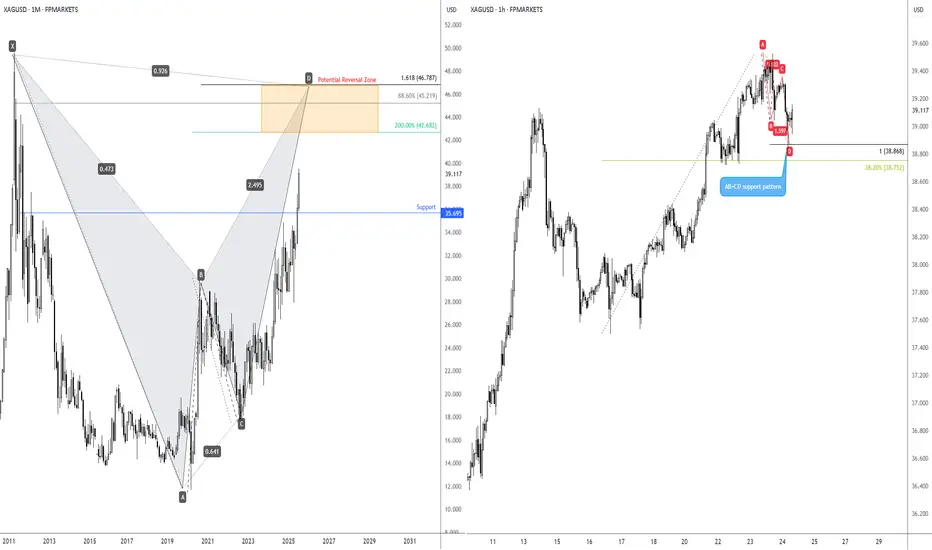
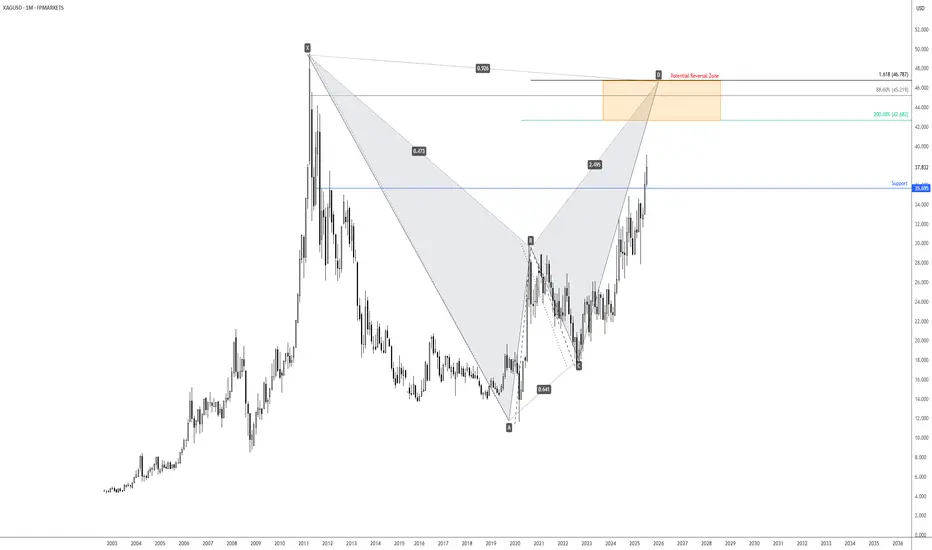
Long-term bullish action on Silver?I touched on the longer-term price action of Spot Silver (XAG/USD) last week, showing that the unit is on track to shake hands with a Potential Reversal Zone (PRZ) of a monthly harmonic bat pattern between US$46.79 and US$42.68.
Keeping things aligned with the harmonic landscape, you will note that H1 price action recently printed an AB=CD bullish pattern at US$38.87 (100% projection ratio), set just north of a 38.2% Fibonacci retracement ratio of US$38.75. While the H1 chart is generally considered short-term in nature, you may find that given we have longer-term flow suggesting scope for additional outperformance, short-term dip-buyers may consider holding a portion of their long positions open in an attempt to catch some of the possible longer-term upside.
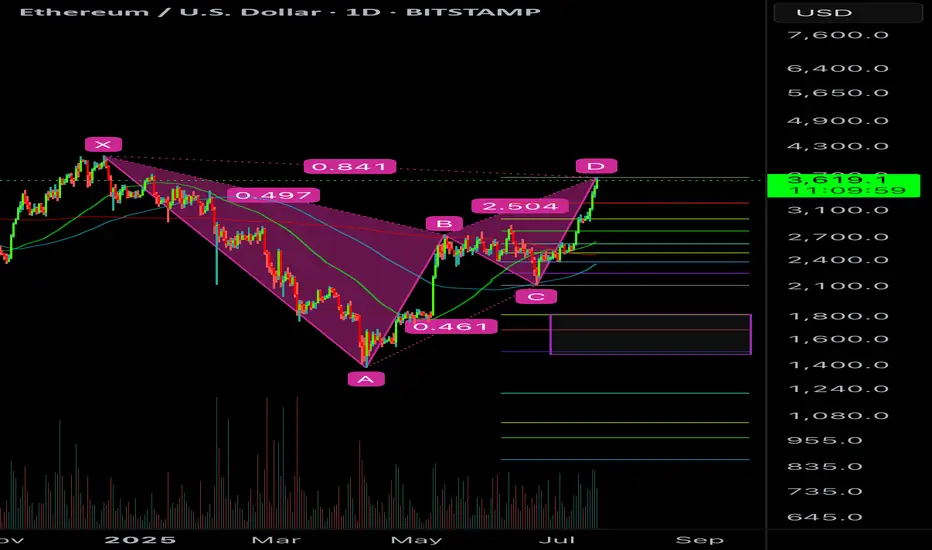
ETHUSD has formed a bearish bat patternOn the daily chart, ETHUSD formed a bearish bat pattern. The first downside target is around 3193, and the second downside target is around 2782.

NZDUSD BUY 0.5990On the 4-hour chart, NZDUSD formed a bullish bat pattern and then stabilized and rebounded, and short-term bulls have the upper hand. Currently, you can pay attention to the support near 0.5990. If it stabilizes, you can consider going long. The upper resistance is 0.6080-0.6120 area.

LTCUSD sell 131.2On the daily chart, LTCUSD stabilized and moved upward. Currently, we can pay attention to the resistance near 113.2 above. This position is a potential short-selling position for the bearish bat pattern, and this position is in the previous supply area.

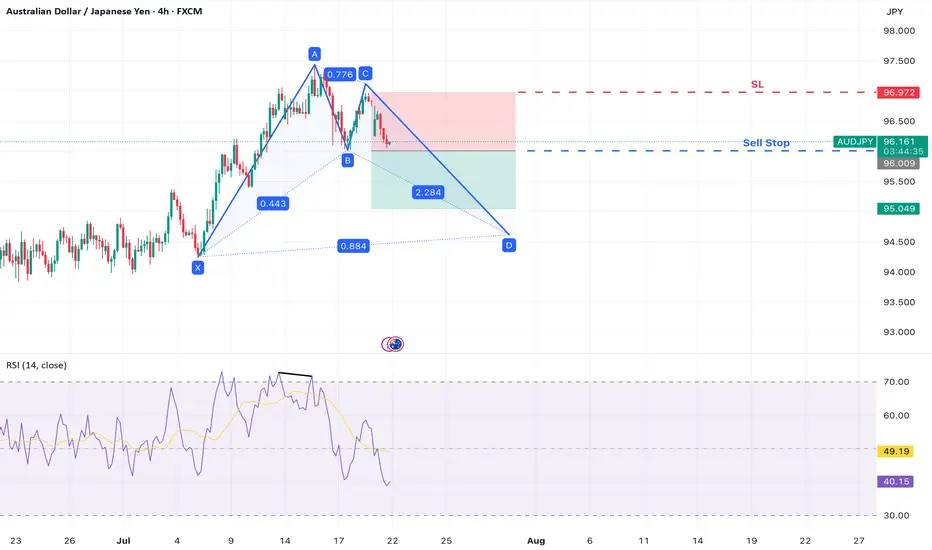
AUD/JPY – Bearish Move Within Bullish Bat StructureAUD/JPY is developing a Bullish Bat harmonic pattern on the 4-hour chart . While the full pattern has not yet completed, a potential short-term bearish opportunity is emerging as the pair begins forming the CD leg.
A clear b earish divergence on the RSI at Point A suggests waning bullish momentum, and a break below Point B may confirm the start of the final leg down toward Point D , completing the harmonic structure.
Trade Setup
Sell Stop Entry: 96.009 (break of Point B – confirms CD leg underway)
Stop Loss: 96.978 (above Point C – invalidates CD leg projection)
Take Profit 1: 95.040 (1:1 risk-to-reward level)
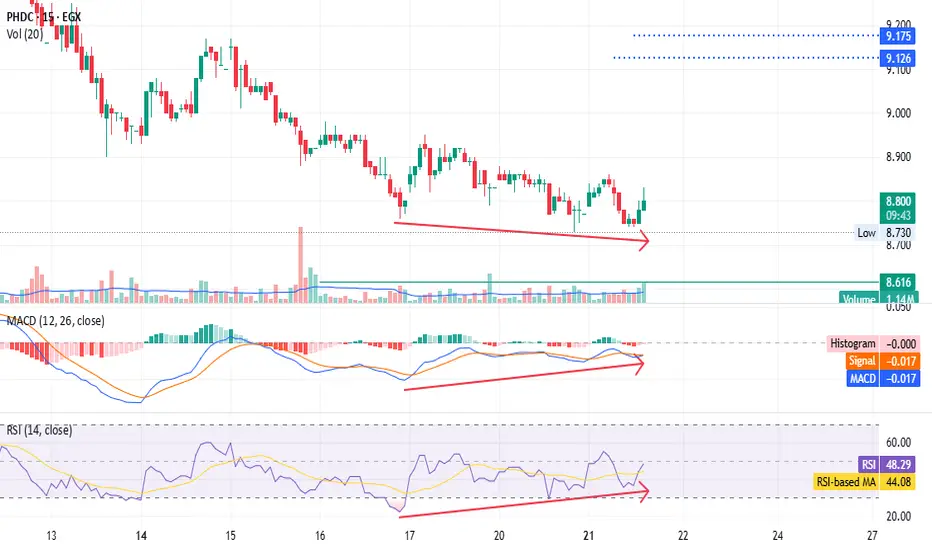
PHDC - don't give them away for free - only for shareholders EGX:PHDC - 15m timeframe
Hold your shares; don't give them away for free.
MACD and RSI show positive divergences.
Set a stop loss at 8.74.
Targets: 9.14 and 9.50.
*Not investment advice—just my chart analysis. Consult your account manager before investing. Good luck.*
GBPUSD: Bearish > Bullish Order FlowAlright, we are approaching some Higher Timeframe Points of Interests. We got a Potential Bullish Bat Pattern Pattern this align with this Bullish H4 Order Block, that's right in the middle of an whole number 1.34. We could expect some spikes around the area, some complex pullbacks, but we must remain steady.

GOLD SHORT IDEA
Hello Traders, here is the full analysis for this pair,
let me know in the comment section below if you have any questions,
the entry will be taken only if all rules of the strategies will be
satisfied. I suggest you keep this pair on your watch list and see if
the rules of your strategy are satisfied.
Dear Traders,
If you like this idea, do not forget to support it with a like and follow.
PLZ! LIKE COMMAND AND SUBSCRIBE

EURJPY Bearish Bat PatternOn the weekly chart, EURJPY has currently formed a bearish bat pattern, and short selling can be considered at present. The downside target is around 166.8. After breaking through, the support below is around 162.2.

3 Trading Scenarios To Choose From - Which Do You Prefer? The setup that we're looking at in this video is going to be a potential bearish bat pattern on GOLD.
However, what's more important is the lesson that I wanted to cover on different tactics for adjusting your stop/loss & dig into the pro's and con's of each.
I'd love to hear which way you guys would choose in this particular situation (or in general) so please share your opinion in the comments section below.
Wishing a great weekend and a great upcoming week in the markets.
Akil

ETH BEARISH BAT POTENTIALETH can go slightly higher but it’s at/near the .886 retracement and meets a valid bearish bat pattern.
I would be targeting a full move if it is unable to break above the .886.
Too many euphoric here. The move has been really scammy off the hype news of Genius Act which everyone saw coming. Expect a sell the news event and BTC.D bounce would destroy alts for one last capitulation most alts may drop 40-50% from here. Then the real bull will start.
Long-term bearish bat pattern on SilverLonger-term price action on the price of Spot Silver (XAG/USD) is on track to shake hands with a Potential Reversal Zone (PRZ) of a monthly bat pattern between US$46.79 and US$42.68. What this also tells Silver traders is that according to this pattern’s structure, there is scope for additional outperformance. As a result, I am closely monitoring monthly support from US$35.70 in the event of a pullback unfolding.
Written by FP Markets Chief Market Analyst Aaron Hill
10 Types of Cryptocurrencies: Explanations and ExamplesCryptocurrencies go far beyond Bitcoin. Today’s digital asset market includes a wide variety of coins and tokens, each serving distinct purposes. Below are 10 key categories of cryptocurrencies with brief explanations and examples:
Store of Value Cryptocurrencies:
Used as a digital form of gold or a long-term value reserve.
▶ Example: Bitcoin (BTC)
Smart Contract Platforms:
Support decentralized applications and programmable transactions.
▶ Example: Ethereum (ETH)
Stablecoins:
Pegged to fiat currencies to reduce volatility.
▶ Examples: USDT, USDC
Payment Tokens:
Designed for fast, low-cost money transfers.
▶ Examples: XRP, Stellar (XLM)
Governance Tokens:
Allow holders to vote on protocol decisions.
▶ Examples: UNI, MKR
Meme Coins:
Inspired by internet culture and social trends.
▶ Examples: Dogecoin (DOGE), Shiba Inu (SHIB)
Gaming Tokens:
Used in blockchain-based games and metaverses.
▶ Examples: AXS, SAND
Privacy Coins:
Focused on anonymous, untraceable transactions.
▶ Examples: Monero (XMR), Zcash (ZEC)
NFT Tokens:
Represent digital collectibles or assets on-chain.
▶ Examples: Bored Ape, CryptoPunks (ERC-721)
Infrastructure Tokens:
Power scalability, cross-chain solutions, or protocols.
▶ Examples: Polkadot (DOT), Cosmos (ATOM)
Understanding these categories helps investors and users navigate the complex crypto ecosystem more effectively.

XAUUSD SELL 3428On the 4-hour chart, XAUUSD stabilized and rebounded, and short-term bulls took the lead. At present, we can pay attention to the area around 3428, which is a potential short position of the bearish bat pattern, and this position is in the previous supply area.

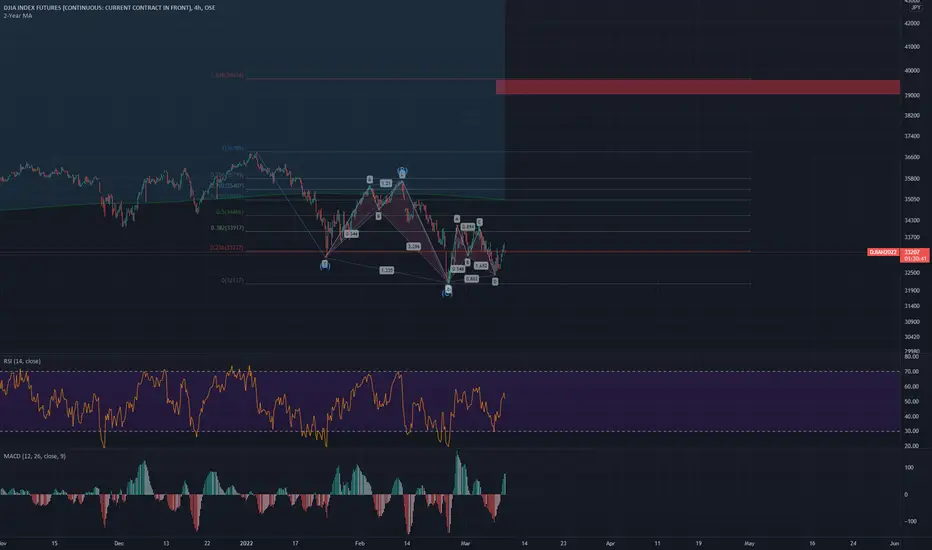
ABC Correction with Bullish Shark & Bat Type 1 Return Target 39KUptrend ABC Correction with Bullish Shark Retrace to .786 & Bullish Bat Type 1 Return Confirmation Higher Low. Full Fib Extension Target Top 39,000-39,600.
XRPUSD SELL 3.197On the daily chart, XRPUSD stabilized and rebounded, with short-term bulls in the lead. At present, attention can be paid to the resistance near 3.197 above, which is a potential short position for a bearish bat pattern. At the same time, this position is in the previous supply area, and the downward target is around 2.340.

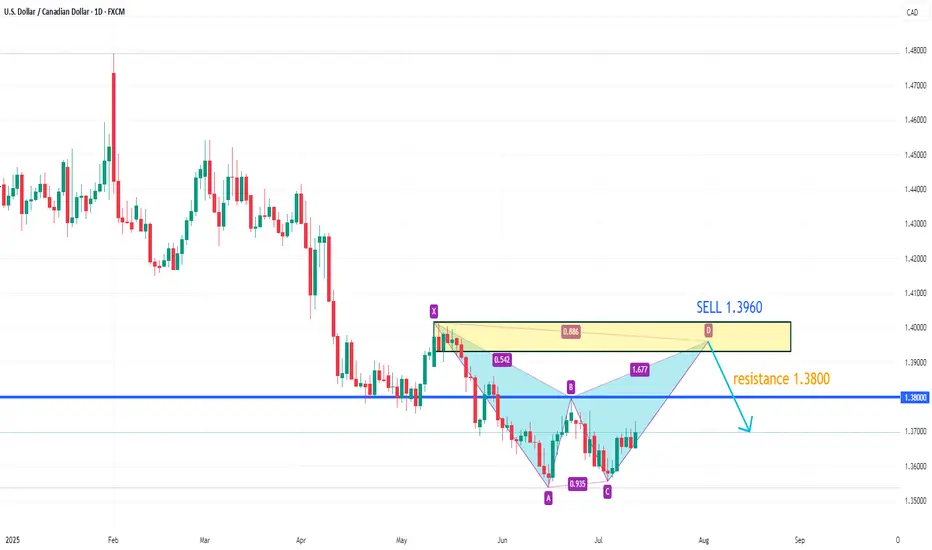
USDCAD upside target 1.3960On the 4-hour chart, USDCAD stabilized and moved upward, with bulls taking the upper hand. The current market has formed a potential double bottom pattern. In the short term, attention can be paid to the resistance near 1.380. A breakthrough will hopefully continue to move higher, with the upward target around 1.3960. When the price reaches 1.3960, attention can be paid to the bearish bat pattern.
ETHUSD SELL 2792On the daily chart, ETHUSD stabilized and rebounded, and short-term bulls have the upper hand. At present, we can pay attention to the resistance near 2792 above, which is a potential short position of the bearish bat pattern, and this position is in the previous supply area.
