XAUUSD BUY 3260On the 4-hour chart, XAUUSD is currently fluctuating and falling, and the short-term market is expected to continue to fall. The current support below can be focused on around 3260, which is a potential buying position for the bullish bat pattern, and this position is also in the previous demand area.
Bat

GBPUSD SELL 1.3762On the 4-hour chart, GBPUSD is currently oscillating. Currently, we can focus on the upper 1.3762 area, which is a potential short position of the bearish bat pattern, and this position is in the previous supply area.

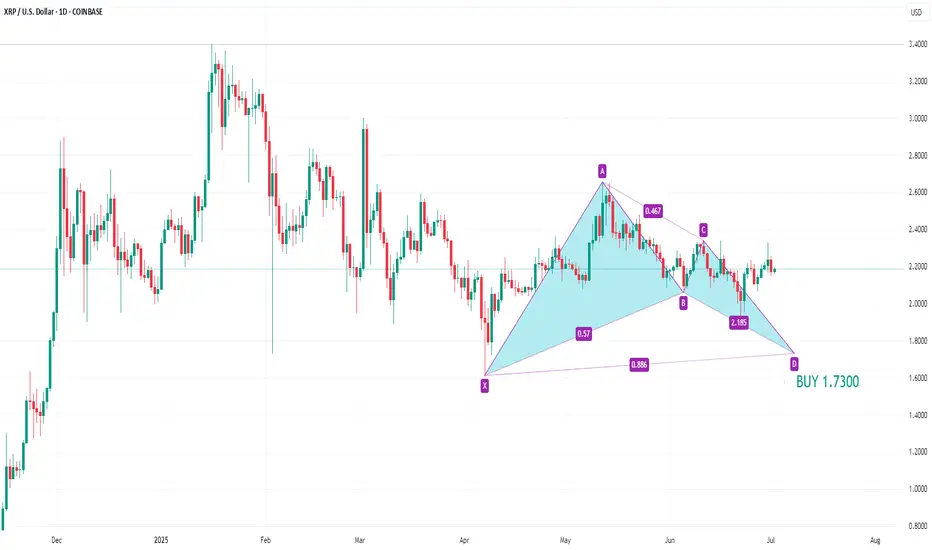
XRPUSD BUY 1.7300Recently, XRPUSD has been fluctuating and the trend is not obvious. Currently, we can pay attention to the support near 1.7300, which is the buying position of the potential bullish bat pattern.
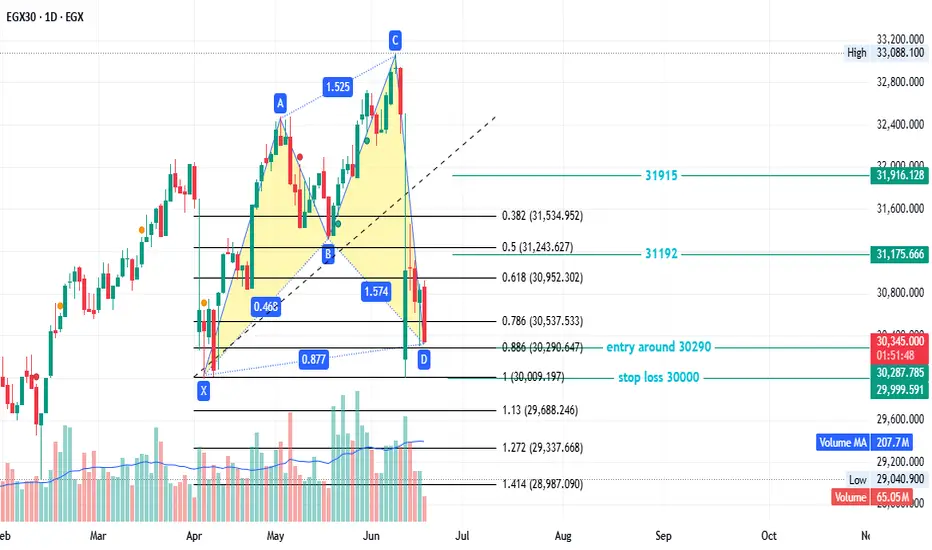
EGX30 - good newsEGX30 created a bullish pattern
entry around 30290
stop loss 30000
first target 31192
secund target 31915
This is not investment advice—only my analysis based on chart data. Consult your account manager before investing. Good luck!
USDCAD BUY 1.3568On the 4-hour chart, USDCAD fluctuated and fell. Currently, we can pay attention to the area around 1.3568 below, which is a potential buying position for a bullish bat pattern. At the same time, this position is within the previous demand area.

XAUUSD eyes potential bearish batOn the 4-hour chart, XAUUSD stabilized and rebounded in the short term. Currently, we can pay attention to the upper resistance near 3382.5. After it reaches that level, we can pay attention to the potential bearish bat pattern. At the same time, this position is in the previous supply area.

EURJPY Potential Bearish BatOn the daily chart, EURJPY fluctuates upward, and short-term bulls have the upper hand. At present, attention can be paid to the resistance near 173.03 above, which is a potential short position of the bearish bat pattern, and this position is in the previous supply area.

XRPUSD BUY 1.7310On the daily chart, XRPUSD has a short-term shock and retreat, and the bears have the upper hand. At present, you can pay attention to the support near 1.7310 below, which is a potential buying position for the bullish bat pattern.

LTCUSD Potential Bat PatternOn the daily chart, LTCUSD fluctuated downward, and the bears had the upper hand. The current support below can be seen around 68.0, which is also in the previous demand area.

EURUSD Eyes Potential Bullish BatOn the daily chart, EURUSD is currently oscillating at a high level. In the short term, we can pay attention to the area around 1.1402 below. This position is a potential buying position for a bullish bat pattern, and this position is also within the previous demand area.

EURGBP upside target 0.8600On the daily chart, EURGBP stabilized after the bullish bat pattern. At the same time, the current market formed a head and shoulders bottom pattern. At present, we can pay attention to the support near 0.8450. If it falls back and does not break, it is expected to continue to rise, and the upward target is around 0.8600.

USDCAD has formed a bullish bat patternOn the weekly chart, USDCAD formed a bullish bat pattern. The current market is in the previous demand area. You can consider buying around 1.3580, and the upside target is around 1.3943.

USOIL SELL 70.00On the daily chart, USOIL stabilized and rebounded, and short-term bulls have the upper hand. At present, the resistance around 70.00 can be paid attention to, which is the short position of the potential bearish bat pattern, and the position is the pressure of the integer mark.

XAUUSD SELL 3391On the 4-hour chart, XAUUSD stabilized and rebounded. At present, attention can be paid to the resistance near 3349. If it breaks through, it will continue to rise. If the price reaches around 3391, pay attention to the potential bearish bat pattern, which is in the previous supply area.

Japan’s Metaplanet to Invest $5.4 Billion in Bitcoin: A Bold StrAmid growing global interest in cryptocurrencies, Japanese investment firm Metaplanet has announced plans to invest $5.4 billion in Bitcoin. This strategic move places the company alongside the largest corporate Bitcoin holders and reflects Japan’s evolving financial stance, where digital assets are beginning to play a more prominent role.
According to Metaplanet, the firm intends to acquire approximately 210,000 BTC by 2027, representing nearly 1% of Bitcoin’s total supply, which is capped at 21 million coins. This initiative is aimed at hedging against inflation and the depreciation of the yen, while also strengthening the company’s position in global financial markets.
Unlike traditional funds, Metaplanet is committed to a long-term holding strategy (hodling) rather than speculative trading. This signals growing confidence in Bitcoin as a store of value comparable to gold. The company also anticipates increasing institutional demand and the potential recognition of Bitcoin as a reserve asset by central banks.
This move is also seen as a step toward legitimizing Bitcoin across Asia. Analysts suggest that other Japanese and South Korean companies may soon follow Metaplanet’s lead.
The $5.4 billion Bitcoin investment is more than a financial move—it’s a statement about the future. Metaplanet is showing that digital assets are becoming an integral part of modern macroeconomic strategy.

USDJPY Watch Out for Potential Bearish BatsOn the 4-hour chart, USDJPY stabilized and rebounded. Currently, we can pay attention to the resistance near 145.84 above. This position is a potential bearish bat short position, and this position is in the previous supply area.

ONDO Bullish Shark to T1 & Potential Bearish BatTicker: ONDO
Timeframe: Daily
Entry: 0.84887
Stop Loss: 0.76000
Take Profit: 1.386
R/R Ratio: 6.05
Pattern: Bullish Shark & Potential Bearish Bat
DOT: 1
HSI: 46
AmpRSI: 41
This bullish shark has held up during the last few months while we form a potential bearish bat with a C point at the terminal bar of the bullish shark. While HSI and AmpRSI are under the 50 it signals that we may spend more time down here. I added a stop under the terminal bar and structure low

NAS100 - Bearish Trend to start SOON !!!!Bearish Indications:
1- Bearish Divergence
2- Formation of Bearish BAT pattern
3- Rising Wedge Pattern
Trade Plan
1- Sell Stop order on LL
2- TPs as defined

GBPCAD - Bearish BAT Pattern Market is forming Bearish BAT pattern, we plan our entry on break on "A" point and then plan our TP till market reaches PRZ. as these pattern are reversal patterns, we plan our next entry on D point after good bearish signal is observed. we will look into divergence or any good bearish candle. as BAT pattern usually form Divergence before Bearish trend.
For Buy Entry : Place stop loss below the "C" point and TP at PRZ
For Sell Entry : Place stop loss above PRZ (which is also a good resistance level)

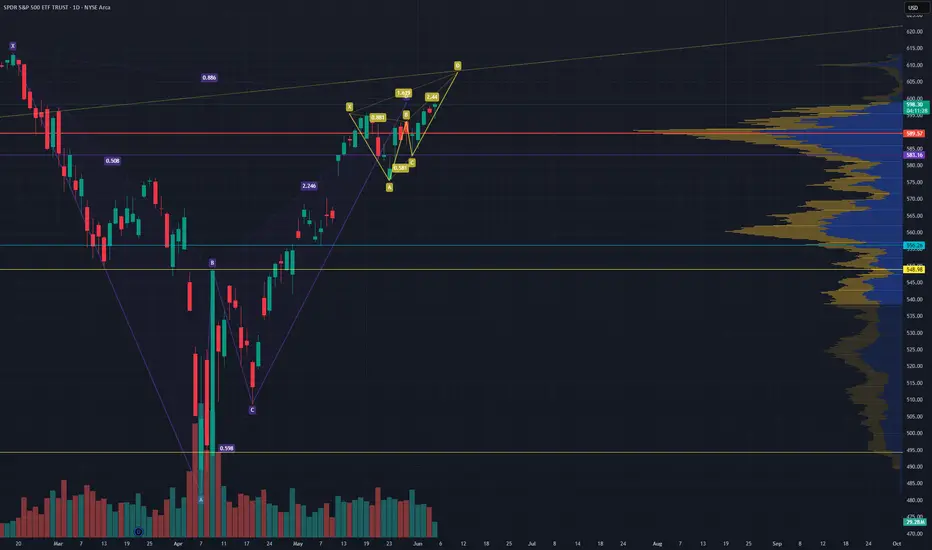
Big BAT Little Deep Crab on SPY WTF is going on with the marketI don't know what to make of this market but the BAT completed and what looked like a cup and handle is starting to look like a BAT and a deep crab. The deep Crab finishes right around a trendline I have that goes way back.
Publishing for tracking purposes
#SPY
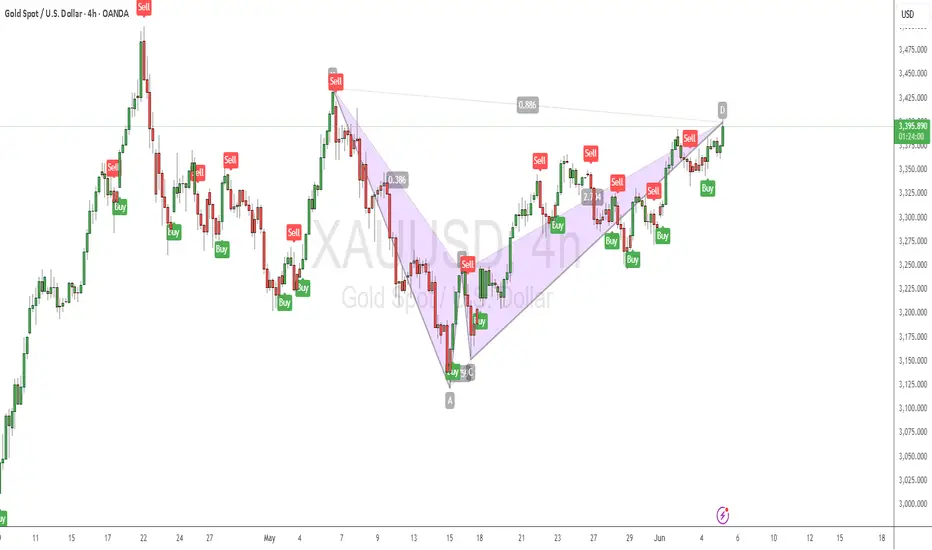
Gold Bearish BAT Pattern?As shown in the chart, Bearish BAT pattern formed
Also in the smaller timeframe, AB=CD formed
I would suggest that you wait for the closing of the H4 Candle first.
I am looking for a liquidity sweep here in the smaller time frames to enter
for more info, slide to my DM's
#GoodLuck
USDCAD BUY 1.3575On the weekly chart, USDCAD forms a potential bullish bat pattern in the short term, with the buying position focusing on 1.3575, which is also within the previous demand area.

A Harmonic Pattern Entry Into A Potential Continuation TradeI don't look at Bitcoin often but when answering a question for another trader this weekend I stumbled across an interesting opportunity.
Higher timeframe we've recently broken and closed above a previous high, allowing me to project that price is likely to continue higher.
We've already started to retracement in the form of a complex pullback and if you look carefully on the lower timeframe this complex pullback as also created a bullish bat pattern which could be used as an entry.
Please leave any questions or comments below
Akil
