EURGBP Potential Bullish Bat PatternOn the daily chart, EURGBP fluctuated and fell in the short term, and the bears have the upper hand. The current price can focus on the vicinity of 0.8363, which is a potential buying position for the bullish bat pattern, and this position is in the previous demand area.
Bat

XAU usd trade planExpecting this in couple of days or weeks that a gold can further go down by following the bat harmonic pattern.
If it follows the same, then a 3-4 % drawdown is expected. Or else we can expect a sideways movement.

Flying Bats & Soaring Gold PriceGold takes flight! 🦇✨
Bouncing off the 0.88 Fib level, it's shining bright amidst the stock market's turbulence.
Stay golden, friends!

Gold BAT Pattern Creation?Do you think the chart is helpful? Drop your comments :)
As we can see, we have 2 levels of resistance at which the price can play in between.
The triangle is a strategy to wait for the price to go higher, but big accounts can sell from here!
Clear BAT pattern creation for me!
This is not financial advice, but it's a 10-year experience idea.
Our previous trades were successful, and I hope you all profit from this.
Good luck

Basic Attention Idea#BAT has been in a bearish trend since Nov 2021, forming a complex corrective structure. But recently it bounced showing a bullish potential.
Passing $0.37 confirms a trend reversal, with $0.90 as the first target. Breaking $0.10 invalidates this idea.
#BasicAttentionToken

RTY Bullish Bat PatternBased on the potential formation of a Bat Pattern originating from the 1974 level, the Russell 2000 index may experience projected growth.
Technical analysis suggests this pattern could indicate a bullish reversal, warranting further monitoring for confirmation and precise target identification.
SEYED.

USDCAD eyes bullish bat patternOn the weekly chart, USDCAD fluctuated and fell, and the bears took the lead. At present, we can pay attention to the area below 1.3575, which is a potential buying position for the bullish bat pattern, and this position is in the previous demand area.

USDJPY Potential Bullish BatOn the 4-hour chart, USDJPY is currently fluctuating. We can currently pay attention to the potential bullish bat pattern and pay attention to buying around 142.43, which is in the previous demand area.

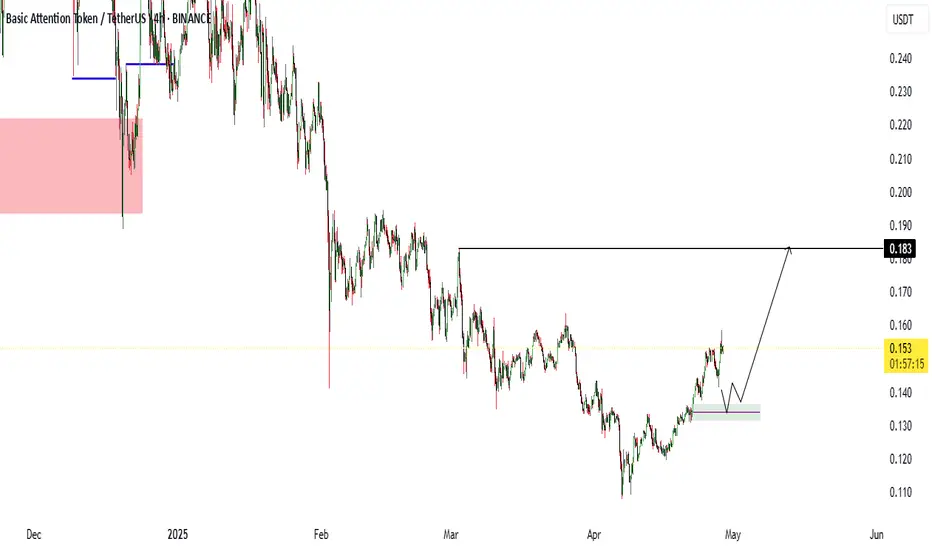
batusdt next move?🚀 BAT Coin Opportunity Alert
If BAT touches the 0.134 USD level — don’t miss the opportunity to enter! 📈
Even if BAT doesn’t hit 0.134,
✅ You can still enter if Bitcoin (BTC) drops to 90K, as the setup will remain strong.
Stay ready, manage your risk, and take advantage of the move!
USDCAD focuses on short selling near 1.3954On the 4-hour chart, USDCAD stabilized and rebounded, and the short-term market is expected to continue to rise. At present, the upper side can focus on 1.3954, which is a potential short-selling point of the bearish bat pattern, and this position is in the previous supply area.

PSX: ISL OutlookISL is taking support from weekly channel for new bullish trend. Expecting positive monthly closing
Entry: CMP
SL: 160
TP1: 86
TP2: 102
TP3:128
harmonic pattern TP 160 Level

Should I hold my short at $3,305.69, or exit now What do you think, fam? Should I hold my short at $3,305.69, or exit now with gold so close to my stop-loss at $3,306.57? Drop your thoughts below—I’m curious to hear how you’d play this XAU/USD setup! If you’re one of the two ready to join me at Academia for Forex Trading, let’s talk—we’ll hunt these markets together. And while you’re at it, check out Icon Collections Store—does RiverSide, Desire, or Icoca vibe with your trading energy? Let me know!

Basic Attention Token, An Old FriendLet's take the market bottom as the low that was set in June 2023, what do you see?
One single signal can reveal the bottom is that true?
One single signal can tell you everything that is going on with a chart, or not.
It is more about your experience, what you know about the market and the market cycle.
The main bottom for the 2022 bear market for Basic Attention Token (BATUSDT) happened in December 2022, after it goes sideways but, let's take June 2023 as the market bottom for the purpose of this chart.
#1 on the chart is a stop-loss hunt event. It leads to a bullish wave.
#2 on the chart is the same; a reversal comes next.
The bullish signal is in because #2 is already gone. The action went below long-term support (June 2023 low) is now trading back above it. Three weeks green, bull confirmed; yes we win! Yes, I win!
So this is easy don't you agree?
What's the potential for growth?
An easy target will give us some 350%. A strong target will give us 795%. Strong is not the best. We can end up with better target specially if we consider how the market in the past behaved.
Are you with me?
What do you see?
Do you agree?
The comments are the feedback, interact with me; what do you see?
Do you agree that this chart is green and set to grow?
If you agree boost, if you disagree boost and follow.
Thanks a lot for your support.
A strong rise can take more than a year to develop. With a low in August 2024, a high can happen in August 2025. Sounds early, looks early, feels early but can happen.
Taking the lowest point since the March 2020 bottom, April 2025, an entire year of bullish action would put an All-Time High in April 2026. This sounds good but, can it be true?
Too good to be true or too hard to believe?
If the bull market can be late to start, it can also end late.
Let's hope the bullish action goes beyond 2025 into mid-2026, that would be the best. The longer it takes, more time to adapt, plan and to secure wins and profits.
Thanks you for reading.
Namaste.

Bearish Bat Pattern .Get ready, market watchers!
The Russell 2000 is flashing some exciting signals!
We're seeing a potential Bat Pattern formation at the 1910 level, which could indicate a future pullback.
Keep a close eye on this index, because if the pattern plays out as anticipated, we could be looking at a fantastic opportunity to capitalize on a potential downward move!
This is definitely something to keep on your radar and factor into your trading strategies – the Bat Pattern might just give us the edge we need to navigate the markets like pros!

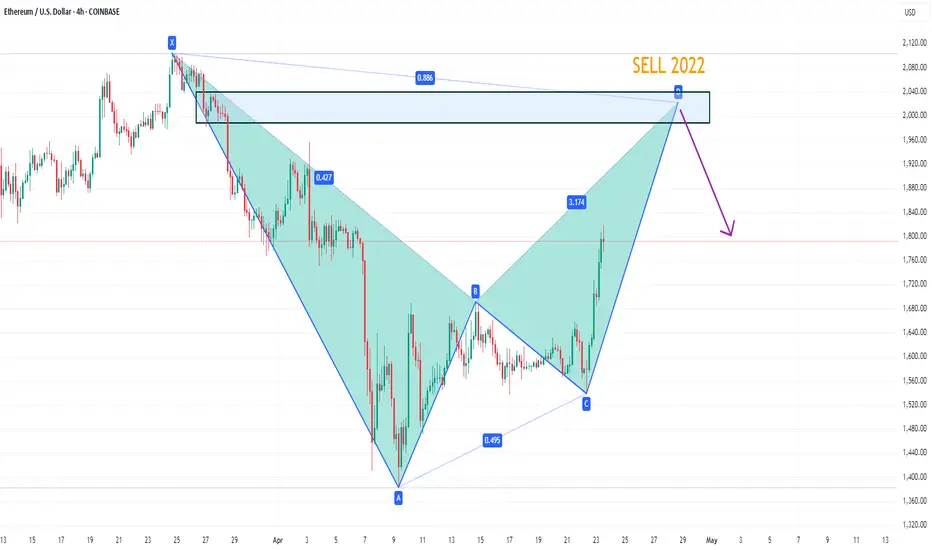
ETHUSD potential bearish bat patternOn the 4-hour chart, ETHUSD stabilized and rebounded. The current upper resistance is around 2022. Once it reaches that level, pay attention to the potential bearish bat pattern. At the same time, this position is in the previous supply area.
LTCUSD eyes bearish bat patternOn the daily chart, LTCUSD stabilized and rebounded in the short term, and bulls have the upper hand. Currently, the upward trend is looking towards the previous supply area of 90.9-96.5. If the price reaches 92.70, pay attention to the potential bearish bat pattern.

Bitcoin Bullish Bat Harmonic Forming – Breakout Imminent!?Bitcoin ( BINANCE:BTCUSDT ) then reached $85,500 , as I expected in my previous post .
Today, I want to share with you a short-term analysis of Bitcoin , and Bitcoin can break the Important Resistance line !
Bitcoin is trading near the Support zone($83,880-$82,380) and Support lines .
Bitcoin is likely to start rising again with the help of the Bullish Bat Harmonic Pattern .
I expect Bitcoin to start rising again either with the help of the Bullish Bat Harmonic Pattern or near the Support lines and Cumulative Long Liquidation Leverage($82,426-$81,439) . The first target could be the important resistance line , and if it breaks, it looks like Bitcoin could break the resistance zone ($87,520-$85,840 ) as well.
Cumulative Short Liquidation Leverage: $86,624-$85,486
Note: To break the Important Resistance line , we need a candle with high volume at least on the 4-hour time frame , like the Bullish Marubozu candle ; otherwise, it is probably we will see fake break . Since this line is of great importance, it is better to look for a confirming candle on the 4-hour time frame as well ( even a Doji candle with a small green body ).
Note: If Bitcoin falls below $81,000, we can expect further declines.
Do you think Bitcoin can break the Important Resistance line!?
Please respect each other's ideas and express them politely if you agree or disagree.
Bitcoin Analyze (BTCUSDT), 15-minute time frame.
Be sure to follow the updated ideas.
Do not forget to put a Stop loss for your positions (For every position you want to open).
Please follow your strategy and updates; this is just my Idea, and I will gladly see your ideas in this post.
Please do not forget the ✅' like '✅ button 🙏😊 & Share it with your friends; thanks, and Trade safe.

Two reasons to sell FTSE Right NOWWe are seeing some reasons to sell FTSE right now.
1) The daily trend is down.
2) H4 is pointing down, but the price is above the MA
3) There are two patterns to sell at the current level
4) 8165 is the last weeks high that will be a good resistance
Hoping for a test of last week's lows.

DXY – Bullish BAT Harmonic Pattern Formed
✅ Overview:
Pattern Identified: Bullish BAT
Current Trend: Bearish
Reversal Zone: Near 0.886 Fibonacci level (Potential PRZ – Potential Reversal Zone)
Bias: Short-term bearish ➝ Medium-term bullish
🧩 Pattern Structure:
X to A: Initial bullish leg
A to B: Retracement ~38.2%–50%
B to C: Extension to ~88.6%
C to D: Final bearish leg completing near 0.886 of XA
→ D point is the potential long entry zone
📈 Trade Plan – LONG Setup (Once PRZ is Hit)
Entry:
Buy near the 0.886 level of XA leg (watch for reversal candles or structure break)
Wait for confirmation on lower timeframes (1H or 4H)
Stop Loss:
Below the X-point or slightly below 0.886 zone
Targets:
TP1: 0.382 retracement of AD
TP2: 0.618 retracement of AD
TP3 (Optional): Break and retest of structure above B point
R:R Goal: At least 1:2
⚠️ Key Considerations:
Short-term DXY is still bearish; wait for reaction at PRZ
Ideal to pair with bullish divergence or support zone confluence
Watch for fundamental catalysts (CPI, NFP, Fed speakers) impacting USD strength

USDCAD Watch out for bullish bat patternOn the 4-hour chart, USDCAD is expected to form a potential bullish bat pattern. Currently, we can focus on buying opportunities around 1.4058. The upside target is 1.4140. After breaking through, the upper resistance is 1.4190.

GBPUSD SELL 1.2908On the hourly chart, GBPUSD stabilized in the short term. Currently, we can pay attention to the upper 1.2908 area, which is a potential short position of the bearish bat pattern. At the same time, this position is in the previous supply area. If shorting near 1.2908, the downward target will look at the 1.2750-1.2800 area.

BAT is getting close to the buyers' zone (3D)After multiple drops, it seems that BAT is getting close to a strong support level. In this zone, it is possible to buy gradually in spot.
The targets are indicated on the chart.
The closure of a daily candle below the invalidation level will invalidate this analysis.
Do not enter the position without capital management and stop setting
Comment if you have any questions
thank you

ETHEREUM REVERSAL INCOMING !!!!Ethereum formed major bat harmonic pattern and now approaching to it's Potential Reversal Zone. Also with that, it's approaching to it's range low. We can expect sweep of range low, although 1400-1200$ region is strong PRZ after that targets would be straight towards 4500-5000$
