NAS100 Develops Aggressive Bearish CD leg
GLOBALPRIME:NAS100
TRADE PLAN
INSTRUMENT: NAS100
TIMEFRAME: H4
DESCRIPTION
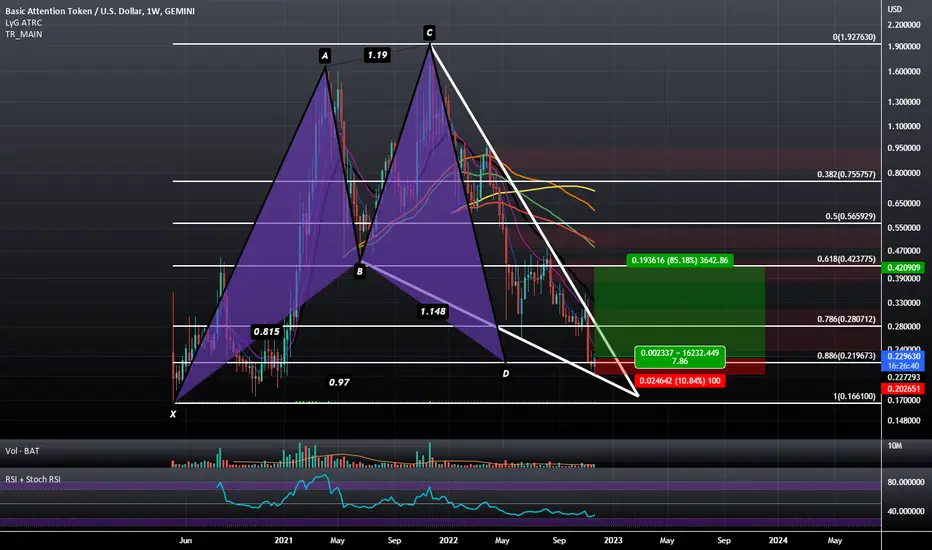
Looks like the market develops a Bullish BAT pattern.
A plan is to trade CD leg as it develops.
Entries and take profit levels depicted on the chart.
DISCLAIMER:Charts are educational not investment recommendations
Bat

S&P 500 Chart Analysis....
AronnoFX will not accept any liability for loss or damage as a result of
reliance on the information contained within this channel including
data, quotes, charts and buy/sell signals.
If you like this idea, do not forget to support with a like and follow.
Traders, if you like this idea or have your own opinion about it,
write in the comments. I will be glad.

Logscale Bullish Shark on BATThe Weekly Chart has a Logsclae Bullish Shark and Falling Wedge and is looking to atleast reclaim that 61.8% Retrace Area.
AUDCAD - Bearish Bat on an exhaustion move upAUDCAD completing a Bearish Bat at the 0.9050 zone. The Daily chart is also showing us a Bearish Divergence on the RSI.
I would be looking into the lower timeframe for a short entry

GBPUSD Short at BAT patternGBPUSD Short At Harmonic BAT pattern
Entry 1.21102
SL: 1.24550
TP: 1.17652
Risk reward 1\1

EURUSD H1Hi traders, watch EURUSD with your own according strategy and look for a short position opportunity for a short term trade setup GOOD LUCK.

ETHUSDT - Harmonic Bullish Bat Setup 🦇Hi Traders, Investors and Speculators 📈📉
Ev here. Been trading crypto since 2017 and later got into stocks. I have 3 board exams on financial markets and studied economics from a top tier university for a year. Daytime job - Math Teacher. 👩🏫
A Harmonic Pattern is hard to spot, and of top of that it needs to fulfill certain criteria before it can be considered a valid pattern. I've identified a bullish harmonic bat on Ethereum / ETHUSDT that is busy playing out. One of the criteria's still need to be filled : a drop to support zone of $1050 price range. From here, I detail a long setup with potential of +60%, according to harmonic bat pattern rules, entries and exits.
Cheat Sheet to Harmonic bat patterns, bullish and bearish :
_______________________
📢Follow us here on TradingView for daily updates and trade ideas on crypto , stocks and commodities 💎Hit like & Follow 👍
We thank you for your support !
CryptoCheck

AUDCHF - A strong harmonics indicationThe aussie dollar shows grim appearance against the swiss franc until 2023. Watching on a daily time-frame, formation of a strong bullish BAT pattern is seen.

S.S. Lazio Fan Token (LAZIO) formed BAT for upto 78.50% pumpHi dear friends, hope you are well and welcome to the new trade setup of S.S. Lazio Fan Token (LAZIO) with US Dollar pair.
Previously we caught more than 16% pump of LAZIO, on a 2hr time frame trade-setup as below:
Now on a daily time frame, LAZIO has formed a bullish BAT pattrn.
Note: Above idea is for educational purpose only. It is advised to diversify and strictly follow the stop loss, and don't get stuck with trade

AMDMID-TERM: Falling wedge and support reclaim with a bullish bat + CBD on the weekly chart. (not financial advice)

EURUSDHi traders, watch EURUSD with your own according strategy and look for a long position opportunity for a short term trade setup GOOD LUCK.

ETHUSDT - 1D - Bullish bat near 1000We can see a perfect bat almost completed near the strong round number 1000.
Entry...............1002
Target 1..........1393
Target 2.......... 1635
Stop Loss.......... 850
Happy Trading!

Shiba Inu ,,, Bat 🦇 or crab pattern 🦀It is bit difficult for analysts to recognize this pattern
,But I hope that the bat 🦇 pattern will take place , set the loss limit and the profit limit so that you don't lose ..

21-NOV-2022 | GOING SHORT IN GBPUSDI am taking a short position in GBPUSD because of the formation of a bearish Bat Pattern and it also does not break its previous HH and the market becomes sideways so hopefully, the market will become bearish

Gpbusd #harmonic 1.Alt Bat, when breaking B Level this Alt Bat will be activated. Short
2. Long if bounce back from B level
3. Alt Bat cancel if price break C level.
#harmonic #gbpusd #altbat #Bat

USDJPYHi traders, watch USDJPY with your own according strategy and look for a short position opportunity for a short term trade setup GOOD LUCK.
