BASIC ATTENTION TOKEN DailyDates in the future with the highest probability for price direction reversals
Batusd

Basic Attention Token Daily Setup BATUSDTDaily Chart with Fibonacci retracements on BATUSDT
As you can see we are sitting right at the .236 fib retracement level, which indicates we could see a bounce.
I like BAT as it has a working product, aka Brave Browser + BAT
Looking for a retrace up especially if BTC bounce up from these lower 8700 levels. Lets see what happens GLTA
(BAT) prices as of 2/28/20
$0.219139 USD (-2.82%)
0.00002508 BTC (-1.35%)
0.00095237 ETH (-2.14%)
Market Cap
$313,478,407 USD
35,883 BTC
1,362,359 ETH
Volume (24h)
$65,589,593 USD
7,508 BTC
285,049 ETH
Circulating Supply
1,430,500,738 BAT
Total Supply
1,500,000,000 BAT

BATUSDBat is just a beautiful project. Buy if the price goes there, massively. That's it, 3 coins buy massively. Be rich or lose the chance.

BATUSDT formed bullish butterfly | Upto 35% move exptectedPreviously I have posted chart where the price action of Basic attention token formed a bullish shark pattern. And at that time the price action was moving in the potential reversal zone of this harmonic pattern. And at that time I was expecting up to 90% profit but the price action took a powerful bullish divergence and produced more than 102% profit.
Another Harmonic Move
Now this time the price action of Basic attention token has formed another bullish harmonic pattern and this time it is bullish Butterfly. And this is another awesome opportunity to earn more profit. This time the profit probability is up to 35%.
Let's dig this pattern deeper to see how perfectly this pattern is driven:
The first leg was started from 16th to 18th Feb 2020 and after that the next A to B leg is retraced between 0.618 to 0.786 Fibonacci levels, then B to C leg is moved up to the Fibonacci projection level between 0.382 to 0. 886 Fibonacci and that is the Fibonacci projection of A to B leg. Then C to D leg is retraced between 1.27 up to 1.618 Fibonacci levels and now the formation of bullish butterfly is completed here.
At this time the priceline is entered in the buying zone and we can place our buying orders in this area.
Buying And Sell Targets:
The buying and sell targets according to harmonic Butterfly pattern should be:
Buy between: $0.2205 to $0.1994
Sell between: $0.2340 to $0.2707
Stop Loss:
The potential reversal zone area which is up to $0.1994 can be used as stop loss in case of complete candle sticks closes below this level.
This idea is for short and mid term traders not a long term idea, I will be keep posting more trading ideas.

BAT needs ATTENTION -- 0.5$ incoming?Back with another full Crypto Roller Coaster trade setup CT . As always take some time to LEAVE a LIKE and hit FOLLOW if you appreciate such analysis.
I believe BAT has been in a Higher Time frame consolidation which it's about to break. But the Mid term scenario already looks extremely bullish.
Targets as shown.
Cheers. Keep RIDING THE ROLLER COASTER.

BAT can breakdown the support to complete the BAT patternA Recap:
In my previous post we have see that the Basic Attention Token had found the resistance at: $0.1959 and support at : $0.1487 and this support was not broken since 29 Aug 2019 when the price action took drop more than 29% upto $0.1326 but failed to breakdown this support.
And after finding this firm support the price action was moving sideways above this support level since Aug 2019 to Dec 2019 and in the meanwhile the price action was hitting the upper band of Bollinger bands and the mouth of bollinger bands was expanding and moving up and Relative Strength Index ( RSI ) was oversold up till 18 Dec and was turned bullish and Moving average convergence divergence ( MACD ) was turned strong bullish.
The Directional movement the +DI has crossed up -DI and ADX is above 29 level and giving strong bullish signals.
And upto 12hr chart the Ichimoku cloud was turned bullish and lagging span of ichimoku cloud had crossed up the priceline and the price action also crossed up the bearish cloud on the other hand the chop zone had also given strong bullish signals by turning bullish.
On daily chart simple moving averages were also expected to form an open Alligator’s mouth and with all these bullish signals the price action also formed a bullish Shark pattern and entered in potential reversal zone.
Based on all above indicators I predicted that the priceline of BAT token will now breakout the $0.1959 resistance and it will hit the next resistance at: $0.2695
Now What Next? :
Retesting The Previous Resistance As Support:
Now we can see that the price action not even broke out the $0.1959 resistance but also has broken out the $0.2695.
From this level the Basic attention token was expected to retest the recent broken resistance as support and move up to next resistance level at $0.4067 as the BAT token did after breaking out the previous resistance level of $0.1959.
But this time while retesting the recent broken resistance as support the candle sticks are likely to cross down this support or retesting is being failed.
This candle stick is the make or break for Basic attention token because if this support will be broken down than the price action may move more down to retest the previous resistance level at $0.1959, in this situation the coin will loss 39% of its value from the recent high of $0.3221.
But in case the sell will be stopped here and price line will not breakdown this support then we may see the price action to move to next resistance level at $0.4067 and after this resistance level will have only one and final resistance at $0.4493 and if this final resistance will be broken out then the Basic attention token can start a very powerful rally to make new high that will be highest price ever in the history of BAT token.
A Formation Of Bullish Harmonic Pattern:
If we see the short term 4 hour time period chart then the price action is forming a bullish BAT pattern and at this time the final leg C to D is being formed the dimensions of this pattern is as below:
After initial leg (X to A) the A to B leg is retraced between 0.382 to 0.50 Fibonacci and then B to C leg is almost projected between 0.382 to 0.886 of A to B leg's Fibonacci projection (here I have ignored extra spike coz all other legs are perfectly driven) now the final (C to D) leg should be retraced between 0.786 to 0.886 Fibonacci for a perfect bullish BAT pattern and then the price action will be entered in potential reversal zone of this bullish BAT pattern.
As per above pattern we can see that the situation Is still in favor of bears unless the previous support of $0.1959 won’t be retested because the potential reversal zone goes very close to this support however the formation of this pattern is also a hope that the price action may not break down the previous support.
Long Term Perspective:
As on 26th Oct 2019 I posted an article where I revealed that the price action of Basic attention token has formed a big bullish BAT pattern on long term week chart and at that time the price action was in potential reversal zone of this big bullish BAT:
Based on this pattern and some other bullish signals I predicted that the price action may hit the price level between: $0.28328 to $0.42727.
Then from Dec 2019 to Feb 2020 the price action started a bull rally and gained more than 110% value.
Here if we see the 0.786 Fibonacci projection of this pattern then it is at $0.42727 which is very close to its final resistance and at this time the priceline has already hit the 0.50 Fibonacci projection if the price action moves more up from here to breakout the 0.786 Fibonacci level then the Basic attention token will definitely breakout the final resistance as well to make all time high.

BAT - Potential to break important resistance zoneIn the next few hours the daily, 2D and 3D will all close.
The key area is marked between 0.27846 & 0.28744. (This level is also marked out as the .382 Fib zone, so this also a significant area to break) If these time frames close above this area then I will be targeting a move firstly to 0.322430, but then 0.3644 (depending also on BTC's movements, but right now it also is long term bullish).
The 3D and Weekly are looking very bullish too. Keep BAT's movements in mind.

Bearish gartley BAT/BTCBat long term view.
Potential gartley. Selling the 0.786.
Nice potential trade ;)

BAT!!BAT just had a STRONG 2 day candle close over my 2nd target! Could possibly add to the position the retest (if there is one) on that target.
Not financial advice.

Time to close BAT trade. Good work on your %50 gains traders!Ok guys. You can see I called the .30 cents hit spot on. If you have been hanging with me on this one since the .20 cents mark, you should have nailed %50 gains. That's remarkable!
Time to take those profits. Do not get greedy on this one. BTC (which the market follows) could still drop to 6k one more time before we're finally 100% bullish

$BAT - Breaking seems validLong term triangle is breaking for $BAT
Waiting for a move to the top of this pattern
Not a Financial Advice

BAT Breakout to $0.30 Short TermI believe BAT will break out to $0.30 Feb. 14th-15th. Momentum is building and Basic Attention Token will be a big winner in this bullish alt season. Very bullish on the Brave Browser as well.

Basic Attention Token USDC CoinbaseThe pullback on Basic Attention Token has a couple of indicators pointing to a range between (Fib .618).1918 to (Fib .5).2067 as a decent entry point to ride the third wave up to .35 - .38 highlighted in grey (Fib 1.618 bottom to top). RSI hits 74 overbought territories as it now moves downward. Moving averages are kissing the trendline.
I”m not registered or licensed in any jurisdiction whatsoever to provide investing advice or anything of an advisory or consultancy nature, and are therefore are unqualified to give investment recommendations. Always do your own research and consult with a licensed investment professional before investing. This communication is never to be used as the basis of making investment decisions, and it is for entertainment purposes only.

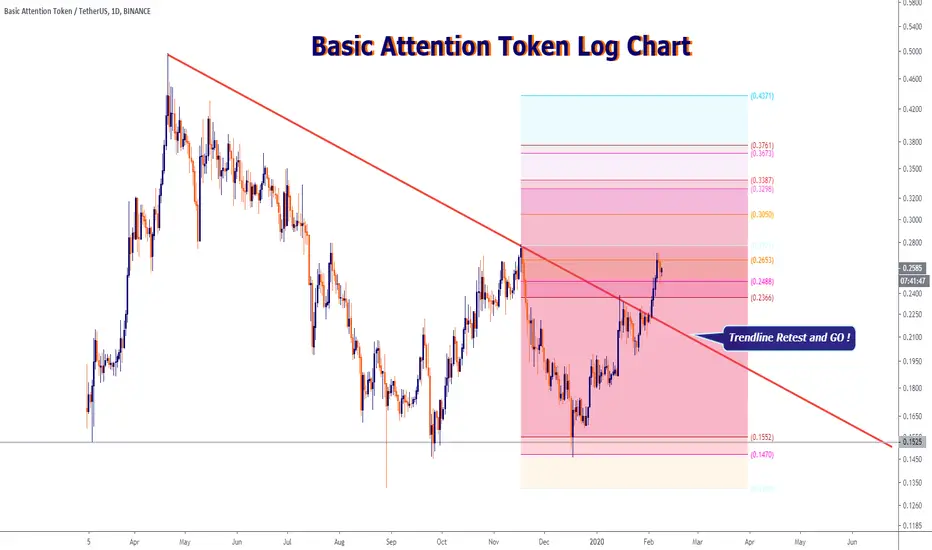
Bassic Attention TokenNeeds to retest trendline ?!
Ater that....🚀🚀🚀
Disclaimer:
We are not registered or licensed in any jurisdiction whatsoever to provide investing advice or anything of an advisory or consultancy nature,
and are therefore are unqualified to give investment recommendations.
Always do your own research and consult with a licensed investment professional before investing.
This communication is never to be used as the basis of making investment decisions, and it is for entertainment purposes only.
BATBasic Attention Token just break out resistance line of triangle
After Impulse we forming triangle and now we break out and I think we will continue to growing

BAT UP TO 26% ,SAFE MOOVESimple pattern formation double bottom,
and resistance break soon
up till point 5 is not sure maybe it gonna stay between the 2 pink lines
grey option is near impossible but it can happen
that seem to be a easy secure way to make up 26% here.

BAT - Bullish Breakout Continuing Its Way UpI really like BAT here. We have a bullish breakout of a triangle pattern that is threatening to break even further to the upside. The MA50 is about to cross the MA200 on the 4-hour chart. The MACD looks very bullish as well. I'm long here.

BAT / USDT. Potentially Forming a Dragon Pattern. BAT/USDT may be forming a Dragon Formation , provided that the price breaks the downtrend line (red line) and fixes above it.
If the price cannot overcome the downtrend line, then the downtrend will start with the target zone being the local low.
The points of observation are showed on the graph.
ENTRANCE
1) Entrance on a breakthrough or pullback after breaking a trend resistance line (red resistance line).
2) Entry from the previous price lows when confirming support, if in this situation the price can not overcome the downtrend line.
TARGET
1) If the price overcomes the trend resistance line and fixes above it, then the Dragon Formation will be confirmed.
The entire length of the "Dragon's tail" is the target zone of this figure.
The potential is from +19% (hump level) to +128% (head level).
2) If the price does not overcome the downtrend line, then after the downtrend, the entrance is from support (around. 0.145-0.15) the first target being the downtrend line.
Stop Loss
Under key support levels during your entry into the market.
I learnt this formation from "SpartaBTC" so if it works out, he deserves the credit.

BAT target .30 Cents IF we do this!BLUF: Neutral until we break above the blue trendline.
Hi traders. Just a quick heads-up. BAT could be headed for %50 gains if we break above that BLUE downtrend line in my chart. Currently it is getting squeezed. A decision must be made soon. Wait for the break above the blue trendline and confirmation on the daily before trading this.
I'll try to keep you posted.

BAT | 2020 Price Prediction: Found Bottom? When you look at the price action in $BAT has started a rally in Dec 2017 and followed by the "accumulation period" from April 2018 to January 2019. Accumulation was followed by an expansion to clear equal highs followed by a reversal in April 2019. We had some distribution period well known as a downtrend.
Question is here: Is BAT bottom in?
Retested weekly support, followed with expansion and last week lasts expansion 62% retraced. If price can hold above 2440 I can see next targets 3892 sats which is from this point another 50% gain, important level for my eyes weekly is 5025-5778 sats where you should take all your profits from swing long. Why? Look at important pivot which has been many times resistance and was broken only once for some weeks and price immediately went below this important level again. That's why I expect big pressure in terms of sell pressure in this area so you should take profits here as well.
Summary:
- found a bottom in 2019
- Crossing for the first time on weekly DMA 150 + 200 DMA (last time it has crossed was on Feb 2019 followed by 150% gain)
- the re-tested latest expansion,
- expecting to challenge 2915 sats soon if it breaks then 3892 sats and
- the final long term destination in 2020 is 5500 sats
This is a weekly view so take on mind that all outlined targets will not probably hit overnight.
__________________________________________________________________________________________________________________
I do a daily observation of major currencies in forex and crypto. Do not miss any move, high-valued analysis or educational content.
Telegram: t.me
Twitter: twitter.com
__________________________________________________________________________________________________________________
I've been analyzing for some time which exchange/broker is best for trading all-assets (crypto, forex, gold,..).
PrimeXBT (tight spreads, up to 1000x leverage, 24/7 support, lowest fees, no slippages, no overloads, quick withdrawals, No KYC).
go.primexbt.com
__________________________________________________________________________________________________________________

#Basic Attention Token | Prepare To Take OffEntry : 0.00002348 - 0.00002251
Target 1 : 0.00002505
Target 2 : 0.00002722
Target 3 : 0.00002863
Target 4 : 0.00003264
Target 5 : 0.00003455
Stop loss : 0.00002154
Risk/Reward : 5%/52%
Do not risk a large amount of your money
Do not hurry to buy, the price may go down to good places
Please share your opinion in the comments box and do not forget to press the like button
Add to watchlist

BATUSD - 120% Gain Trade SetupIn depth analysis of BAT/USD.
Two elements that I use to analyse my charts are hidden. Meanwhile there is also a double-bottom formation and a higher low.
120% gain for about 23% risk.
Who's in?

BATUSDT formed bullish Shark | Upto 90% bullish move expectedPriceline of Basic Attention Token / US Dollar cryptocurrency has formed a bullish Shark pattern and entered in potential reversal zone.
This PRZ area should be used as stop loss in case of complete candle stick closes below this zone.
I have used Fibonacci sequence to set the targets:
Buy betwee: 0.1593 to 0.1291
Sell between: 0.1861 to 0.2458
Regards,
Atif Akbar (moon333)
