Batusd


LONG BATUSD FIBO BULLISH PARABOLIC UPBATUSD has all indicators volume, bb, kc, fibo, + FCP forex (mechanical; check link below) --
forexwot.com
SHORT @ $0.20363 -- FIBO/PIVOT
STOP @ $0.15873
DISCLAIMER
NOT financial advise. Enjoy your weekend!
-@a1mtarabichi
P.S. Sorry for lack of publications lately; will update more frequently (a lot more) post mid quarter / mid-late OCT.

Bitcoin Cash Price Analysis BCH / USD: Looking For The BottomBitcoin Cash is consolidating around its current monthly trading low after the cryptocurrency suffered losses of around twenty percent, following the heavy early week decline in the cryptocurrency market.
The BCH / USD pair is now trading at its weakest level since April 2nd this year, with price probing a long-term trendline which could determine its fate going forward. Technical analysis suggests if price drops beneath the trendline, the cryptocurrency could tumble a further twenty percent.
The trendline in question has been in play since December 2018, with the BCH / USD pair remaining above the key trendline on the daily time frame ever since. Bitcoin Cash has seen a steady medium-term recovery while trading above the trendline, with the cryptocurrency peaking just above the $500.00 level this year.
The bearish breakout point is located around the $215.00 level and will be watched closely by traders over the coming sessions. A bounce from this key technical area will be encouraging for traders that are medium to long-term bullish towards Bitcoin Cash.
In the near-term, the recent decline in the BCH / USD pair has created significant amounts of bullish MACD price divergence on the one-hour time frame, which is a possible sign that a strong recovery in the cryptocurrency may be forthcoming.
The bullish MACD price divergence extends all-the-way towards the $290.00 level, which could be unwound if buyers can breakout above the most recent swing-high, around the $244.00 level.
Bullish MACD price divergence is also present from current levels to the $255.00 level. With the cryptocurrency market in full-on bear mode, a near-term recovery back the $255.00 level may be the more realistic scenario for the BCH / USD pair.
Sentiment
According to the latest sentiment data from TheTIE.io, the short-term sentiment towards Bitcoin Cash is bearish, at 36.00 %, while the overall long-term sentiment towards the cryptocurrency is bullish, at 61.00%.
BCH / USD Daily Chart by TradingView
Upside Potential
The one-hour time frame highlights the 50-period period moving average as the key upcoming resistance, around the $244.00 level. The next highest resistance level is $255.00.
The daily time frame highlights the $300.00 level as key, with bulls needing to mount a strong double-digit upside rally to reclaim the BCH / USD pair’s short-term bullish status.
Downside Potential
The downside is currently dominated by the previously mentioned long-term trendline, around the $215.00 level. Below this level the BCH / USD pair could quickly tumble towards the $200.00 level.
The daily time frame is currently showing that once below the $200.00 level, then the April 2nd trading low, around the $165.00 level, offers the strongest form of technical support.
Summary
Bitcoin Cash needs to stage a strong double-digit rally from current levels or it may suffer another round of heavy technical selling over the coming sessions.
The recently created bullish MACD price divergence suggests that the BCH / USD pair will eventually recover back towards the $290.00 resistance area.

Basic Attention Token Price Analysis BAT / USD: VulnerableBasic Attention Token is back under downside pressure as the broader cryptocurrency market slides lower, leaving the BAT / USD pair in a vulnerable technical position. The cryptocurrency staged a powerful upside rally over the weekend, gaining around thirty percent in value from its September trading low.
The latest sell-off in the cryptocurrency market has notably affected the BAT / USD pair, helping to erode around eighteen percent of its value from its monthly price peak and placing it in a undesirable technical position.
Going forward, medium-term technicals for the cryptocurrency certainly suggest that the BAT / USD pair could still encounter another round of heavy selling unless a sustained rally is enabled above its current monthly price high.
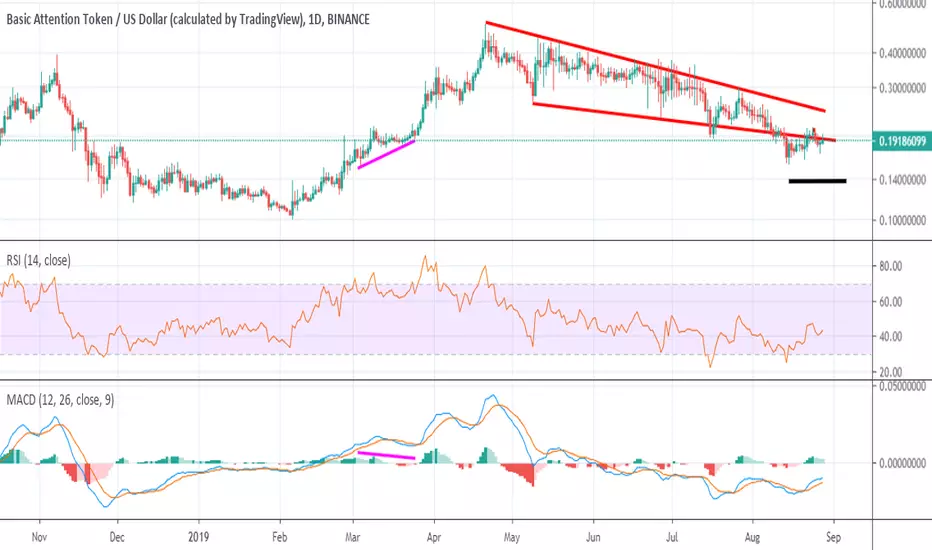
The daily time frame shows that the current monthly high is important as it the upper end of a large falling wedge pattern. The falling wedge pattern is characterized as a bullish reversal pattern with triple-digit upside potential, if a substantial upside breakout were to occur.
At present, no meaningful technical breakout has been sustained on the lower timeframes to suggests that the BAT / USD pair could stage such a breakout. In fact, price still trades below important moving averages on the four-hour time frame.
Worryingly for BAT / USD bulls is the negative MACD price divergence, which has been in place since February this year. The bearish MACD divergence is still very much in play and could see the cryptocurrency suffer losses of around thirty percent from current trading levels if it is unwound.
From a technical perspective a break below the current monthly trading low should encourage a sell-off towards the February trading low. Interestingly, the bottom-end of the falling wedge pattern is also located extremely close to the end of the bearish MACD price divergence, leaving sellers with a distinct downside target.
According to the latest sentiment data from TheTIE.io, the short-term sentiment towards Basic Attention Token is bullish, at 60.00 %, while the overall long-term sentiment towards the cryptocurrency is neutral, at 55.00%.
BAT / USD Daily Chart by TradingView
Upside Potential
The four-hour time frame highlights yesterday’s swing -high as the most important technical resistance area, prior to the BAT / USD pair’s current monthly trading high. A potential inverted head and shoulders pattern could form if a rally ensues above the current monthly trading high.
The daily time frame highlights the 50-day as a key technical area where bulls need to gain strength to encourage additional buying interest. At present, a breakout above the falling wedge pattern on the daily time frame is likely to prompt a major test of the cryptocurrencies 200-day moving average.
Downside Potential
The four-hour time frame is showing that the BAT / USD pair is testing towards its 200-period moving averages, leaving the September 18th swing-low as the strongest form of near-term support below.
The daily time frame is showing the current monthly trading low as the major technical support region. Below this area, the bottom of the falling wedge pattern offers the strong form of technical support.
Summary
Basic Attention Token has shed over half of its recent trading gains, placing it in a vulnerable technical position going forward.
If bulls fail to move the cryptocurrency back above the current monthly trading high, sellers could force the cryptocurrency back towards levels not seen since February this year.

Basic Attention Token Price Analysis BAT / USD: Pressed DownBasic Attention Token is still showing few signs of recovery as the cryptocurrency languishes towards its lowest trading level since March this year. Several technical indicators and price patterns are suggesting that the BAT / USD pair has further room to run lower and is not yet oversold.
The BAT / USD pair peaked on April 21st this year, with the popular crypto’s losses accelerating during early June. At current trading levels, the BAT / USD pair has lost over sixty-five percent of its value since from its yearly trading high, and trades around forty percent higher from the start of the year.
Looking ahead, technical analysis suggests that the cryptocurrency still has further to fall before it may start to begin a meaningful reversal. Firstly, the four-hour time frame shows a valid head and shoulders pattern, with the pattern holding a downside projection that would take the BAT / USD pair towards the $0.110000 level.
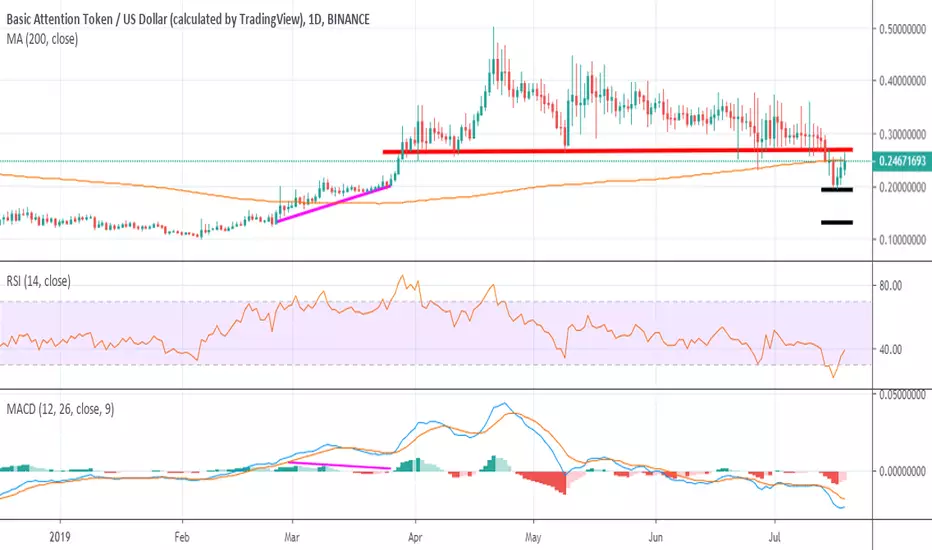
The daily time frame also projects further losses for the BAT / USD pair, with three obvious negative developments happening on this time frame. Firstly, a bearish death-cross is underway, while a bearish channel breakout is also in progress. The mentioned time frame also shows negative MACD price divergence that extends down towards the $0.150000 level.
The RSI indicator on the daily time frame also shows that the cryptocurrency is not yet oversold, despite suffering four-straight months of declines.
According to the latest sentiment data from TheTIE.io, the short-term sentiment towards Basic Attention Token is positive, at 63.00 %, while the overall long-term sentiment towards the cryptocurrency matches the daily sentiment, at 63.00%.
BAT / USD Daily Chart by TradingView
Upside Potential
The four-hour time frame is showing that the BAT / USD pair needs to break above the 0.208000 level to negate the bearish head and shoulders pattern on the mentioned time frame. The 0.270000 level is the foremost resistance area if a bullish breakout does occur.
The daily time frame mirrors the four-hour time frame in terms of key technical levels, with key trendline resistance at the 0.208000 level, while the BAT / USD pair’s 200-day moving average is located at the 0.270000 level.
Downside Potential
The head and shoulders pattern on the four-hour time frame dominates the technicals on the lower time frames, with the 0.168000 level the neckline and breakout point for the bearish pattern.
The daily time frame currently shows a bearish death-cross unfolding, with the 50-day moving average crossing over the 200-day moving average. The negative MACD price divergence extends down towards the 0.150000 level.
Summary
The short-term technicals for Basic Attention Token suggest a move towards at least the $0.150000 level, while medium-term analysis is even more bearish, and points to a drop towards the $0.110000 level.
Overall, the BAT / USD pair shows few signs of making a sustainable recovery, heightening the chances of further downside for the cryptocurrency.

Bat Mid-term Trend reversal [Tripple bottom and more]Thanks for visiting.
Key points:
1) We're facing historical lows + strong support
2) Triple bottom + lowering volumes are strong reversal indicators
3) 1st and 2nd take-profits are based on historical supports
Trade plan:
1) 1st take-profit 75% or 100% (if level will be holding for too long)
P/L ratio 3.66
2) 25% or 0 for the second one
STOPS: near green line

Basic Attention Token BAT/USD Analysis: Emerging From The DepthsBasic Attention Token is attempting to recover short-term bullish momentum on Wednesday as the cryptocurrency probes back towards the August 25th swing-high. The BAT / USD pair has been a notable underperformer in the cryptocurrency space this year, and has suffered a tumultuous fall since peaking around the $0.500000 level in April.
At current trading levels, Basic Attention is down over sixty percent from its 2019 price peak, but the cryptocurrency has gained an encouraging thirty percent since the start of the year. Technical analysis shows that the cryptocurrency turned bearish during mid-July, after slipping back under its 200-day moving average.
The MACD indicator on the daily time frame suggests that the BAT/USD pair may fall back towards its yearly opening price, as a significant amount of negative divergence still exists. The bearish MACD price divergence was created during the strong move higher in early March 2019.
The four-hour time frame shows that a head and shoulders pattern is forming. If the bearish pattern is triggered, the overall downside projection of the pattern will override the bearish MACD divergence, which could mark a turning point for the cryptocurrency.
According to the latest sentiment data from TheTIE.io, the short-term sentiment towards Basic Attention is neutral, at 48.00 %, while the overall long-term sentiment towards the cryptocurrency is bullish, at 65.00%.
Upside Potential
The four-hour time frame is showing that bulls need to move the BAT / USD pair above the 0.210000 level to negate the previously mentioned bearish head and shoulders pattern. The 200-period moving average on the four-hour time frame is also converging around the head of the bearish pattern.
The daily time frame highlights that a bearish death-cross is currently underway, with the 50-day moving average crossing over the 200-day moving average. Bulls need to move price above the 0.22100 level to negate the death-cross.
BAT / USD Daily Chart by TradingView
Downside Potential
The downside potential for the BAT/USD pair is focused around the neckline of the bearish head and shoulders pattern on the four-hour time frame. The neckline of the pattern is found at the $0.175000 level, while the current monthly low is located just below the neckline, at $0.161000.
The daily time frame highlights that bearish MACD price divergence extends down towards the $0.140000 level, which is interestingly the same overall target of the bearish pattern on the four-hour time frame.
Summary
Basic Attention is attempting to recover from a six-month trading low, although the technical outlook for the cryptocurrency still appears very bearish. Technical analysis suggests that the BAT/USD pair could fall further, with the $0.140000 level the immediate bearish target.
BAT pumpBitcoin looks to play nice for the time being. Meanwhile these alts could have potential to start popping finally. Macd divergence playing out, snake eyes on market cypher. Could see a good little pump
This is the macro though, lower time frames show some turbulence

BAT/USD - There Are No Mistakes, Only Opportunities!Hi, today we are going to talk about the Basic Attention Token (BAT).
At the BAT we observe at the chart the effect of the listing announcement at the Kraken exchange (recently highlighted at the media for the massive OTC volume), with the breaking of a Downtrend Line on the 4H timeframe chart. However, the price found a second and stronger Downtrend Line above, that made the price flinch. The first and overcome Downtrend Line works now as a support for the price, and the second one as resistance, on this zone of swing we might have good possibilities of trades.
* Trade and Funding will be available on Kraken, at 13:30 UTC on August 22.
Thank you for reading and leave your comments if you like.

Let's try to repeat the same setup on BAT/BTC Easy 10-20+% gainHello guys and hope everyone is doing well.
It's a good thing we took profit last time as BAT is in similar position as it was before.
Bullish divergence is happening again and this should provide an easy 10-20% gain again.
Targets are drawn on chart.

BATUSD#BAT ready for massive accumulation zones, perfect time for looking this coin, sincerely im gonna buy if price reach the trend line, if not my grey zone is perfect for long term investment.

BATUSD formed shark pattern | Upto 33% profit potential tradePriceline of Basic Attention Token / US DOLLAR has formed a bullish shark and entered in potential reversal zone.
RSI is oversold and turning bullish.
Stochastic RSI has given bull cross.
As per Fibonacci sequence the targets are as below:
Buy between: 0.20762 to 0.1915
Sell between: 0.22310 to 0.25651
Regards,
Atif Akbar (moon333)


BAT is located at the bottom of the horizontal channel. BAT is located at the bottom of the horizontal channel. Likely movement.
coinmarketcap.com
BAT is located at the bottom of the horizontal channel. Likely movement depicted on the chart. Very profitable and simple coin to trade.
Short in the last trading idea reached its goal.
I trade coins from time to time for more than a year. Here at tradingview, the first idea for it was in November 2018.
But remember, on the crypto market, anything can happen. An example of a MANA coin where a horizontal channel has been struck against the expectations of the crowd for more than a year. Therefore, trade according to the plan, but always have a backup plan.
And then a new temporary horizontal channel was formed which was very profitable and existed for about 1 month.


Let's See How Much Will Bat Increase. A Very Bullish TokenHi every one,
I introduce a powerful project with very bullish tecnique
I am developer of smart trading bot with artifical intelligence called mikabot
2 hourse ago, Mikabot told us, "batbtc broke long term trend from march"
That is very important.
Let' see how much batbct increase soon
If you have an idea, dont hesitate to give a comment

Basic Attentio Token BAT/BTC Bullish Divergence, Easy 20+%BAT is one of the Altcoins that has found its bottom and is looking to start its bullish run.
Short term, there is a Bullish Divergence between the price and the RSI. As it can be seen from the graph, the RSI keeps rising, while the price is hitting lower lows. This is a textbook Bullish Divergence and is a Bullish indicator on a shorter time frame.
On a longer time frame things are also looking very good for BAT/BTC.
As it can be seen from the picture above, we are at a critical strong support/resistance range for BAT/BTC. Weekly RSI is also oversold meaning that the sellers have been getting more and more exhausted. Recent volume spikes indicate a existing buying market
Considering everything that's been said, BAT should definitely go up to at least 0.00002700 on a shorter time frame, while on a longer time frames targets are 0.00003000, 0.00004000 and 0.00005000.

BAT BTC smaller time frame LONGRR>4
At 1 hr stoch crossing up + overall short term bullish momentum on larger timeframes to base this trade upon.

Basic Attention Token Price Analysis BAT / USD: The Razor’s EdgeBasic Attention Token / USD Short-term price analysis
Basic Attention Token has a bearish short-term trading bias, with the BAT / USD pair trading under its 200-period moving average on the four-hour time frame.
The four-hour time frame shows that a bearish breakout is currently underway from a neutral triangle pattern. The breakout has yet to reach its overall downside target.
Technical indicators on the four-hour time frame are bullish and continue to generate a buy signal.
Pattern Watch
Traders should note that the 0.10000 level is overall full downside objective of the bearish triangle breakout.
Relative Strength Index
The RSI indicator on the four-hour time frame is also bullish and continues to issue a buy signal.
MACD Indicator
The MACD indicator has turned bullish on the four-hour time frame, with both the MACD signal line and histogram generating a buy signal.
Basic Attention Token / USD Medium-term price analysis
Basic Attention Token has a neutral medium-term bias, with the BAT / USD pair now testing back towards its 200-day moving average.
The daily time frame is showing that a bearish head and shoulders has been triggered, with the BAT / USD pair now testing back towards key neckline resistance.
Technical indicators on the daily time frame are turning lower and continue to issue sell signals. Bearish MACD price divergence is also present on the daily time frame.
BAT / USD Daily Chart by TradingView
Pattern Watch
Traders should note that the overall downside target of the bearish head and shoulders pattern would erode the presence of negative MACD price divergence on the daily time frame.
Relative Strength Index
The RSI indicator is bearish on the daily time frame, although it is currently correcting from oversold conditions.
MACD Indicator
The MACD indicator on the daily time frame is bearish and continues to show the presence of negative MACD price divergence.
Conclusion
Basic Attention Token is testing back towards the neckline of the bearish head and shoulders pattern on the daily time frame, as technical traders test the validity of the recent breakout.
Failure around current trading levels is likely to see sellers target the full downside projection of the head and shoulders pattern, which would also erode the presence of any negative MACD divergence on the daily time frame.
BAT wings folded but with bullish divergence buildingBAT / BTC unlike many/most altcoin charts, appears to be building some slow but steady bullish divergence.
Room to come down in very near term but conservative target of 150% gain vs BTC by Christmas.
