BAT/USDT Golden Zone: Massive Rebound Potential from Historical 🔶 1. Strong Support Zone (Highlighted in Yellow):
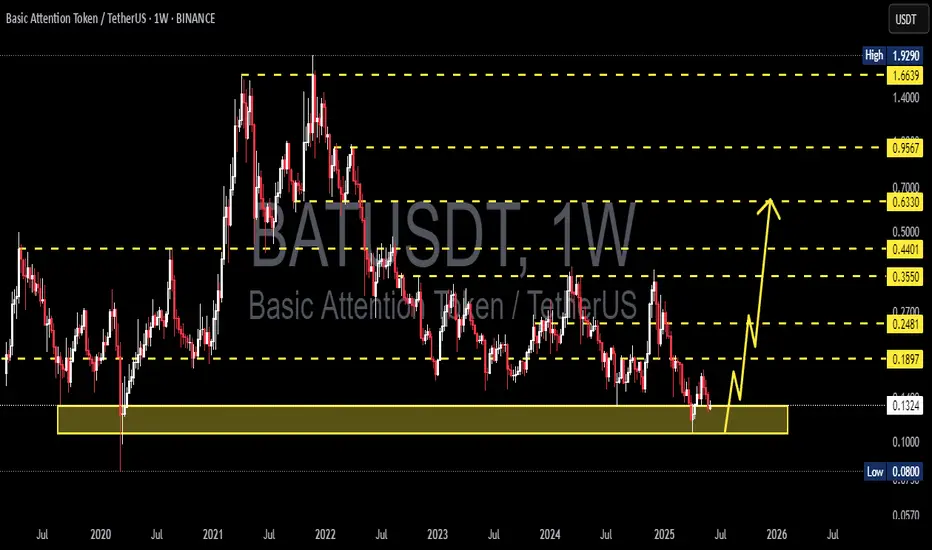
A key demand zone lies between $0.080 – $0.1212.
This area has acted as strong support multiple times since 2020, showing signs of institutional accumulation or whale interest.
🔼 2. Bullish Reversal Scenario:
A recent bounce from this golden support zone suggests a potential bullish reversal.
The projected path (yellow arrows) illustrates a step-by-step rally toward multiple resistance levels.
Potential Upside Targets:
🔹 $0.1648 (Initial minor resistance)
🔹 $0.2098 (Previous consolidation zone)
🔹 $0.3551 (2023 distribution zone)
🔹 $0.4368 (Major pre-breakdown resistance)
🔹 $0.6275 (Medium-term bullish target)
🔹 $0.9412 – $1.6487 (Long-term resistance levels)
📉 3. Risk Management & Invalidations:
A weekly close below $0.1212 may trigger a move toward the $0.090 – $0.080 historical low zone.
A breakdown below that would invalidate the bullish outlook and call for a reassessment.
📆 4. Timeframe & Additional Signals:
This is a weekly timeframe chart, ideal for swing or long-term traders.
While volume confirmation is not yet strong, the early formation of a higher-low suggests a possible trend reversal.
✅ Conclusion:
BAT/USDT is currently trading in a high-probability reversal zone with strong historical support. If this zone holds, it could trigger a significant multi-level bullish rally. A good opportunity for patient traders with proper risk management.
Batusdt

BATUSDT 1W AnalysisBAT ~ 1W Analysis
#BAT This trade is very high risk
This is the lowest support block for now. Buy with a short term target of at least 20%+ from here.
BATUSDT 1D Analysis BAT ~ 1D Analysis
#BAT Buy gradually from here if you still have confidence in this coin with a short term target of at least 15%+ from here.

BATUSDT 1D AnalysisBAT ~ 1D Analysis
#BAT Buy when re -testing this support block with a short -term target of at least 10%+ from here.

BAT ANALYSIS🚀#BAT Analysis :
🔮As we can see in the chart of #BAT that there is a formation of "Falling Wedge Pattern". In a daily timeframe #BAT broke out the pattern. Expecting a bullish move in few days if #BAT retest the levels
⚡️What to do ?
👀Keep an eye on #BAT price action. We can trade according to the chart and make some profits⚡️⚡️
#BAT #Cryptocurrency #TechnicalAnalysis #DYOR

Basic Attention Token, An Old FriendLet's take the market bottom as the low that was set in June 2023, what do you see?
One single signal can reveal the bottom is that true?
One single signal can tell you everything that is going on with a chart, or not.
It is more about your experience, what you know about the market and the market cycle.
The main bottom for the 2022 bear market for Basic Attention Token (BATUSDT) happened in December 2022, after it goes sideways but, let's take June 2023 as the market bottom for the purpose of this chart.
#1 on the chart is a stop-loss hunt event. It leads to a bullish wave.
#2 on the chart is the same; a reversal comes next.
The bullish signal is in because #2 is already gone. The action went below long-term support (June 2023 low) is now trading back above it. Three weeks green, bull confirmed; yes we win! Yes, I win!
So this is easy don't you agree?
What's the potential for growth?
An easy target will give us some 350%. A strong target will give us 795%. Strong is not the best. We can end up with better target specially if we consider how the market in the past behaved.
Are you with me?
What do you see?
Do you agree?
The comments are the feedback, interact with me; what do you see?
Do you agree that this chart is green and set to grow?
If you agree boost, if you disagree boost and follow.
Thanks a lot for your support.
A strong rise can take more than a year to develop. With a low in August 2024, a high can happen in August 2025. Sounds early, looks early, feels early but can happen.
Taking the lowest point since the March 2020 bottom, April 2025, an entire year of bullish action would put an All-Time High in April 2026. This sounds good but, can it be true?
Too good to be true or too hard to believe?
If the bull market can be late to start, it can also end late.
Let's hope the bullish action goes beyond 2025 into mid-2026, that would be the best. The longer it takes, more time to adapt, plan and to secure wins and profits.
Thanks you for reading.
Namaste.

BAT is getting close to the buyers' zone (3D)After multiple drops, it seems that BAT is getting close to a strong support level. In this zone, it is possible to buy gradually in spot.
The targets are indicated on the chart.
The closure of a daily candle below the invalidation level will invalidate this analysis.
Do not enter the position without capital management and stop setting
Comment if you have any questions
thank you

BATUSDT 1WBAT ~ 1W Analysis
#BAT Buy gradually from here with a short -term target of at least 20%+. This is the lowest support block for now.

BATUSD - Bullish Phase StartsHello,
Altcoin season starts,
BAT is already listed on Grayscale, it can be compliant for an ETF also.
Good Fundamentals,
Thanks,
St Gex

BAT ANALYSIS🔮#BAT Analysis :
📈📈 #BAT is making perfect Double Bottom Pattern. We can see a good pump if #BAT breakout the major resistance zone with good volume and sustains the higher price after breakout 🚀🚀
📊 Current Price: $0.1675
⏳ Target Price: $0.1800
⁉️ What to do?
- We can trade according to the chart and make some profits in #BAT. Keep your eyes on the chart, observe trading volume and stay accustom to market moves.💲💲
#BAT #Cryptocurrency #Pump #DYOR #Breakout

BAT Repeating Patterns Before a Potential 900% SurgeBINANCE:BATUSDT retesting the neckline of head & shoulder top, it surged 900% last time after retesting, potential buy point now?
🔴 Read my signature & publications for more info you don’t want to miss.
🔥 for more future "guesses" like this!

BATUSD, ANOTHER 1,000% OPPORTUNITYBATUSD (Basic Attention Token), a crypto project designed with the goal of making Crypto and DeFi accessible to everyone.
In the founders own words: "Crypto and DeFi are hard to use and the $330 billion digital advertising industry is failing users, publishers and advertisers. With Basic Attention Token and Brave we want to take Crypto to the next 1B users and solve the endemic inefficiencies and privacy violations hobbling the digital ad industry."
This project for me is ape worthy, back end, front end, people involved, mission... everything is perfect on this. There is some great experience pushing this project with the likes of Brendan Eich who is the Founder & CEO (Also the creator of Firefox, Javascript and Mozilla).
Lets also appreciate a perfect chart when we see one, the initial pump has already taken place, affirming the volume and liquidity this project can draw from the market. Whilst BTC is stagnant of course all of the Alt's also are stagnant but when BTC pumps again, and we all know it will BAT is going to be a flyer.
From a technical & buying stand point, based on my technicals i would be happy to buy at anywhere under the $0.10 price point, what a bargain that would be. This would be a completion of the Fib and could work out perfectly in time with the next bull run.

BATUSDT 1WBAT ~ 1W
#BAT If you still have a Conviction on this Coin, buy gradually from here with a minimum target of 20%+

BATUSDT: Blue Box Opportunity Ahead?BATUSDT: Blue Box Opportunity Ahead? 💹
The blue box below could be an ideal entry zone, but only if market conditions align. As always, patience and precision are key, don’t jump in without confirmation.
How to approach this:
Blue Box: A potentially strong demand area worth monitoring closely.
LTF Confirmation: Wait for low time frame (LTF) structure breaks before executing trades.
Smart trading wins the day! Manage your risk, watch the charts, and stay ready. Boost, comment, and follow for more expert insights! 🚀
Let me tell you, this is something special. These insights, these setups—they’re not just good; they’re game-changers. I've spent years refining my approach, and the results speak for themselves. People are always asking, "How do you spot these opportunities?" It’s simple: experience, clarity, and a focus on high-probability moves.
Want to know how I use heatmaps, cumulative volume delta, and volume footprint techniques to find demand zones with precision? I’m happy to share—just send me a message. No cost, no catch. I believe in helping people make smarter decisions.
Here are some of my recent analyses. Each one highlights key opportunities:
🚀 GMTUSDT: %35 FAST REJECTION FROM THE RED BOX
🎯 ZENUSDT.P: Patience & Profitability | %230 Reaction from the Sniper Entry
🐶 DOGEUSDT.P: Next Move
🎨 RENDERUSDT.P: Opportunity of the Month
💎 ETHUSDT.P: Where to Retrace
🟢 BNBUSDT.P: Potential Surge
📊 BTC Dominance: Reaction Zone
🌊 WAVESUSDT.P: Demand Zone Potential
🟣 UNIUSDT.P: Long-Term Trade
🔵 XRPUSDT.P: Entry Zones
🔗 LINKUSDT.P: Follow The River
📈 BTCUSDT.P: Two Key Demand Zones
🟩 POLUSDT: Bullish Momentum
🌟 PENDLEUSDT.P: Where Opportunity Meets Precision
🔥 BTCUSDT.P: Liquidation of Highly Leveraged Longs
🌊 SOLUSDT.P: SOL's Dip - Your Opportunity
🐸 1000PEPEUSDT.P: Prime Bounce Zone Unlocked
🚀 ETHUSDT.P: Set to Explode - Don't Miss This Game Changer
🤖 IQUSDT: Smart Plan
⚡️ PONDUSDT: A Trade Not Taken Is Better Than a Losing One
💼 STMXUSDT: 2 Buying Areas
🐢 TURBOUSDT: Buy Zones and Buyer Presence
🌍 ICPUSDT.P: Massive Upside Potential | Check the Trade Update For Seeing Results
🟠 IDEXUSDT: Spot Buy Area | %26 Profit if You Trade with MSB
📌 USUALUSDT: Buyers Are Active + %70 Profit in Total
🌟 FORTHUSDT: Sniper Entry +%26 Reaction
🐳 QKCUSDT: Sniper Entry +%57 Reaction
📊 BTC.D: Retest of Key Area Highly Likely
This list? It’s just a small piece of what I’ve been working on. There’s so much more. Go check my profile, see the results for yourself. My goal is simple: provide value and help you win. If you’ve got questions, I’ve got answers. Let’s get to work!

BAT can ascend further!BINANCE:BATUSDT
BAT is in an ascending Triangle Right now! we know that the price will increase after the break out and confirmation happens!
the price should increase and reach the resistance shown on the picture!

BATUSDT 1WBAT Update ~ 1W
#BAT So far it still maintains its bullish structure. Buy gradually within this support block,. minimum target 20%+

Price rengeBAT/USDT Chart:
Trend: Uptrend Price above moving average (yellow line).
Support: Green zone
Around 0.2317.
Resistance: Red zone Around 0.3778.
Possible Strategy:
Buy: Breaked EMA snd firs resistance
Sell: If price fails to break resistance
Note: Always consider market new and overall trends.

Long trade idea for BATUSDTLong trade idea for BATUSDT
Falling Wedge measured from NOV 2024
Do note potential pullback according to purple line.
Potentially min 218% profit from current date. Target $1.03
Note that there are Bearish Order Blocks as shown.
Do exercise due diligence and that all trades comes with risks

BAT About to Break Out or Break Down? Critical Levels You Can't Yello, Paradisers! Could #BAT Be Ready to Explode? Here’s Why You Need to Watch Closely!
💎#BATUSDT is currently sitting at a critical demand zone of $0.1690, and it’s showing signs of a potential bullish continuation. We’ve been tracking #BAT closely as it navigates a descending channel, and it’s now on the brink of a breakout. If the price maintains this upward momentum, a powerful bullish surge could be on the horizon.
💎For this bullish scenario to play out, #BAT needs to break above the internal resistance level at $0.2070. A successful break here could ignite a significant rally, with the initial target set at the minor resistance zone of $0.2715.
💎 However, stay alert! If momentum fades at the demand zone, a rebound could occur from the lower support area around $0.1482. A daily close below this support would invalidate our bullish outlook and potentially lead to further declines.
💎Stay sharp, Paradisers! Keep a close eye on #BAT's price action because the next move could be a true game-changer. Remember, patience and discipline are key to capitalizing on these market opportunities!
Trade smart and stay focused – the best opportunities are often just around the corner!
MyCryptoParadise
iFeel the success🌴

BAT USD bullish monthly close, upward continuation to ATH likelythe monthly BATUSD candle closed with minimal wick and onward continuation upwards is most likely. BAT may reach and exceed its ATH within the next 3-6 months.
Not financial advice.

BAT/USDT Analysis: Ready for a Breakout?👀👉 Currently, BAT/USDT is trading within a range on the 30-minute chart. We're at a pivotal moment where a breakout could occur in either direction—bullish or bearish. While the higher timeframes indicate a bullish trend, predicting cryptocurrency movements can be quite challenging. We must remain cautious, as sideways price action often leads to unexpected rallies or declines. A strategic approach is to wait for a decisive break above or below the current range. This will help us identify the direction to engage in the market effectively. Remember, this video is intended for educational purposes only and should not be considered financial advice.

BAT ANALYSIS🔮 #BAT Analysis 💰💰
🌟 As we can see that #BAT is testing its major resistance zone also forming "W" pattern. If the candle closes above the resistance zone then we will achieve our new Target
🔖 Current Price: $0.2495
⏳ Target Price: $0.3500
⁉️ What to do?
- We have marked some crucial levels in the chart. We can trade according to the chart and make some profits in #BAT. 🚀💸
#BAT #Cryptocurrency #DYOR

BAT ANALYSIS (8H)From the point where we placed the red arrow on the chart, the correction of BAT has started.
It looks like a correction of a triangle.
The green area is the right place to finish the C wave of this triangle. We are looking for buy/long positions in the green range.
The targets are marked on the chart.
Closing a daily candle below the invalidation level will violate the analysis.
For risk management, please don't forget stop loss and capital management
When we reach the first target, save some profit and then change the stop to entry
Comment if you have any questions
Thank You
