BAT Reached Support Zone with Confluence on Volume ProfileHey all, here’s another entry on my tradingview series called 'Quick Updates'.
We can witness this nice confluence on the support zone by price, but also by volume profile. This is clearly a very important area for BAT. That's why this could be a very interesting LONG position using a standard support and resistance trade setup.
--- What is The Quick Update Series All About? ---
I have started a new tag (quickupdates) where I quickly share great opportunities based on TA for shorter timeframes, such as 4h, 1h, and 15m. It will contain a brief explanation with clear and clean charts in order to keep the velocity up and make sure you get to see the opportunities as fast as possible.
Follow me for consistent high quality updates, with clear explanations and charts.
Please like this post to support me.
- Trading Guru
--------------------------------------------------------------
Disclaimer!
This post does not provide financial advice. It is for educational purposes only!
Batusdt


#BAT Breakout [April, 8th]The price has broken through the ascending triangle and tested the support . I'm going to place a part of buy orders here and into the green zone.

Basic Attention Token (BAT) - April 5Triangular convergence is reaching its peak.
You need to see if you can climb above the 0.15494740 point to get support.
Must be supported at 0.11939172.
----------------------------------------
Please click "Like".
If you click "Like" a lot, we will update it immediately when there are any unusual features.
Thank you.

Basic Attention Token | Be Ready For A Roller Coaster MoveHead & Shoulder pattern:
On daily chart the Basic attention token formed a Head and Shoulder pattern. This move was started on 18th December 2019 and now we can see that after the completion of this pattern the priceline has broken down the neckline and even dropped more down.
A death cross can lead the priceline down:
On the same daily chart 50 simple moving average formed a golden cross with the 200 simple moving average on 9th February 2020. After this golden cross the traders had expectations that the priceline of Basic attention token will start more powerful bullish rally. After this golden cross the BAT token has hit up to $0.3221 and after that the price line started dropping. Then after 14th of February up till so far we can see the priceline is bearish. Now the 50 simple moving average again started moving down to form the death cross with the 200 SMA. And today we can see that 50 simple moving average is touching the two hundred simple moving to cross down for the completion of this death cross. And this bear cross can lead the pipeline again more down.
Bullish Shark formation can again lead the BAT token to drop again:
There is another very strong indication being appeared signaling towards bearish move. And that is the priceline is likely to complete a bullish Shark pattern. We can observe that the initial leg was started on 13th March 2020 and after the completion of first leg on 20th March 2020 price action is retraced between 0.382 to 0.618 Fibonacci level and this is the 1st confirmation of Shark. Then the priceline is projected between 1.13 to 1.618 Fibonacci projection of A to B leg and this is the second confirmation of bullish Shark. Now we can expect that the final leg will be formed as required for the bullish Shark pattern and the priceline is expected to be retraced between 0.886 upto 1.13 Fibonacci level. In this case we can expect the drop upto $0.0888 to $0.07. This area would be the potential reversal zone of this bullish Shark. And from this area we can expect a bullish divergence that can help to end up the bearish move that was caused by the Head and Shoulder formation and the death cross of 50 simple moving average with 200 SMA on daily chart.
On long term we are still bullish:
But if we see on the long term then this bearish move on daily chart will not affect the expected long-term bullish move of Basic attention token. If we see on weekly chart the basic attention token has formed a falling wedge pattern and it has already hit at the support of this wedge on the candlestick that was opened and closed on 9th March 2020. In case of the completion of bullish Shark pattern that is being formed on daily chart we can have another touch at the support of this wedge even we can expect is a spike beyond the support like we had on 9th March 2020. But it will be not possible for the price line to breakdown the support of this falling wedge because if we see the volume profile of the complete price action moving within this falling wedge then it can be clearly observed that the traders are not interested to trade below $.135 and the point of control level of volume profile is at $0.19. Therefore the price action can move up at anytime at least up to the POC level of this volume profile. And we cannot expect the breakdown of the support unless the trader’s interest would not be developed below the support of this pattern.
A very big bullish Shark is still in play to produce bullish divergence soon:
And if we switch to 2 week chart then a very big bullish Shark pattern is still in play that I have already shared with you in my previous posts. According to this Shark pattern we are already moving in the potential reversal zone of is Shark pattern that has been formed on this 2 week chart. But if the price action will move upt $ 0.0888 to $ 0.07 for the completion of the smaller bullish Shark that is being formed on the daily chart then we can have only a spike beyond the potential reversal zone of this big shark that has been formed on the 2 week chart, Like we already have seen on the candlestick that was opened and closed on 2nd March 2020.
Conclusion:
On short term and midterm the Basic attention token can face bearish move upto $0.0888 to $0.07.
But on long term the BAT token will be still bullish unless the priceline will not break down the support of falling wedge that has been formed on weekly chart.

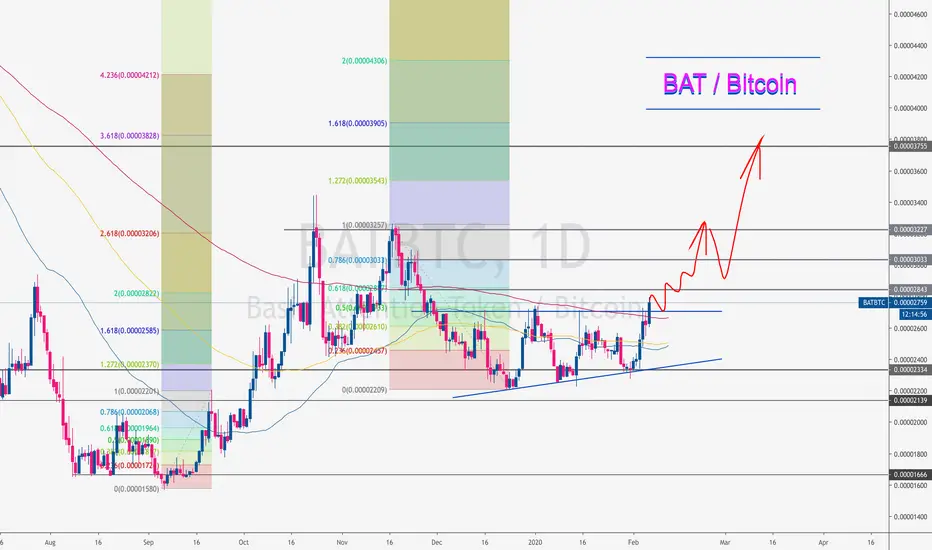
Bearish Signal Based Off Descending Triangle for BAT BTCHi all,
The Trading Guru is back here with a bearish scenario on BAT. After the big pump 4 days ago, we have seen several attempts of bringing the price down. Each attempt resulted in a bounce off around the 0.00002180 zone. However, every subsequent bounce has been slightly weaker. This is a very bearish signal, and is called a descending triangle.
I expect the price to break through the support soon, as we can see the bears are clearly winning from the bulls at this point. Only once the price goes back to normal ranges as defined by the horizontal support, it will become more unpredictable about what will happen with the price. At this point we should leave the trade.
Follow me for consistent high quality updates, with clear explanations and charts.
Please like this post to support me.
- Trading Guru
--------------------------------------------------------------
Disclaimer!
This post does not provide financial advice. It is for educational purposes only!
About the links below:
20% Discount on Binance: Did you know that Binance introduced a new system where you can get 20% discount on your fees? Find the step-by-step guide on how to add it to your account on the website of 100eyes
Forex & Crypto Scanner: Nobody can keep track of all the pairs on all timeframes. This scanner works on Telegram and sends an automated message including a chart every time something happens to a coin. E.g. it can automatically detect areas of support and resistance, RSI Divergences, Fib Retracements, and more.

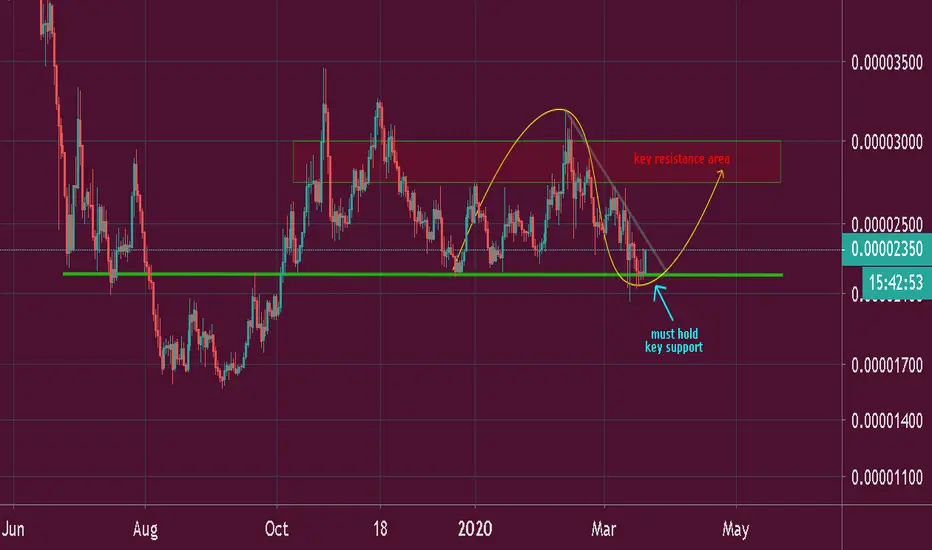
BAT/BTC TA Update (must hold key support)BAT/BTC
BAT just barely closing below important support at 2200 sats level and currently holding it for 7 days already.
BAT is approaching immediate trend-line resistance which is located between 2300-2400 sats.
If the bulls can break this key trend-line, we may conclude that new support is built and we can expect a short-term rally up to 2700-3000.
If you are a conservative trader, waiting for the breakout confirmation is a must to add an extra layer of security.
BATUSDT Retesting inside the descending traingle( 1500 cents)Hi, BTC bounced from the april 1st fools date (below 4k) to 5kusd. Im thinking the alts will somewhat bounce based on their charts and one of them is BATUSDT. We might retest the lower side of the descending triangle that will shoot around 15cents(red bar).

Bullish Basic Attention Token ?I like $0,17 .
Disclaimer:
We are not registered or licensed in any jurisdiction whatsoever to provide investing advice or anything of an advisory or consultancy nature,
and are therefore are unqualified to give investment recommendations.
Always do your own research and consult with a licensed investment professional before investing.
This communication is never to be used as the basis of making investment decisions, and it is for entertainment purposes only.
Basic Attention Token Daily Setup BATUSDTDaily Chart with Fibonacci retracements on BATUSDT
As you can see we are sitting right at the .236 fib retracement level, which indicates we could see a bounce.
I like BAT as it has a working product, aka Brave Browser + BAT
Looking for a retrace up especially if BTC bounce up from these lower 8700 levels. Lets see what happens GLTA
(BAT) prices as of 2/28/20
$0.219139 USD (-2.82%)
0.00002508 BTC (-1.35%)
0.00095237 ETH (-2.14%)
Market Cap
$313,478,407 USD
35,883 BTC
1,362,359 ETH
Volume (24h)
$65,589,593 USD
7,508 BTC
285,049 ETH
Circulating Supply
1,430,500,738 BAT
Total Supply
1,500,000,000 BAT

#BAT is near a major resistance level, good bounce is expected#BAT is looking good and it seems that March will be a profitable month for holders.
The coin almost reach its major support which has been holding the price from falling since 2018 year. Expect to see a nice-bounce in mid-term.
My previous idea on #BAT:
If you like my idea, Follow and Like and Comment.

one more look at BAT fractals
This is another fractal looking to repeat. Hence why I believe this support will hold.
Similar looking price action here, with fractals.Going long after this dip to support again. retest than pump perhaps.

Seeking for $BAT to dip for %gain of 70Assuming and ready to catch $BAT to dip a bit more to seek for decent %gains

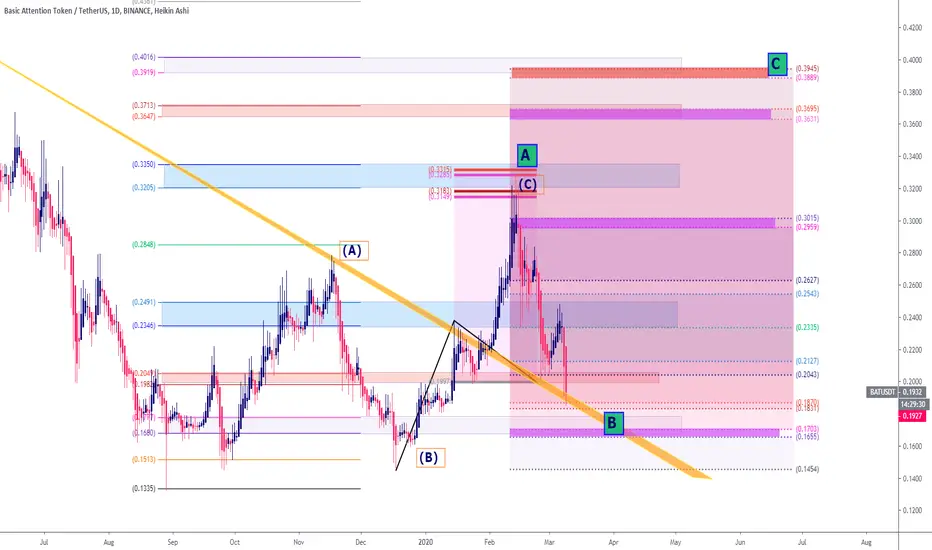
BAT can breakdown the support to complete the BAT patternA Recap:
In my previous post we have see that the Basic Attention Token had found the resistance at: $0.1959 and support at : $0.1487 and this support was not broken since 29 Aug 2019 when the price action took drop more than 29% upto $0.1326 but failed to breakdown this support.
And after finding this firm support the price action was moving sideways above this support level since Aug 2019 to Dec 2019 and in the meanwhile the price action was hitting the upper band of Bollinger bands and the mouth of bollinger bands was expanding and moving up and Relative Strength Index ( RSI ) was oversold up till 18 Dec and was turned bullish and Moving average convergence divergence ( MACD ) was turned strong bullish.
The Directional movement the +DI has crossed up -DI and ADX is above 29 level and giving strong bullish signals.
And upto 12hr chart the Ichimoku cloud was turned bullish and lagging span of ichimoku cloud had crossed up the priceline and the price action also crossed up the bearish cloud on the other hand the chop zone had also given strong bullish signals by turning bullish.
On daily chart simple moving averages were also expected to form an open Alligator’s mouth and with all these bullish signals the price action also formed a bullish Shark pattern and entered in potential reversal zone.
Based on all above indicators I predicted that the priceline of BAT token will now breakout the $0.1959 resistance and it will hit the next resistance at: $0.2695
Now What Next? :
Retesting The Previous Resistance As Support:
Now we can see that the price action not even broke out the $0.1959 resistance but also has broken out the $0.2695.
From this level the Basic attention token was expected to retest the recent broken resistance as support and move up to next resistance level at $0.4067 as the BAT token did after breaking out the previous resistance level of $0.1959.
But this time while retesting the recent broken resistance as support the candle sticks are likely to cross down this support or retesting is being failed.
This candle stick is the make or break for Basic attention token because if this support will be broken down than the price action may move more down to retest the previous resistance level at $0.1959, in this situation the coin will loss 39% of its value from the recent high of $0.3221.
But in case the sell will be stopped here and price line will not breakdown this support then we may see the price action to move to next resistance level at $0.4067 and after this resistance level will have only one and final resistance at $0.4493 and if this final resistance will be broken out then the Basic attention token can start a very powerful rally to make new high that will be highest price ever in the history of BAT token.
A Formation Of Bullish Harmonic Pattern:
If we see the short term 4 hour time period chart then the price action is forming a bullish BAT pattern and at this time the final leg C to D is being formed the dimensions of this pattern is as below:
After initial leg (X to A) the A to B leg is retraced between 0.382 to 0.50 Fibonacci and then B to C leg is almost projected between 0.382 to 0.886 of A to B leg's Fibonacci projection (here I have ignored extra spike coz all other legs are perfectly driven) now the final (C to D) leg should be retraced between 0.786 to 0.886 Fibonacci for a perfect bullish BAT pattern and then the price action will be entered in potential reversal zone of this bullish BAT pattern.
As per above pattern we can see that the situation Is still in favor of bears unless the previous support of $0.1959 won’t be retested because the potential reversal zone goes very close to this support however the formation of this pattern is also a hope that the price action may not break down the previous support.
Long Term Perspective:
As on 26th Oct 2019 I posted an article where I revealed that the price action of Basic attention token has formed a big bullish BAT pattern on long term week chart and at that time the price action was in potential reversal zone of this big bullish BAT:
Based on this pattern and some other bullish signals I predicted that the price action may hit the price level between: $0.28328 to $0.42727.
Then from Dec 2019 to Feb 2020 the price action started a bull rally and gained more than 110% value.
Here if we see the 0.786 Fibonacci projection of this pattern then it is at $0.42727 which is very close to its final resistance and at this time the priceline has already hit the 0.50 Fibonacci projection if the price action moves more up from here to breakout the 0.786 Fibonacci level then the Basic attention token will definitely breakout the final resistance as well to make all time high.

BATUSDT break that that 28 cents pleaseMassive resistance at .28 cents (red line) If we break above that I believed it will pump the price up. Sold half of my holdings. I do hope it will go down to 17 cents haha.

BAT!!BAT just had a STRONG 2 day candle close over my 2nd target! Could possibly add to the position the retest (if there is one) on that target.
Not financial advice.

$BAT - Breaking seems validLong term triangle is breaking for $BAT
Waiting for a move to the top of this pattern
Not a Financial Advice

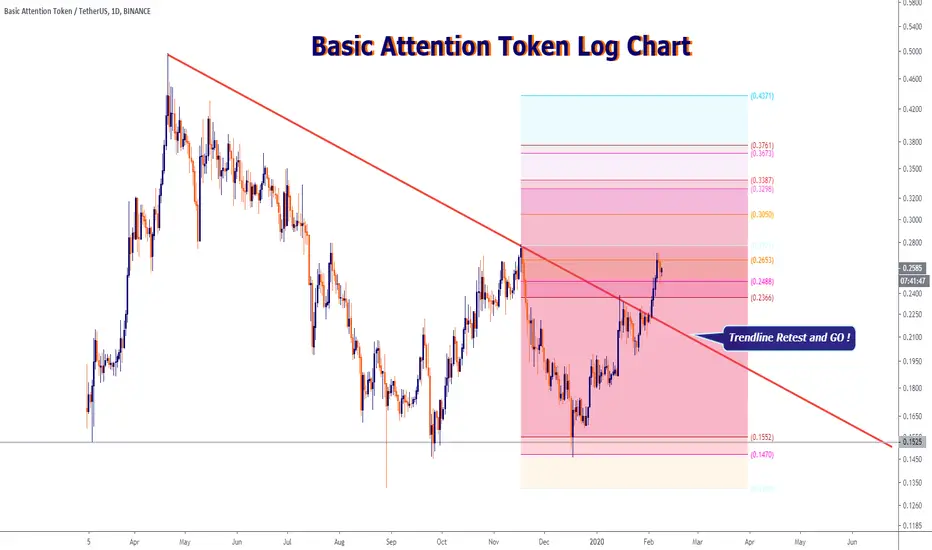
Bassic Attention TokenNeeds to retest trendline ?!
Ater that....🚀🚀🚀
Disclaimer:
We are not registered or licensed in any jurisdiction whatsoever to provide investing advice or anything of an advisory or consultancy nature,
and are therefore are unqualified to give investment recommendations.
Always do your own research and consult with a licensed investment professional before investing.
This communication is never to be used as the basis of making investment decisions, and it is for entertainment purposes only.
BATBasic Attention Token just break out resistance line of triangle
After Impulse we forming triangle and now we break out and I think we will continue to growing