QNX Everywhere.”Every movement in the market is the result of a natural law and of a cause which exists long before the effect takes place and can be determined years in advance. The future is but a repetition of the past, as the Bible plainly states…” -- W.D. Gann
youtube.com
"Down just means, not up yet" -- Bathsalt
BB

HSI on the climb—ride the waves with your own strategy!6May2025
Hello everyone! how was the HSI trade so far?
From the previous updates trust everyone likely knows how the movement of the Index.
Paying attention on how it moved and the forecast of futures movement seems predicted. Of course, some times it may not go according to what you forecasted. Hence, to develop your own trade plan is essential.
From previous posts:-
MACD - Deadcross formed 20/3/2025 on D Chart.
MACD - Goldencross formed 21Apr2025 on D chart, although still within bearish zone but it did a short bull run since then; opened at 21015 on 22Apr and as of writing 22613; it gives around 1598pts ~7.6% gained.
CAPITALCOM:HK50
Fast forward to now:-
4H chart
at point of writing ✍️: the Index uptrend mode is on track again.
Trade for profit requires persistency and consistence. The constancy is kind of boring.
Buy into support Sell at resistance.
Set your TP/SL & protect your capital.
currently on D Chart -
20EMA:22065; 50EMA:22080 (both are sticking together at the moment and curving up)
🚨 as of ✍️ :
🗝️ Resistance Level : 22700-22730
🗝️ Support Level : 22360-22400
🗝️ Strong Support Level : 21950-21990
W Chart:- HSI:HSI
HSI continues its Bullish mode with strong pullback! Recovery could expected to see in end Jun - early Jul'25.
17Mar2025 -
24Mar2025 -
7Apr2025 -
6May2025 -
Continue the Long call for HSI:HSI with the forecast and repetitive of history the next 4-6weeks might be a good profit taking level; hold any long position and manage the risk as well.
Target to take profit: 24630-24910 (it may break 25000 level, and paused at 25300 strong resistance level, you may crosscheck with Month chart for the Bullish trend; last week the MACD signal line break above the zero level.)
For current markets condition, the CHN & HKG continue to be volatile with the continuing noise from tariff and on macro the numbers could be mixed.
🎯 Reminder: For long term (6-18 months) continue to accumulate China & HKG for the potential upside for the year! All retracement is a good entry point. Again, everything is impermanence. Manage your risk, position sizing. Take only the risk that you can afford.
🔎 DYODD and don't listen to anyone. Invest in yourself, do some study and learn along the way while you trying to verify or finding the answer if to start invest in CHN/HKG markets. If you don't know how or where, you may ask Deepseek/Chatgpt for most reputable Trading courses nearest to you.
Stay sharp, trade smart, and let consistency be your superpower. 📈🍵📙
Continue to trade; continue your life as it is!
Happy Trading!
** Please Boost 🚀/LIKE 👍, FOLLOW ✅, SHARE 🙌 and COMMENT ✍ if you enjoy this idea! Share your trading journey to encourage peoples who pursing the same journey.

HSI testing resistance levels —will it break through or bounced?25/03/2025
🚨🚨🚨
HSI resistance is being tested for short-term!
Investors tend to take profit towards quarter end.
HSI:HSI
MACD - Deadcross formed 20/3/2025.Resistance 24750-24600 level.
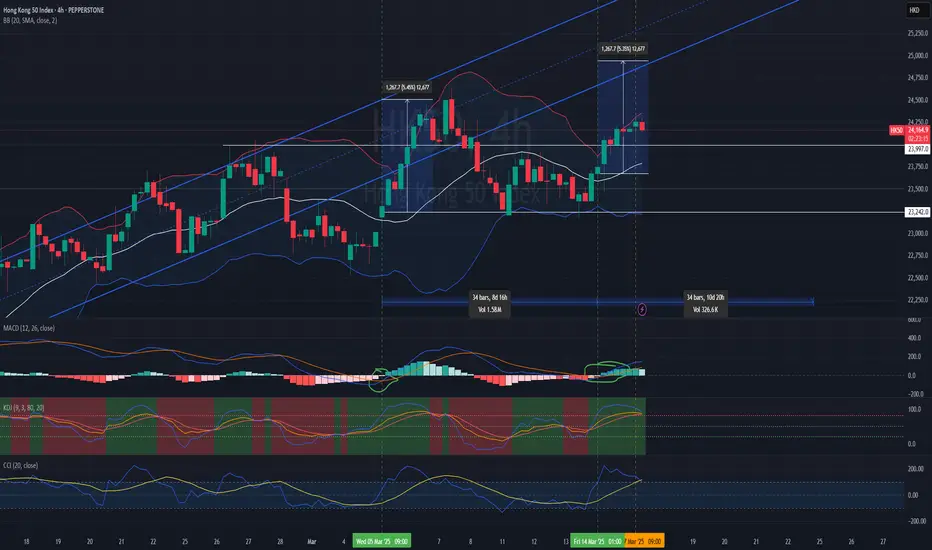
4H chart: PEPPERSTONE:HK50
at point of writing ✍️: the Index uptrend mode is paused and moving out of bound from the uptrend channel.
MACD : moving below zero line - Bearish mode.
KDJ: below 30 level in the bearish zone. Hopefully the divergence cycle completing soon for a strong reversal.
BB - ranging at lower BB; mid-line:23986 (this is your 🗝️ level for your long/short TP/SL level)
Set your TP/SL and let the markets works.
For this week trade plan: Most likely short the index for days to few weeks until get confirmation of trendline back to uptrend channel. Buy into support Sell at resistance. Set your TP/SL.
🚨 as of ✍️ :
Support/Resistance Levels :
22979
23030
23242(23374)
23526
23997
24385
24586
24648
24945
🗝️🗝️🗝️Level: 23526-23620
HSI continues its Bullish mode.
W Chart:-
17Mar2025 -
24Mar2025 -
📰 another -ve news, but this might be distraction. 🚨
www.tradingview.com
Shares in Hong Kong slumped 487 points or 2.0% to 23,417 on Tuesday morning, reversing gains from the prior session amid concerns over U.S. recession risks and China’s deflation threat.
www.tradingview.com
** Hong Kong's benchmark Hang Seng Index declined 2.2%, and the Hang Seng Tech Index
HSTECH lost 3.5%.
For current markets condition, the CHN & HKG can be volatile with the continuing noise from tariff.
🎯 Reminder: For long term (6-18 months) continue to accumulate China & HKG for the potential upside for the year! All retracement is a good entry point.
🔎 DYODD and don't listen to anyone. Invest in yourself, do some study and learn along the way while you trying to verify or finding the answer if to start invest in CHN/HKG markets. If you don't know how or where, you may ask Deepseek/Chatgpt for most reputable Trading courses nearest to you.
Let's follow our own strategy and zen with 📙 and 🍵 for profits.
** Please Boost 🚀/LIKE 👍, FOLLOW ✅, SHARE 🙌 and COMMENT ✍ if you enjoy this idea! Share your trading journey to encourage the trading buddies.

BBUSDT – Blue Box Support, Red Box Resistance! “Key levels in play—will buyers defend, or will resistance hold strong?”
🔥 Key Insights:
✅ Blue Box = Support Zone – If buyers step in, it’s a great reaction area.
✅ Red Box = Resistance Zone – A breakout or rejection will decide the next move.
✅ LTF Breakouts & CDV Confirmations Are a Must – No confirmation, no trade.
💡 The Smart Plan:
Watch Blue Box for Buy Reactions – But only with CDV & LTF structure shifts.
Red Box is a Key Resistance – A clean breakout = bullish. A rejection = short opportunity.
Patience Wins – We wait for confirmation, not emotions.
“The market will decide—we just trade with the right signals!” 📈🔥
A tiny part of my runners:
🎯 ZENUSDT.P: Patience & Profitability | %230 Reaction from the Sniper Entry
🐶 DOGEUSDT.P: Next Move
🎨 RENDERUSDT.P: Opportunity of the Month
💎 ETHUSDT.P: Where to Retrace
🟢 BNBUSDT.P: Potential Surge
📊 BTC Dominance: Reaction Zone
🌊 WAVESUSDT.P: Demand Zone Potential
🟣 UNIUSDT.P: Long-Term Trade
🔵 XRPUSDT.P: Entry Zones
🔗 LINKUSDT.P: Follow The River
📈 BTCUSDT.P: Two Key Demand Zones
🟩 POLUSDT: Bullish Momentum
🌟 PENDLEUSDT.P: Where Opportunity Meets Precision
🔥 BTCUSDT.P: Liquidation of Highly Leveraged Longs
🌊 SOLUSDT.P: SOL's Dip - Your Opportunity
🐸 1000PEPEUSDT.P: Prime Bounce Zone Unlocked
🚀 ETHUSDT.P: Set to Explode - Don't Miss This Game Changer
🤖 IQUSDT: Smart Plan
⚡️ PONDUSDT: A Trade Not Taken Is Better Than a Losing One
💼 STMXUSDT: 2 Buying Areas
🐢 TURBOUSDT: Buy Zones and Buyer Presence
🌍 ICPUSDT.P: Massive Upside Potential | Check the Trade Update For Seeing Results
🟠 IDEXUSDT: Spot Buy Area | %26 Profit if You Trade with MSB
📌 USUALUSDT: Buyers Are Active + %70 Profit in Total
🌟 FORTHUSDT: Sniper Entry +%26 Reaction
🐳 QKCUSDT: Sniper Entry +%57 Reaction
📊 BTC.D: Retest of Key Area Highly Likely
I stopped adding to the list because it's kinda tiring to add 5-10 charts in every move but you can check my profile and see that it goes on..

HSI charging forward, but watch that resistance!Helloy everyone,
Yesterday the Index performed quite well; bullish.
Trying to go back to the uptrend channel.
PEPPERSTONE:HK50
at point of writing ✍️:
MACD - Deadcross formed. Sell/Short at resistance level 24730-24650
BB - 23953(lower BB) mid-line:24350 (this is your 🗝️ level for your long/short TP/SL level)
Quote from 17/3/2025 post
For this week trade plan: Buy into support Sell at resistance. Set your TP/SL.
🚨 as of ✍️ :
🗝️ Level : 22979-23242(23374)- 23997- 24385 - 24586 - 24648 - 24945
To retest 24385 again.
Set your TP/SL, let the market do its thing, and ride the trend with confidence! Manage your risk/reward (r/r).
HSI continues its Bullish mode.
HSI:HSI
W Chart:-
📰 another +ve news, but this might be distraction. 🚨
www.tradingview.com
🎯 Reminder: Continue to accumulate China & HKG for the potential upside for the year! All retracement is a good entry point.
🔎 DYODD and don't listen to anyone. Invest in yourself, do some study and learn along the way while you trying to verify or finding the answer if to start invest in CHN/HKG markets. If you don't know how or where, you may ask Deepseek/Chatgpt for most reputable Trading courses nearest to you.
** Please Boost 🚀/LIKE 👍, FOLLOW ✅, SHARE 🙌 and COMMENT ✍ if you enjoy this idea! Share your trading journey to encourage the trading buddies.
While wait for the markets cook, you may zen with 📙 and 🍵because stress won’t make the candles move! 🚶
Happy Trading!

Was the break over? HSI bulls are back on the field and ready?Hello everyone, happy Monday!
Last week movement, HSI retraced consecutive 4 trading days and slight recover on Friday yet closed with loss 271pts; -1.12% for the week of 10 Mar 2025. However, YTD it has logged an increased of +4216.69pts; +21.02%. HSI:HSI
MACD - Goldencross was marked in Green (5Mar25; 14Mar25)
BB - Currently trading within upper BB channel.the Mid-line 4H chart at 23789 at point of writing ✍️.
For this week trade plan:
Buy into support Sell at resistance. Set your TP/SL.
🚨 as of ✍️ :
🗝️ Level : 22979-23242(23374)- 23997- 24385 - 24586 - 24648 - 24945
To retest 24385 again.
The Index continues its Bullish mode.
With some catalyst news to support Long call.
www.tradingview.com
🎯 Reminder: Continue to accumulate China & HKG for the potential upside for the year! All retracement is a good entry point.
🔎 DYODD and don't listen to anyone. Invest in yourself, do some study and learn along the way while you trying to verify or finding the answer if to start invest in CHN/HKG markets. If you don't know how or where, you may ask Deepseek/Chatgpt for most reputable Trading courses nearest to you.
** Please Boost 🚀/LIKE 👍, FOLLOW ✅, SHARE 🙌 and COMMENT ✍ if you enjoy this idea! Share your trading journey to encourage the trading buddies
oh wow, seems the Index has the wheel to run!Hello everyone! Happy Friday!
News📰 : anticipate more positive news to come (of course mixed with some -ve for retracement) 🔮
Look at the HSI D Chart
- posted 28Feb2025
- posted 3Mar2025
- 7March2025 at point of writing; the index trading above the support level of 23500 (the 28Feb2025 Hi); it tried to go back to uptrend channel and staying above! (broke on 28Feb2025).
Monitor the Trading volume: finance.yahoo.com
Avg past 3 months : 77.909Bn (+19.18% for the past avg vol); this imply the fund flow is abundance, hopefully this continues! Although the vol is slightly less than the last Oct 2024.
Look at the 4H chart
PEPPERSTONE:HK50
The HSI last Dec 2021 Hi @ 24385 is being tested again today!
Now, what's next? 25147, btw now and then Next level that we are looking at to break (oh wow! we need to add in past Higher Hi):
22840-22900
23241-23275-23314- 23471 (need to break above this level to change back to uptrend movement, else probably is gonna be sideways, continue to monitor and confirm)
23952-24101
24385
24586
24747
24800
25147
🚨 as of ✍️ :
Resistance : 24385 - 24586 - 24800. Let's monitor; this level is now being tested and see if breaks and staying above.
🗝️ support level
22750 -23535 (this level being tested few times; it's now became strong support level). Don't think this can easily broke down.
MACD - Goldencross was marked in Green (5Mar25)
KDJ - Remained at Bullish green zone since 4Mar25, the CFD is now in a short bullrun cycle.
BB - Still within lower BB channel and gap up trading at upper BB channel/
the Mid-line 4H chart at 22960-975 was corrected from 23320.
Trade Plan : 23477-24385 - 24751
Buy into support & Sell at resistance
the 1H showing it's now bullrun on the 2nd half of today. Ride on the waves and locked in your profits.
🚨🚨🚨 Locked your profits and watch out for reversal for retracement!
Monitor the 1H,4H movement with confirmation using MACD & KDJ indicator.
Set your tf, have your entry and exit plan!
Pay attention to the Goldencross/DeadCross; practice makes perfect.
Let's follow our own strategy and zen with 📙 and 🍵 for profits.
Happy Trading everyone!
🎯 Start to accumulate China & HKG for the potential upside for the year! All retracement is a good entry point.
🔎 DYODD and don't listen to anyone. Invest in yourself, do some study and learn along the way while you trying to verify or finding the answer if to start invest in CHN/HKG markets.
HKEX:2800 - 22.90-22.82 if it happens to retrace back to this level, otherwise anytime NOW is entry point! It's confirmed by the 200MA (above in W chart) ; also the W chart MACD GoldenCross. Cross-check it; if need helps let us know.
HKEX:2823 - 13.17-14.75 can start to open position and start accumulate, is allowed to wait for confirmation once it breaks 14.75 level. But you will be getting at higher cost...
HKEX:2801 - open position at price : 23.73-23.80 or anytime NOW! if ever retraced back to 23.36-23.66 accumulate more.
HKEX:3067 - open position now, add position when it retraced to 11.63,,11.33 or below. If you have missed, you may tk position still good to start at 11.85,11.99,12.15
** Please Boost 🚀/LIKE 👍, FOLLOW ✅, SHARE 🙌 and COMMENT ✍ if you enjoy this idea! Share your trading journey to encourage the trading buddies

is the Trumph speech boost the Index? n is Wednesday the humpdayHello everyone! How was yesterday trade? Hope everyone stick to the strategy set the SL/TP for your day trade.
News📰 : as expected and anticipate more positive news this week 🔮
www.tradingview.com
**China shares waver, HK bounces as Beijing vows more support for consumption, AI**
HSI +1.30% at this news published.😂
Look at the HSI D Chart
- posted 28Feb2025
at point of writing; the index closed below key support level of 22900-23000 (the strong level of 23000 which is the 10MA level, the uptrend is broken 28Feb25); as mentioned this level has been retest 3 times, let's continue to monitor.
However, today the Index open Hi. So trade ⚠ cautiously. Don't chase Hi.
Trading volume: finance.yahoo.com
Date Volume
Mar 3,2025 4,338,200,000
Feb 28, 2025 6,578,300,000
Feb 27, 2025 6,257,000,000
Feb 26, 2025 5,138,100,000
Feb 25, 2025 4,449,800,000
Monthly
Mar 1 2025 - 4,338,200,000 (as of todate)
Feb 1 2025 - 93,960,700,000 (+7.53% from prev month)_correction
Jan 1 2025 - 52,385,800,000
Dec 1 2024 - 56,349,200,000
Avg past 3 months : 77.909Bn (+19.18% for the past avg vol); this imply the fund flow is abundance, hopefully this continues! Although the vol is slightly less than the last Oct 2024.
Look at the 4H chart
PEPPERSTONE:HK50
The HSI last Oct Hi @ 23241 has been broken, this level could be the resistance level for the Index to break the next level Hi. The HK50 last Oct Hi @ 23258.
Now, what's next?
As updated:-
Next level that we are looking at to break:
20985
21336-21350
22020-22535, 22840-22900
23241-23275-23314- 23471 (need to break above this level to change back to uptrend movement, else probably is gonna be sideways)
23952-24101
24385
🚨 as of ✍️ :
it stays above 22535(retest 3 times and this might formed very strong support level).
🗝️ support level :
22990 broken :22340-22750 (this level being tested 3 times 17,20Feb & 4Mar; last tested at 22535.3)
MACD - Deadcross was marked in Green, continue to curving down (4h Chart)
KDJ - Reverse to Bullish green zone on 4Mar25; the CFD continue to trading the upwards trend till now.
BB - Still within lower BB channel and gap up trading at upper BB channel/
the Mid-line 4H chart at 22960-975 was corrected from 23320.
Trade Plan: might pullback to 23020 to fill the gap. Range : 23025-23258
Buy into support : 22880-22960(confirm with indicators)
Sell at resistance : 23150, 23190, 23372/400, 23454,23512(it soared to hit ,this morning)
Monitor the 1H,4H movement with confirmation using MACD & KDJ indicator.
Set your tf, have your entry and exit plan!
Pay attention to the Goldencross/DeadCross; practice makes perfect.
Let's follow our own strategy and zen with 📙 and 🍵 for profits.
Happy Trading everyone!
🎯 Start to accumulate China & HKG for the potential upside for the year! All retracement is a good entry point.
🔎 DYODD and don't listen to anyone. Invest in yourself, do some study and learn along the way while you trying to verify or finding the answer if to start invest in CHN/HKG markets.
HKEX:2800 - 22.90-22.82 if it happens to retrace back to this level, otherwise anytime NOW is entry point! It's confirmed by the 200MA (above in W chart) ; also the W chart MACD GoldenCross. Cross-check it; if need helps let us know.
HKEX:2823 - 13.17-14.75 can start to open position and start accumulate, is allowed to wait for confirmation once it breaks 14.75 level. But you will be getting at higher cost...
HKEX:2801 - open position at price : 23.73-23.80 or anytime NOW! if ever retraced back to 23.36-23.66 accumulate more.
HKEX:3067 - open position now, add position when it retraced to 11.63,,11.33 or below. If you have missed, you may tk position still good to start at 11.85,11.99,12.15
** Please Boost 🚀/LIKE 👍, FOLLOW ✅, SHARE 🙌 and COMMENT ✍ if you enjoy this idea or need help! *

Looks like HSI got a morning energy boost is not a Weakday!3/3/2025
Hello everyone! Happy Monday today is not a Weakday but a wonderful weekday start of the week 🫰 🫶
News📰 : this was from 28Feb2025
www.tradingview.com
N this is this morning 3Mar2025 - what do you think? I suspect more good news will come this week. 🔎🔮
www.tradingview.com
Look at the HSI D Chart
- posted 25Feb2025
- posted 26Feb2025
- posted 27Feb2025
- posted 28Feb2025
at point of ✍️; the index closed near the key support level of 22900-23000 (the strong level of 23000 which is the 10MA level); as mentioned this level has been retest 3 times, let's continue to monitor.
Trading volume: finance.yahoo.com
Date Volume
Feb 28, 2025 6,578,300,000
Feb 27, 2025 6,257,000,000
Feb 26, 2025 5,138,100,000
Feb 25, 2025 4,449,800,000
Feb 24, 2025 5,264,600,000
Monthly
Mar 1 2025 - 93,960,700,000 (+7.53% from prev month)
Feb 1 2025 - 87,382,400,000
Jan 1 2025 - 52,385,800,000
Dec 1 2024 - 56,349,200,000
Avg past 3 months : 77.909Bn (+19.18% for the past avg vol); this imply the fund flow is abundance, hopefully this continues! Although the vol is slightl less than the last Oct 2024.
Look at the 4H chart
PEPPERSTONE:HK50
The last Oct Hi @ 23241 has been broken, this level could be the resistance level for the Index to stay above for the next level.
Now, what's next?
As updated:-
Next level that we are looking at to break:23330, 23525, 23990, 24101, 24385.
🚨 as of ✍️ :it seems it stay above the key support level of 22990.
🗝️ support level : 23500 (broken) , 23175 (broken), 22990 (testing), 22741
MACD - last marked WAS deadcross and curving down as marked in YELLOW. After 8 bars-it reversed as marked in GREEN. and NOW it formed Deadcross again (as marked in YELLOW)
KDJ - Remained in bearish red zone with chance that it could reverse upwards.
BB - Still within lower BB channel and testing to break the BB mid-line for 4H chart at 23330.
Today Trade Plan: 22785-23504
Buy into support : 22900 ,23,005, 23169,23283 (confirm with the indicator if it's on the bullish zone)
Sell at resistance : 23400, 23353, 23335 (short/TP with shorter timeframe bearish zone, cross-check and wait for confirmation.)
Monitor the 1H,4H movement with confirmation using MACD & KDJ indicator.
Set your tf, have your entry and exit plan!
Pay attention to the Goldencross/DeadCross; practice makes perfect.
Let's follow our own strategy and zen with 📙 and 🍵.
Happy Trading everyone!
🎯 Start to accumulate China & HKG for the potential upside for the year! All retracement is a good entry point.
🔎 DYODD and don't listen to anyone. Invest in yourself, do some study and learn along the way while you trying to verify or finding the answer if to start invest in CHN/HKG markets.
HKEX:2800 - 22.90-22.82 if it happens to retrace back to this level, otherwise anytime NOW is entry point! It's confirmed by the 200MA (above in W chart) ; also the W chart MACD GoldenCross. Cross-check it; if need helps let us know.
HKEX:2823 - 13.17-14.75 can start to open position and start accumulate, is allowed to wait for confirmation once it breaks 14.75 level. But you will be getting at higher cost...
HKEX:2801 - open position at price : 23.73-23.80 or anytime NOW! if ever retraced back to 23.36-23.66 accumulate more.
HKEX:3067 - open position now, add position when it retraced to 11.63,,11.33 or below. If you have missed, you may tk position still good to start at 11.85,11.99,12.15
** Please Boost 🚀/LIKE 👍, FOLLOW ✅, SHARE 🙌 and COMMENT ✍ if you enjoy this idea or need help! *

HSI clocked out early, TP sit back and relax wait for next move!
Hello everyone! Today one of the web hot topic - all the 7 stars align and there must be something happen!
What do you think?
"Bulls took profits, bears took chances—HSI took a nap before the next round!" 😴📈📉
Here you go...now come with this news 📰
www.tradingview.com
**Shares in Hong Kong plunged 309 points or 1.3% to 23,415 on the last trading day of February, marking a second session of losses.
The Hang Seng fell further from its highest in over three years, set earlier in the week, and was on track for its first weekly drop in seven weeks, with all sectors posting sharp losses.
Still, markets were on course for solid monthly gains, up around 15% so far, marking a third month of rises as hopes mounted that China’s 2025 Two Sessions meeting next week will outline key policy priorities, including potential support measures for the economy.**
Look at the HSI D Chart
- posted 25Feb2025
- posted 26Feb2025
- posted 27Feb2025
- posted 28Feb2025 at point of writing; the index broke the key support level of 22900-23000 (the strong level of 23000 which is the 10MA level; let's monitor closely next week the new start for the month and see this level can be maintained. (this level has been retest 3 times)
Trading volume: finance.yahoo.com
Date Volume
Feb 27, 2025 6,257,000,000
Feb 26, 2025 5,138,100,000
Feb 25, 2025 4,449,800,000
Feb 24, 2025 5,264,600,000
Monthly
Feb 1 2025 - 87,382,400,000
Jan 1 2025 - 52,385,800,000
Dec 1 2024 - 56,349,200,000
Avg past 3 months : 65.3Bn ; current as of todate / month volume > past 3 mnths avg (i.e 57.98bn)
Look at the 4H chart (main chart)
PEPPERSTONE:HK50
The last Oct Hi @ 23241 has been broken hence retracement is not a surprised!
With the month closing today, the strong pullback is inevitable for institute and whale to take profit.
Please trade cautiously today! 🚨 🚨 🚨
Now, what's next?
As updated:-
Next level that we are looking at to break and steadily staying above this level - 23525, 23990, 24101, 24385
🚨 as of ✍️ it seems break the first support level this morning- and let's see if it could rebound today else it will go down ⬇ 👇 to 23175-22990 level, then 22741.
🗝️ support level : 23500 (broken) , 23175 (broken), 22990 (testing), 22741
MACD - last marked WAS deadcross and curving down as marked in YELLOW. After 8 bars-it reversed as marked in GREEN. and NOW it formed Deadcross again (as marked in YELLOW)
KDJ - Now reversed turned into bearish red zone. It remained in bearish zone.
BB - It is now entered lower BB channel and testing to break the lower BB and create new Lo.
Today Trade Plan: 23000-23504
Buy into support : 22795- 22900 (confirm with the indicator if its on reversal mode otherwise stayaway)
Sell at resistance : 24040,23454,23250 (short and TP within shorter timeframe, cross-check and wait for confirmation)
Monitor the 1H,4H movement with confirmation using MACD & KDJ indicator.
Set your tf, have your entry and exit plan!
Pay attention to the Goldencross/DeadCross; practice makes perfect.
Let's follow our own strategy and zen with 📙 and 🍵.
Happy Trading everyone!
🎯 Start to accumulate China & HKG for the potential upside for the year! All retracement is a good entry point.
🔎 DYODD and don't listen to anyone. Invest in yourself, do some study and learn along the way while you trying to verify or finding the answer if to start invest in CHN/HKG markets.
HKEX:2800 - 22.90-22.82 if it happens to retrace back to this level, otherwise anytime NOW is entry point! It's confirmed by the 200MA (above in W chart) ; also the W chart MACD GoldenCross. Cross-check it; if need helps let us know.
HKEX:2823 - 13.17-14.75 can start to open position and start accumulate, is allowed to wait for confirmation once it breaks 14.75 level. But you will be getting at higher cost...
HKEX:2801 - open position at price : 23.73-23.80 or anytime NOW! if ever retraced back to 23.36-23.66 accumulate more.
HKEX:3067
** Please Boost 🚀/LIKE 👍, FOLLOW ✅, SHARE 🙌 and COMMENT ✍ if you enjoy this idea or need help! *

Not every run is a marathon— it needs pit stop! Hello everyone!
Here you go...now come with this news 📰
Market Chatter: China Plans 400-Billion-Yuan Capital Injection for Banks -- 💰💰💰?
www.tradingview.com
Look at the HSI D Chart
- posted 25Feb2025
- posted 26Feb2025
- posted 27Feb2025 at point of writing; the index seems doing quite well since open this morning,
trying to stay above the support level 💣💣💣23500 (and strong level of 23000 which is the 10MA level, if break below this level the Index bullrun end, but it's unlikely as it has been retest 3 times)
Trading volume: finance.yahoo.com
Date Volume
Feb 27, 2025
Feb 26, 2025 5,138,100,000
Feb 25, 2025 4,449,800,000
Feb 24, 2025 5,264,600,000
Monthly
Feb 1 2025 - 81,125,400,000
Jan 1 2025 - 52,385,800,000
Dec 1 2024 - 56,349,200,000
Avg past 3 months : 63.28Bn ; current month Feb volume > 3 mnths avg
Look at the 4H chart
PEPPERSTONE:HK50
The last Oct Hi @ 23241 has been broken hence retracement is not a surprised!
Now, what's next? This is tough question 🙋 - Next level that we are looking at to break and steadily staying above this level - 23525, 23990, 24101, 24385
🚨if it breaks below 23454-23500 (& not rebound) it could go down ⬇ 👇 to 23250-23175
🗝️ support level : 23500, 23175, 22741 t
MACD - last marked WAS deadcross and curving down as marked in YELLOW. After 8 bars-it reversed as marked in GREEN.
KDJ - Now reversed turned into bearish red zone.
BB - continue moving above the mid line of BB, this morning touches the mid-line; so be cautious 🚨🚨🚨
Today Trade Plan: 23454-24050
Buy into support : 23454 -23550 (TP :23600-23775)
Sell at resistance : 23800-24050 (TP : 23525-23454)
Monitor the 1H,4H movement with confirmation using MACD & KDJ indicator.
Set your tf, have your entry and exit plan!
Pay attention to the Goldencross/DeadCross; practice makes perfect.
Let's follow our own strategy and zen with 📙 and 🍵.
Happy Trading everyone!
🎯: start to accumulate China & HKG for the potential upside for the year! All retracement is a good entry point.
🔎 DYODD and don't listen to anyone. Invest in yourself, do some study and learn along the way while you trying to verify or finding the answer if to start invest in CHN/HKG markets.
HKEX:2800 - 22.90-22.82 if it happens to retrace back to this level, otherwise anytime NOW is entry point! It's confirmed by the 200MA (above in W chart) ; also the W chart MACD GoldenCross. Cross-check it; if need helps let us know.
HKEX:2823 - 13.17-14.75 can start to open position and start accumulate, is allowed to wait for confirmation once it breaks 14.75 level. But you will be getting at higher cost...
HKEX:2801 - open position at price : 23.73-23.80 or anytime NOW! if ever retraced back to 23.36-23.66 accumulate more.
HKEX:3067
** Please Boost 🚀/LIKE 👍, FOLLOW ✅, SHARE 🙌 and COMMENT ✍ if you enjoy this idea or need help! *

Rebound lik a champ, monitor the vol c if the guests left early?Hello everyone! How was your zentradingstrategy? Hope everyone embrace with the retracement.
Sell on news? or Buy the dip?
What did we noticed on yesterday news? pfft..Distraction, distraction...
but here you go for today 😂😂😂: www.tradingview.com
**Shares in Hong Kong surged 520 points or 2.3% to 23,555 on Wednesday, shifting from a weak session the day before amid robust gains across all sectors.**
Look at the HSI D Chart
- posted 25Feb2025
- 26Feb2025 at point of writing; the index seems doing quite well since open this morning, trying to stay above the support level 22990.
Yesterday trading volume: finance.yahoo.com
Date Volume
Feb 26, 2025
Feb 25, 2025 4,449,800,000
Feb 24, 2025 5,264,600,000
Look at the 4H chart
PEPPERSTONE:HK50
The last Oct Hi @ 23241 has been broken hence retracement is not a surprised!
MACD - last marked WAS deadcross and curving down as marked in YELLOW. After 8 bars-it reversed as marked in GREEN.
KDJ - WAS at bearish zone curving down; and now reversed and turned bullish in green zone.
BB - now moving above the mid line of BB from yesterday ranging within the mid-line.
22990 resistance level now reversed as SUPPORT level. Hopefully the retracement is completed. Let's monitor especially the volume see if this is just a rehearsal.
Today Trade Plan: 23150-23670 (ahemmm...trust you can do the math 😂)
Buy into support : 23150 -23175 (TP :23600-23630)
Sell at resistance : 23465-23670 (TP : 23450-23500)
Monitor the 1H,4H movement with confirmation using MACD & KDJ indicator.
Set your tf, have your entry and exit plan!
Pay attention to the Goldencross/DeadCross; practice makes perfect.
Let's follow our own strategy and zen with 📙 and 🍵.
Happy Trading everyone!
Reminder : start to accumulate China & HKG for the potential upside for the year! All retracement is a good entry point.
HKEX:2800 - 22.90-22.82 if it happens to retrace back to this level, otherwise anytime NOW is entry point! It's confirmed by the 200MA (above in W chart) ; also the W chart MACD GoldenCross. Cross-check it; if need helps let us know.
HKEX:2823 - 13.17-14.75 can start to open position and start accumulate, is allowed to wait for confirmation once it breaks 14.75 level. But you will be getting at higher cost...
HKEX:2801 HKEX:3067
** Please Boost 🚀/LIKE 👍, FOLLOW ✅, SHARE 🙌 and COMMENT ✍ if you enjoy this idea or need help! 😍 **

A little dip? Just the market testing if the game still on!Hello everyone!
Sell on news?
www.tradingview.com
**Hong Kong stocks fell 315 points or 1.4% to 23,030 in Tuesday morning trade, marking the second session of sharp losses amid broad sector falls, notably consumers and tech.Traders retreated from riskier assets after the US intensified curbs on Chinese investments and proceeded with tariffs on Canada and Mexico.**
Is this piece of sh *** news helps in trading? 🤐 🤐 🤐
#sticktoyourplan
#trustwhatyoutrust
#followyourowntradingplan
Build your own #zentradingstrategy news can be distraction to your judgements!
Look at the HSI D Chart
Look at the 4H chart
PEPPERSTONE:HK50
The last Oct Hi @ 23241 has been broken hence retracement is not a surprised!
MACD - formed deadcross and curving down as marked in yellow circle.
KDJ - at bearish zone curving down.
BB - it broke down uptrende channel trading in lower BB channel
22990 support level turned resistance level now. If it able to break and stay above this level this week then this is a healthy pull back. Let's monitor.
Today Trade Plan: 22500-23250 (~830pts)
Buy into support : 22600 -22900 (TP :22950-23130)
Sell at resistance : 23000-23100 (TP: 22900-22930)
PEPPERSTONE:HK50
1h Chart
Check MACD & KDJ - wait for the reversal confirmation before taking your swing long position.
Monitor the 1H,4H movement with confirmation using MACD & KDJ indicator.
Set your tf, have your entry and exit plan!
Pay attention to the Goldencross/DeadCross; practice makes perfect.
Let's follow our own strategy and zen with 📙 and 🍵.
Happy Trading everyone!
Reminder : start to accumulate China & HKG for the potential upside for the year! All retracement is a good entry point.
HKEX:2800 - 22.90-22.82 add position
HKEX:2823 HKEX:2801 HKEX:3067
** Please Boost 🚀/LIKE 👍, FOLLOW ✅, SHARE 🙌 and COMMENT ✍ if you enjoy this idea!**

HSI took off like a rocket...confirmed bullish24/02/2025
HSI took off like a rocket… then remembered it forgot its wallet and came back for a quick retrace!" 🚀📉
Next target : 24385
HSI 1W Chart
Look at that! ignore the news, the movement and volume
finance.yahoo.com
Goldencross for the week of 3Feb2025 - with trading volume jumped from 3.69bn to 15.12bn.
And the subsequent week volume keeping at >20bn level (for the week of 10Feb & 17Feb)
Let's monitor if this week keeping the same level of volume for the 3rd week.
finance.yahoo.com
we noticed the trading volume increased from 4.42Bn to 6.1673bn last Friday 21Feb25
www.tradingview.com
** The Hang Seng Composite Index on information technology firms and the Hang Seng Tech Index slip 0.5% and 0.1% respectively, while Hang Seng Index adds 0.4%
** Stock up 76.9% YTD
HSI:HSI
The last Oct Hi @ 23241 has been broken today!
MACD, KDJ and BB remained at bullish zone.
Key support level: 22990,22668,22446
Key resistance level : 23675,24167,24385
Look at the 1h chart - posted
PEPPERSTONE:HK50
Today Trade Plan:
Buy into support : 23300-23500
Sell at resistance : 23650-23700 (TP:23630)
Monitor the 1H,4H movement with confirmation using MACD & KDJ indicator.
Set your tf, have your entry and exit plan!
Pay attention to the Goldencross/DeadCross; practice makes perfect.
Let's follow our own strategy and zen with 📙 and 🍵.
Happy Trading everyone!
Reminder : start to accumulate China & HKG for the potential upside for the year! Today retracement is a good entry point.
HKEX:2800 HKEX:2823 HKEX:2801 HKEX:3067
** Please Boost 🚀/LIKE 👍, FOLLOW ✅, SHARE 🙌 and COMMENT ✍ if you enjoy this idea!**

will the movement has memory to follow its old path?20Feb25 ** Hong Kong's benchmark Hang Seng Index (HSI) declined 1.6%, dragged by a sharp correction in technology stocks.
HSI:HSI
20Feb25 - (4H)
21Feb25 (4H)
⏰ ⏰ ⏰
Trade with cautious.
Since the goldencross formed week of 3Feb25 - the index had soared 908pts, +4.49%
The following week; week of 10Feb2025 - another +1486pts +7.04%
For the past two weeks the index had a small bull run of 2543pts; 12.7%
If history repeat, then HSI need a break after consecutive two weeks of climbing. If you see what I see.
The next strong resistance will be the last Oct2024 Hi at 23241. Let's see if today the volume and market sentiment able to break this then is likely to retrace back.
KDJ - The D chart - at overbought and red zone and now turning to red bearish zone.
Look at the 4H chart
PEPPERSTONE:HK50
Overnight the HK50 had touched and broke 23241 and retrace back.
Let's monitor if today there is chance for HSI to break the last Oct Hi.
MACD - above zero level - Bullish zone reversal from deadcross formed earlier and now with light red inverted histogram.
KDJ - Turned Bullish
BB - returning to upper BB channel
Today Trade Plan:
Buy into support : 22850 - 23000 (TP/SL at 22580)
Sell at resistance : 23250 - 23300 (TP/SL at 23200)
Look at the 1H chart.
Be cautious and pay attention. KDJ still ranging bearish zone although the MACD is within Bullish level but with light histo i.e low volume.
Monitor the 1H,4H movement with confirmation using MACD & KDJ indicator.
Set your tf, have your entry and exit plan!
Pay attention to the Goldencross/DeadCross; practice makes perfect.
Let's follow our own strategy and zen with 📙 and 🍵.
Happy Trading everyone!
Reminder : start to accumulate China & HKG for the potential upside for the year! Today retracement is a good entry point.
HKEX:2800 HKEX:2823 HKEX:2801 HKEX:3067
** Please Boost 🚀/LIKE 👍, FOLLOW ✅, SHARE 🙌 and COMMENT ✍ if you enjoy this idea!**

keep climbing after a short rest!TGIF everyone & Happy V day! HSI continue sending love 📦 & 💷 to who pay attention to it!
HSI:HSI
D chart on HSI
The next strong resistance will be the last Oct2024 Hi at 23241.
How far to reach the ATH from today? Estimated : 1061pts to go (~4.79%); is not that far!
Expecting and allow some retreat a healthy pullback these two weeks.
Look at the 4H chart
PEPPERSTONE:HK50
MACD - now at bullish zone with inverted red histogram.
KDJ - Bearish zone and likely to reverse.
BB - Index continue trading above BB midline and stay at upper BB channel.
Today Trade Plan:
Buy into support : 21090-22000
Sell at resistance : 22230-22300
(trade range : 301pts; ~1.37%)
Look at the 1H chart.
MACD formed GoldenCross this morning.
KDJ also is at bullish green zone and at bullish level (after yesterday pullback and reverse from oversold zone)
BB : above upper BB 21930 - 22300
Lower BB : 21910 ( today support level should be at 21600)
Resistance : 22200 (if breaks then to retest the next resistance at 22545 then 22770)
Monitor the 1H,4H movement with confirmation using MACD & KDJ indicator.
Set your tf, have your entry and exit plan!
Pay attention to the Goldencross/DeadCross; practice makes perfect.
Let's follow our own strategy and zen with 📙 and 🍵.
Happy Trading everyone!
Wishing everyone a good weekend ahead.
** Please Boost 🚀/LIKE 👍, FOLLOW ✅, SHARE 🙌 and COMMENT ✍ if you enjoy this idea!**

HSI continue to roars, bull take charge ahead! PEPPERSTONE:HK50
HSI:HSI
Hello everyone good am! hope you made enough winning trades for the upcoming weekend.
D chart on HSI
MACD & KDJ both are at bullish zone.
The next strong resistance will be the last Oct2024 Hi at 23241.
with the positive news, this is likely to touch soon.
www.tradingview.com
Look at the 4H chart
MACD - still on the bullish zone and supported with bullish green histogram.
KDJ - Bullish zone , overbought zone. Cautious for a short pullback.
BB - Moving above BB midline and ranging at upper BB channel and continue to arching up.
Look at the 1H chart.
MACD continue staying at bullish level (above zero line)
KDJ - cautious for pullback (ranging between red and green zone but at overbought level)
BB : above upper BB 21900-22200
Lower BB : 21530 ( today support level should be at 21800)
Resistance : 22200 (if breaks then to retest the next resistance at 22500 and 22770)
Today Trade Plan:
Buy into support : 21800-21950
Sell at resistance : 22200
Monitor the 1H,4H movement with confirmation using MACD & KDJ indicator.
Set your tf, have your entry and exit plan!
Pay attention to the Goldencross/DeadCross; practice makes perfect.
Let's follow our own strategy and zen with 📙 and 🍵.
Happy Trading everyone!
Wishing everyone a good weekend ahead.
** Please Boost 🚀/LIKE 👍, FOLLOW ✅, SHARE 🙌 and COMMENT ✍ if you enjoy this idea!**

continue to rise with news! PEPPERSTONE:HK50
HSI:HSI
Hello everyone how was your trade yesterday?
It was a healthy pullback and hope you managed to short it and make some profit.
D chart on HSI
The bullish continues, yesterday was a healthy pullback with 227pts -1.06%
KDJ is now back to bullish zone.
Correction : MACD already crossed above zero level.
Look at the 4H chart
MACD - still on the bullish zone but with reduced volume with inverted red histogram. Cautious for the pullback.
KDJ - Bullish zone.
BB - Ranging at upper BB channel and continue to arching up.
Today Trade Plan:
Buy into support : 21520-21550
Sell at resistance : 21815 (TP : 21758)
253 range for day trade is suffice to gain some pocket money.
Look at the 1H chart.
MACD is arching to bullish.
KDJ also back into bullish green zone at overbought level (cautious for pullback)
BB : above upper BB 21500-21750
Lower BB : 21259 (support level)
Resistance : 21850 (if breaks then to retest the next resistance at 21975)
Monitor the 1H,4H movement with confirmation using MACD & KDJ indicator.
Set your tf, have your entry and exit plan!
Pay attention to the Goldencross/DeadCross; practice makes perfect.
Let's follow our own strategy and zen with 📙 and 🍵.
Happy Trading everyone!
Wishing everyone a good day with many winning trades !
** Please Boost 🚀/LIKE 👍, FOLLOW ✅, SHARE 🙌 and COMMENT ✍ if you enjoy this idea!**

Reversal bullish is happening! No more boozy dancePEPPERSTONE:HK50
HSI:HSI
Hello everyone how was your trade since last update?
HSI turned bullish as forecasted from chart during my holidays!
Did you managed to gain some pocket money? I did with intermittent networks.
Let's review the Index action from wider tf; for the upcoming bull run.
1W Chart
For the week of 3 Feb 2025 the Index clocked a 1000pts +~5% gain. with this the W Chart had confirmed that the MACD formed GoldenCross with dark green histogram(with high volume)
19780 turned strong support level from resistance.
22760 the next resistance level to achieve and break the last Sept 2024 High.
Cross-checked with broader tf chart - D chart.
D chart on 27Jan2025
D chart today 11Feb2025
MACD break above zero level on 28Jan2025; confirming the Index turning bullish. The bullish continues since then till today!
KDJ is now at bullish zone but overbought.
MACD are still below zero level but seems arching and inching to break zero level to give confirmation of bullish.
Look at the 4H chart
There was a Golden cross formed on 3Feb2025 & 7Feb2025 (of course during these 4 days there was a slight adjustment on 5Feb2025 which probably the 🐳 flush retailers out).
MACD - still on the bullish zone but with reduced volume with light green histogram.
KDJ - Bullish zone with overbought zone above 80 level/
BB - Ranging at upper BB channel and continue to arching up.
Look at the 1H chart.
MACD is curving down (within bullish zone above zero level)
KDJ is in the bearish red zone almost entering oversold level of 20; wait for bullish reversal.
BB : crossed below middle line entering lower BB 21270 - 21470
Lower BB : 21265 (support level)
For day trade: Same strategy, sell at resistance; buy/TP at support.
Monitor the 1H,4H movement with confirmation using MACD & KDJ indicator.
Set your tf, have your entry and exit plan!
Get in the Golden cross and ride on the wave.
Support : 21250 ( next support level 21090)
Resistance : 21700 (if breaks then to retest the next resistance at 21955)
It needs to be stay above 21540 to bbreak the next resistance.
www.tradingview.com
People sell on news. Here needs a healthy pullback, and markets continue its cycle. As a consistent and prudent traders, we should be Greedy when markets are fear.
It is easier to say than doing it.
Let's monitor the movement of the index and act accordingly and do not anticipate until we see confirmation from markets.
Again, sticktoyourplan trade according to time frame and set TP/SL.
Trading to make pocket money isn't that challenging and it can be boring and you can make it fun and zen with it.
Let's follow our own strategy and zen with 📙 and 🍵.
Happy Trading everyone!
Wishing everyone a good prosperous year of 2025 with many winning trades!

Almost there! Breaking through for BullPEPPERSTONE:HK50
HSI:HSI
Look at the 4H chart.
MACD - Golden Cross arching up this morning.
KDJ - Bullish zone but overbought zone.
BB - Ranging at upper BB channel and continue to arching up.
Cross-checked with broader tf chart - D chart.
KDJ is now at bullish zone but overbought.
MACD are still below zero level but seems arching and inching to break zero level to give confirmation of bullish.
Continue to monitor to wait for MACD Signal cross above zero line confirming BULLISH.
Can accumulate and swing trade for 4 wks-6 wks.
Look at the 1H chart.
MACD has confirmed its bullish.
KDJ has been moving through the bullish and bearish cycle.
Range Upper BB : 20120 - 20300
Lower BB : 19985 (support level) - 20119.
For day trade: Same strategy, sell at resistance; buy/TP at support.
Monitor the 1H,4H movement with confirmation using MACD & KDJ indicator.
Set your tf, have your entry and exit plan!
Support : 19980 ( next support level 19930)
Resistance : 20330 (if breaks then 20450)
Trading to make pocket money isn't that challenging and it can be boring and you can make it fun and zen with it.
Let's follow our own strategy and zen with 📙 and 🍵.
Reminder : to slowly To take action to accumulate Hong Kong and China stock/ETF/Index and wait for 12-24months or more to have an exponential capital gain. Check the Month Chart you will notice, is almost there already....
HKEX:2800 - create position at around 20.50 and add position if pullback to 19.30 (Both Fibo level)
HKEX:2823 HKEX:2801
February news is around the corner from local authority. Let's see if that's the case.
One of the positive news:-
www.scmp.com
Again, news are distraction. 😂
Please DYODD and take action to diversify your investment portfolio with China & HKG exposure.
Happy CNY everyone and happy trading!

retreat frm ytd 'short bullrun'; look at key support levelPEPPERSTONE:HK50
HSI:HSI
Look at the 4H chart.
MACD - Deadcross curving down
KDJ - Bearish zone.
BB - entering lower band.
Cross-checked with broader tf chart - D chart.
MA20 :19632
MA52 :19738 (MA52>MA20)
KDJ is now at bullish zone; overbought.
Both KDJ and MACD are still below zero. MACD seems to be forming a curve; it may go down if there is no strength to break above the zero line and turn bullish.
We can probably see a sideways movement until the distraction—news announced in February.
Continue to monitor to wait for MACD Signal cross above zero line confirming BULLISH.
Can accumulate and swing trade for 4 wks-6 wks.
Look at the 1H chart.
The pullback is delayed but inevitable.
At point of observed KDJ it's in red bearish zone.
MACD is at bullish area fast line is touching signal line forming a dead cross within Bullish zone.
For day trade: Same strategy, sell at resistance; buy/TP at support.
Monitor the 1H,4H movement with confirmation using MACD & KDJ indicator.
Set your tf, have your entry and exit plan!
Support : 19782 (next 19742, 19300 ; key support level 19545)
Resistance : 19900 (if breaks then 20030)
Sticktoyourplan follow your trading strategy.
Trading to make pocket money isn't that challenging. Although it can be boring, you can make it fun and zen with it.
Let's follow our own strategy and zen with 📙 and 🍵 to let the results realized.
Reminder : to slowly accumulate Hong Kong and China stock/ETF/Index and wait for 12-24months or more to have an exponential capital gain. Check the Month Chart you will notice, is almost there already....
HKEX:2800 HKEX:2823 HKEX:2801
Time frame is important! Prepared for the rollercoaster short-term rider for these two markets.
Time is our friend!
Trend is our friend too, do not go against it.
Happy Trading Everyone! ☺

BB sell/short setup (12H)It seems a complex pattern is forming, where wave C could complete within the red zone, leading to a BB drop.
We are looking for sell/short positions in the red zone.
The target could be the green zone.
Closing a daily candle above the invalidation level will invalidate this analysis.
For risk management, please don't forget stop loss and capital management
Comment if you have any questions
Thank You

BB Looks bullish (8H)It seems that BB has completed a wave B. This wave B appears to be a FLAT with a terminal C, which has now finished.
As long as the green range is maintained, it could move towards the TPs.
A daily candle closing below the invalidation level will invalidate this analysis.
For risk management, please don't forget stop loss and capital management
When we reach the first target, save some profit and then change the stop to entry
Comment if you have any questions
Thank You
