Rose a possible 100x?Opinion:
Benefits of Oasis Network:
Strong focus on privacy and confidentiality through the use of confidential computing and privacy-enhancing technologies
High scalability with support for high-throughput dApps and enterprise solutions without compromising security or privacy
Flexibility and adaptability, accommodating a wide range of use cases
Drawbacks of Oasis Network:
Complexity may require developers to have a deep understanding of blockchain technology and privacy-enhancing technologies to fully leverage its benefits
Limited adoption as a newer platform, with competition from established and newer blockchain platforms
Concerns about centralization in terms of the platform's governance, as the Oasis Foundation oversees the platform's development and decision-making processes.
How to use this chart:
There is mounting evidence we could be entering a new market cycle. At this point in time, I do not find it enough to flip bullish or believe we are in a bull run. If we are in a bull run, all that changes is that we short higher, start using close only orders, and expect deep pullbacks to the 4-hour time frame.
It is with this in mind that I have added the yellow lines. These are close levels, levels at which closing the order instead of shorting it makes the most sense.
Until we have a clear market direction, I will be including these in my ideas.
L = Long
C = Close
S = Short
Notes on how I personally use my charts/NFA:
Each level L1-L3 and TP1-TP3 has a deployment percentage. The idea is to flag these levels so I can buy 11% at L1 , 28% at L2 and if L3 deploy 61% of assigned dry powder. The same in reverse goes for TP. TP1: 61%, TP2:28% and TP3:11%. If chart pivots between TP's, in-between or in Between Sell levels these percentages are still respected. I like to use the trading range to accumulate by using this tactic.
Just my personal way of using this. This is not intended or made to constitute any financial advice.
This is not intended or made to constitute any financial advice.
FED Macro Situation Consideration:
All TP's are drawn within the context of a return to FED neutral policy. I do not expect these levels to be reached before tightening is over.
NOT INVESTMENT ADVICE
I am not a financial advisor.
The Content in this TradingView Idea is for informational purposes only, you should not construe any such information or other material as legal, tax, investment, financial, or other advice. Nothing contained within this idea constitutes a solicitation, recommendation, endorsement, or offer to buy or sell any securities or other financial instruments in this or in in any other jurisdiction in which such solicitation or offer would be unlawful under the securities laws of such jurisdiction.
All Content on this idea post is information of a general nature and does not address the circumstances of any particular individual or entity. Nothing in the idea/post constitutes professional and/or financial advice, nor does any information on the idea/post constitute a comprehensive or complete statement of the matters discussed or the law relating thereto. You alone assume the sole responsibility of evaluating the merits and risks associated with the use of any information or other Content on the idea/post before making any decisions based on such information.
BBC
Updated prediction after recent correction. BTC still bullish As we see with each drop, some bad news started with Elon Must saying the price of BTC and ETH was too high. On the next day both the BBC and Bill Gates said on separation occasions that they were anti BTC due to environmental issues. Yet more and more banks diving in with now Citi Group suggesting BTC could become the future global currency, with luck we move to the next ATH within the next two weeks.
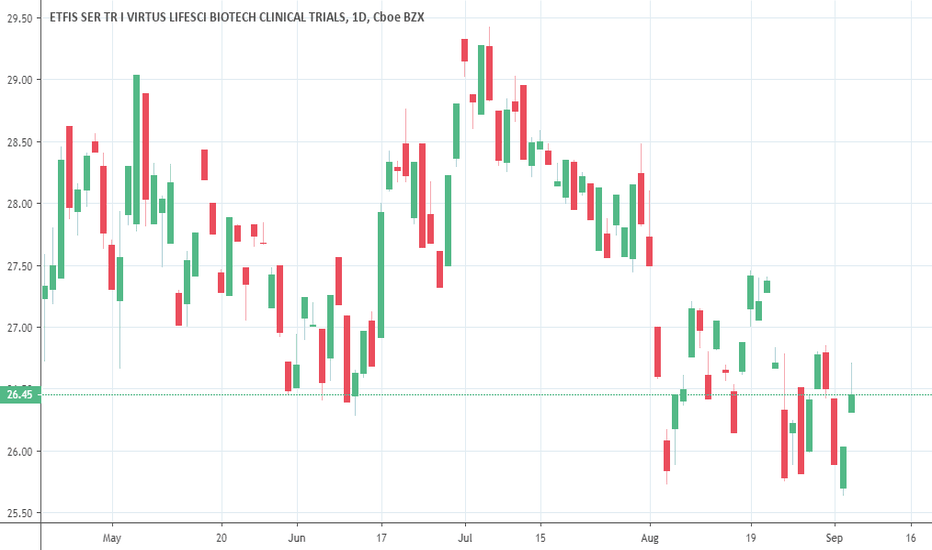
Biotech etf catching up to the Qstested recently pitchfork upper line and bounced off..bullish sign.
depending on timeframe but for this one BBC is catching up to the Qs.
short term it looks just as over-exteneded as the Qs.
trading will get very choppy short term.
Disclaimer, this is only for entertainment and education purposes and doesn't serve by any means as a buy or sell recommendation.
Personally I hold both long term long positions and occasionally short term short position, for disclosure purpose.
USDJPY Long After BounceUSDJPY long bounce play coming up on the 4 hour chart. This setup will likely start off with London and carry through to the US session. I am expecting price to continue to drip down lower (price action is still 63 pips from the bottom of the channel) until we get a good solid bullish rejection just in time for the London session. Price has been trapped between the 112.103 - 110.098 for a week or so likely consolidation for the next big break out. Just the way I see things. Plan your trade and trade your plan.


