Bitcoin CashBitcoin Cash (BCCUSDT):
Buy: 1518.00
Stop-Loss: 1100.00
Take-Profit: 2000.00 / 2400.00
Recommended Trade Volume: up to 10% from your deposit size.
BCC

Possible Breakout on Right Angle WedgeBitcoin Cash has been very stagnant over the last couple days (boring). Here's to hoping that something meaningful comes out of this right angle wedge.

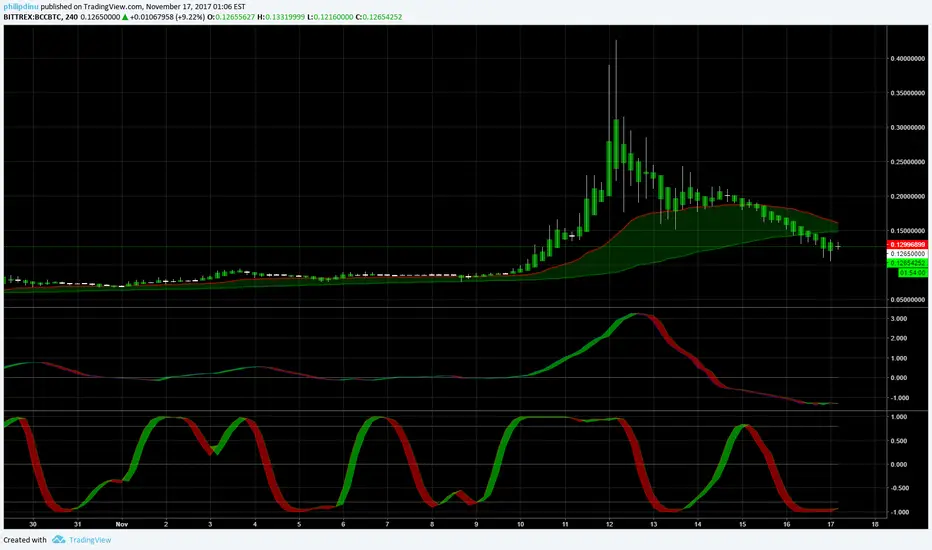
BCC possible upswingBCC consolidating with strong support.
BTC on 12 hour chart is topped out and due for a big correction soon. BCC has been working in inverse so when BTC drops BCC will boost. My guess is a spike to at least the 0.5 FIB. Or it could just drop away to nothing lol, who knows.
RSI is also holding steady and showing signs of support

Bitcoin down and cash down also?What did I just saw? Usually, when bitcoin going down, bcash goes up. But now, when btc goes down, there was huge offers to sell bcash. So, if I am right, that was a plan to sell a lot of bcash before new btc ATH, using price manipulation. usdt were needed especially for this.


Bitcoin Cash Trading OpportunityThe price bounces from 853.00 support level and bounces from the support zone formed by SMA. RSI confirmed price reversal from the support level. The price diverges with RSI. The market is going to move high.

BCH is about to go parabolicWith bitcoin sitting at 120k unconfimed transactions and miners moving to bch is gunna moon

Tell me old man the secrets of....Sam?Someone explain the bcc vs btc thing for me. Opinions on which one everyone here agrees on. As far as trading it I personally bought a few at 500 sold at 1700 and haven't gotten back in. Fuck this coin

BCH Short to 1450!BCH is still ascending trend, and vice versa for BTC, so kep the core BCH!,
comments are welcome.

Symmetrical Triangle Continuation of Recent Bullish ReversalBitcoin Cash is consolidating in a nice little symmetrical triangle. It appears to have started a recent intermediate uptrend around 18:00 on 11/16. This triangle may breakout and continue the uptrend.
RSI seems to be stable at the 50 support line.

THE MOMENT OF TRUTHTHERE'S MUCH GROUND TO COVER. HERE ARE SOME TIPS I WROTE TO KEEP MY SANITY. HOPEFULLY THEY HELP YOU.
1. Stagger ALL Buys and Sells
2. Cut losses if you need to, but don't jump back in when you do
3.Don't EVER buy Higher than you sold
4. USE THE BUY AND SELL INDICATORS
5. Hold your position firm. You are gambling on this one, so assume your money is already gone. Now play like there's nothing to lose.
6. Stop Trading using anything less that 30 minute candles. It'll fuck with your head.
7. Relax, Breathe, Make Money, Have Fun.
BTC:
13FXp5MGwZ7poLPx2KsnaKPNZHquQgsxUq

HERE WE GO GUYSYour Patience Has Paid Off. Let's Have Fun
Let's Make It Rain Satoshis :)
Tips that help me stay sane during stressful trades:
1. Stagger ALL Buys and Sells
2. Cut losses if you need to, but don't jump back in when you do
3.Don't EVER buy Higher than you sold
4. USE THE BUY AND SELL INDICATORS
5. Hold your position firm. You are gambling on this one, so assume your money is already gone. Now play like there's nothing to lose.
6. Stop Trading using anything less that 30 minute candles. It'll fuck with your head.
7. Relax, Breathe, Make Money, Have Fun.
BTC:
13FXp5MGwZ7poLPx2KsnaKPNZHquQgsxUq

BCCBTC - Reversion to the Mean TradeBCC has had an extreme move to the downside with bitcoin making new highs, and it is finally starting to show some exhaustion. The daily chart is showing a bounce into and out of the MA cloud indicating a bullish trend continuation. Momentum appears to be slowing down on the 4H chart with a doji HA candlestick forming and indicating price could potentially change direction. I will be waiting for the next candle to open and indicate a strong momentum to the upside before entering positions. Heavily oversold weighted RSI is also a good indication price could swing to the upside and attempt to touch the MA cloud or possibly the 50% fib area.
After A and B, comes...??We see a nice Ascending Triangle.
If Triangles support line brakes, probably we will see wave C formation with support ~700.
What do you think about it?
P.S. Please be careful, thats just and idea.

Long Bitcoin CashBitcoin Cash's upcoming fork will stabilize its hash rate giving end users consistent transaction confirmation time. Bitcoin Cash will be well positioned competitively with the BTC blockchain by the Nov 17th Segwit 2x fork.
There are a lot of bullish signs in the price history from looking at the graph. The fib levels give clues to future resistance levels on the way up. The price has already retraced the entire move from $294 to $972. Don't forget many BTC holders immediately sold their Bitcoin Cash thinking it was "free money". The price has already bottomed out and stabilized from the dump caused by the initial distribution to all BTC holders.
You will not be able to move your forked BTC on Coinbase during the 2x fork. support.coinbase.com
Many other exchanges have similar policies. The crypto market will not just pause though. There are plenty of other alternate cryptocurrencies to use during this time. Bitcoin Cash is well positioned to be one that many people may pick.

return to meanBCC is dropping back to its trend line. Target of 0.1 is likely with no momentum upwards. Daily charts Stock will need to reset before significant up movement

Shorting BCH (Bitcoin Cash) Involves RiskWhilst shorting Bitcoin Cash seems like a good idea based on the charts and the fact that it's attack on BTC has failed, plus the fact BTC is pumping right now and possibly going on to test previous highs, you need to be careful of an artificial pump by the crew behind BCH.
As tempting as it is and although I have made BTC by shorting it previously I feel the risk vs reward is not worth it currently and there are better opportunities out there.
Trade safe!


BTC vs BCHTrends represent more or less symmetricity of each other. Most of the money transfers to or from each other.


$BCC 1 more leg up?Looking at my expectations for BTCUSD, I'm expecting 1 more (big) move down for BTC.
This would perfectly fit in this cycle.
One more leg up.
Its very tricky to chart these kind of pumps, high chance of being wrong but this chart looks pretty logical to me.
Its more driven on "feeling" as on Technical Analysis by combining several chart patterns from different currencies.
