Bitcoin Cash in Ascending Triangle Breakout Pattern.Hey, I am back with another Technical Analysis, this time looking at Bitcoin Cash.
Lets keep it simple and just right on look at the chart.
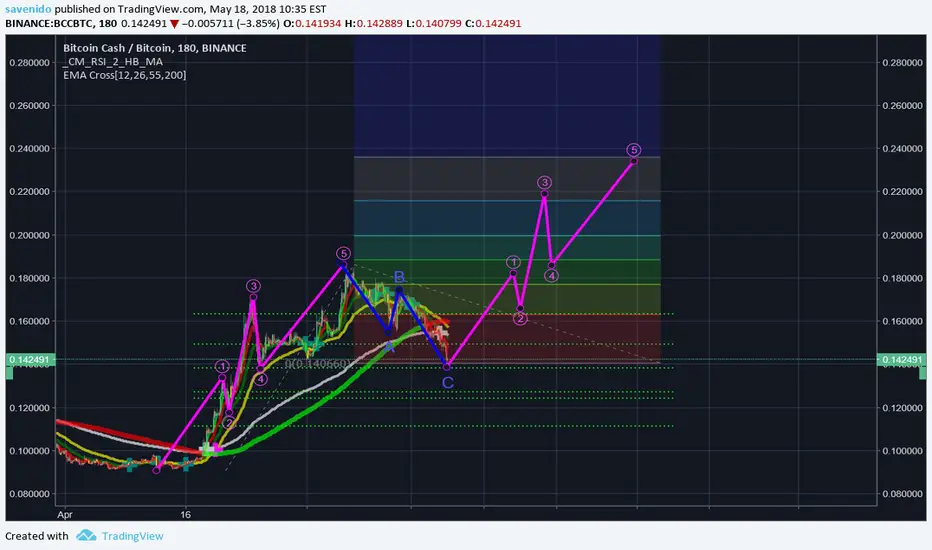
On the chart you can see Ascending Triangle that has formed, if Triangle has to be valid it has to seen at least 2 swings high and 2 swings low , currently there are 2 up and 3 down.
Bassicaly in ascending triangle you have one strong ressistance level and increasing demand on Uptrend line, thats how Ascending Triangle is being formed.
Lets just move by looking at Indicators.
RSI shows clear uptrend ( demand increasing over time).
MACD shows really small period cycles, currently Bitcoin Cash should start curve upwards by bouncing off uptrend line in chart.
So I think thats about it.. If you have any Questions feel free to ask me down bellow or at my Discord channel!
Hope I made your view on whats going on with Bitcoin Cash somewhat clearer.
If you like this Technical Analysis let me know in the comments, Likes are aprreciated, Thanks !
If I see something worth to share on the chart I will surely do an Update.
BCC

Binance USDT pairs trend monitoringAll Binance USDT pairs trends monitored on this one chart using the Bull Filter Index script. Bullish pairs signalled when the indicator crossedover 50. Last pair to be bullish was BNB. Prior to that BCC and ETH last April. Easy to monitor multiple pairs using this indicator, other coins can be added.
Current Binance USDT coin pairs in chart monitored by one indicator:
BTC/USDT
BCC/USDT
BNB/USDT
EOS/USDT
ETH/USDT
XRP/USDT
ADA/USDT
ONT/USDT
IOTA/USDT
TUSD/USDT
XLM/USDT
NEO/USDT
LTC/USDT
QTUM/USDT

Bitcoin Cash - Inverse Head and Shoulders GaloreHey everyone! This is piggybacking off a previous post (linked below). Looking at the 4-hour chart for Bitcoin Cash, I see 2 inverse head and shoulders near completion which could make an exciting trade setup up. The completion of the first inverse head and shoulder pattern should bring us to the neckline of the second set up. And hopefully, it will domino from there. As always, keep an eye on Bitcoin through this trade (and all your trades) as it has a tendency to make trade setups go awry.

BitcoinCash vs Bitcoin Uptrend EstablishedBitcoinCash found the bottom at btc 0.123 while forming a bullish divergence on the RSI oscillator. The following wave up resulted in a break above the downtrend trendline and the 50 Moving Average, suggesting the continuation of the already established uptrend.
The recent wave up resulted in a break above the btc 0.152 resistance level, confirming BCC/BTC bullish intentions. The potential move up might result in a growth towards btc 0.2, that is 38.2% Fibonacci retracement applied through the all-time high.
But this is only the first upside target and key resistance level. If Bitcoin Cash will break above, that should confirm further uptrend and could send price much higher. On the other hand, rejection could result in a corrective move down or an extended consolidation.
The risk of the downtrend will only become valid once/if price breaks below the btc 0.123. In that case BCC could go down towards btc 0.1 psychological support.


BCH LONGBroke downtrend and formed a triangle after a small leg upwards. 1030 was the confirmation for bch to start the new trend. Safe to go long with stoploss below bottom triangle. Targets are displayed on the chart (.32 and .618 fib). risk is 10%, potential gain is 20-40%.
Good luck

Easy 13% Bitcoin Cash Using Fibonacci So you missed a nice uptrend? No worries, you can always profit from the bounces going down. If you don't know how to use Fibonacci I will explain. First you need to establish the lowest point (labeled in green) and the highest point (labeled in red). So first take the Fibonacci tool and line it up with the the lowest point. Next, take the Fibonacci and line it up with the highest point. Then you're done. You'll now be able to use the Fibonacci to find possible entries. You can see the first bounce occurred at the .236 and almost at the .382. Every level on the Fibonacci is a potential place for a bounce. In this example the Fibonacci appears to be off just a tiny bit. Rather than look for a chart that perfectly lines up and we see perfect bounces, I stuck with this one to show you guys that it's not always perfect. Sometimes you won't see a bounce at all. When I was first learning TA, I found it frustrating that the people who taught TA would show the perfect textbook example. I won't sugarcoat it. I'll show you that TA is very very useful but you can end up wrong. No analyst is 100% correct. Realistically you only need to be correct 50% of the time which sounds surprising but it turns out to be true when you use proper risk management. Had I adjusted the Fibonacci slightly everything would have lined up, however we wouldn't have known to adjust it until later on.
Moving back to the Fibonacci the .618 is considering the golden ratio. Google it if you want to learn more. This is the ideal place for a bounce to occur and has resulted in big moves up. You can see that price fell perfectly into the .618 pocket. Sometimes prices touches it and shoot back up, other times it slips slightly below the .618 into the "golden pocket". Had you bought in that in zone you would be up 13%. As a continuation of my previous post on divergence you can see bullish divergence occurring right before the bounce at the .618. So now you have two indications for a bounce. The .618 level and bullish divergence. Having multiple reasons to enter a trade will give you confidence as a trader. If you're not ready to trade your own money, then try back testing and paper trading until you feel confident with your abilities. Finally notice the bearish divergence that occurs on the left side of the chart. I am going to cover that in my next post.

Downtrend line since start of May broken; target 0.16 BTCDowntrend line since start of May broken. Edge to edge triggered and Bband breakout on the 4 hour as volume returns after a month of consolidation. VPVR, Ichimoku and fib confluence pointing to a target of around 0.16.

Bitcoin Cash [BCC] looking to continue to the short sideBCC Still Continues To Seem Bearish.
1) Moving Averages are about to cross Bullish and price action is underneath the MA trend lines.
2) Formed a Head & Shoulders pattern and the pattern confirmed. Expected Target for this is $684.
3) A long term trend line was drawn from the start of Nov 2017 until today. This trend line lies right above the Short Target from the H&S. Price could bounce off of this (approximately $789 ) as support or either bounce from the H&S target. I listed the difference from Target 1 and Target 2 which is about a 12.5% difference in price.
4) We are currently forming a downward channel if zoomed in to our current price region.
What do you think?
Add me on Twitter and let me know! @KennyDegu

#BCC :bullish butterfly arnd 980 level #BCH $bccusdt #cryptoBCC is forming a bullish butterfly around 980 level , with price action making higher lows and RSI also curving up, this may be an indcation of a short term reversal around the D point (PRZ for the buterfly)
If bcc manages to break above 1000 level with confirmation, then it will look to Target the 61.8fib resistance level at 1063
Target 1: 1015-1016
Target 2: 1056-1063
on bearish note if bcc breaks below 915 level then it may fall to the 78.6fib support at 850 .

Time to sell Bitcoin cash? Chart Analysis [16-05-2018]Head and shoulder pattern setting up on BCCUSD. Fib shown as guide for potential take profit areas.
Enjoy.
Disclaimer: This is only my opinion, make of it what you wish. It is not financial advice.

BitcoinCash/BTC Head & Shoulders underway!This Analysis is to confirm the H & S analysis bought forward by jpbrown1023. Shout out to him for bringing this plausible opportunity to my attention. His/Her link down below.
As you can see within the chart's text bubbles, there seems to be a number of factors that are favoring the advancement of the right shoulder.
However, BTC still has strong market influence during its declines. Thus, most important, if BTC/USD(T) does not fall below its trend-line at $7.0k-$6.8k region, then BTC/USD(T) should coincidentally advance off the trend-line around the same time period BCC/BTC is expected to have its volume expansion to break neck-line.
So far, this H&S seems very likely, however not confirmed until neck-line is broken with a convincing amount of volume expansion. Thus, lets continue to monitor for positive indicators and hope for the best.
Any likes & comments are welcomed.
Happy trading & Cheers!

BCC update- Forming a bullish harmonic around 950 levelBCC is currently trading below the 61.8fib(1063) resistance
Currently it is forming a bullish shark pattern around 950 support level with RSI showing bullish divergence
If we get a break above 996-1000 region with confirmation, then Target is 1050 region.
However if btc falls below the 950 support level then, next levels of support are 915 and 850(78.6fib level)

BCH stairway to deathBCH has formed a nice and neat stairway channel to a very low area. However the predictability could make it a playable coin. Could be entirely wrong, coin also has a lot of negative vibes surrounding it to keep in mind.

BCC USDT BCH USDT is ready to go with BTC if support holdBitcoin Cash / USDT
Grab the chance now - dont wait too long will go up together with btc if resistance of btc will hold!
BuyZone
Perfect entry now
Target 1
1420
Target 2
1938
Target 3
2350
Time Frame
Midterm / Longterm

BCC/BTCIT SEEMS BCC STARTED A GOOD WAY AFTER A NICE REST
IT SAVE LOT OF ENERGY AND NOW CAN JUMP AT 3TH WAVE

BCHUSD: attempting breakout. Long target 13 %BCH is just under the top of the hour cloud with nice support. We're right underneath a downtrend, a breakout of which will trigger a buy signal and the start of a potential move up to the upper 1300s
Target levels are:
1280
1320
1390
(1390 - 1230) / 1230 * 100 = 13 %
Btw the orange fractal is taken from the current BTC correction.
Happy days!


ITS BOUT TIME FOR BCCBCC BOUT READY.... Anyone else having issues with Fibonacci extention and retracement prices>?
Bitcoin Cash nice oppertunityLooks like BCC can do close to a 100% gain after this correction is done. Such wow. Many gains.

BCH - Massive Inverse Head and Shoulders spotted on the dailyWatch for a reversal on the right shoulder. If the inverse HS target price is hit, we could have a 50% gain. Currently at 30 on the 4-hour RSI and the daily RSI has come down quite a bit.

BITCOIN CASH WILL MAKE IT !Traders,
Here we have BCHUSD on 1D chart.
When I trade a Bull Flag the biggest difference from a Flat Top Breakout is that the consolidation is occurring BELOW the high. So as a Flat Top Breakout consolidates within a few cents of the highs, a Bull Flag experiences typically 2-3 red candles
I set my stop at the low of the flag which is usually pretty close by. This gives me a good risk reward ratio. If I want to double my position on the high of day break and then sell through that spike I can make a little more money. It’s important to be careful not to buy a double top. If we have a big pullback, then squeeze right back to the highs we’ll sometimes see a double top formation, or a U shape on the chart. In the examples below you will see some perfect bull flags, but you will also see some sloppier bull flags. The most important thing is that we trade bull flags on the best here.
Regards,
Mohsen
