#BCH Update #3 – July 31, 2025#BCH Update #3 – July 31, 2025
From a technical standpoint, Bitcoin Cash is currently one of the best rounding coins compared to others, and it hasn't broken its upward channel. It continues to move steadily within the trend.
It recently took support from the midline of the channel and made a move, though this move wasn’t very large — it stayed around a 4-5% profit range. It has now completed its correction, but if it drops back to the bottom of the channel and then rises again, the profit potential would be even higher. At the moment, there’s only about 4% upward space left before it meets the top resistance of the channel.
Bitcoin Cash is currently one of the most technically clean and consistent altcoins. If it pulls back slightly, it might be a better entry, but there’s no issue with entering from this level either. Therefore, I’m opening a 4.5% position here, with a profit expectation of 4.5%.
BCH

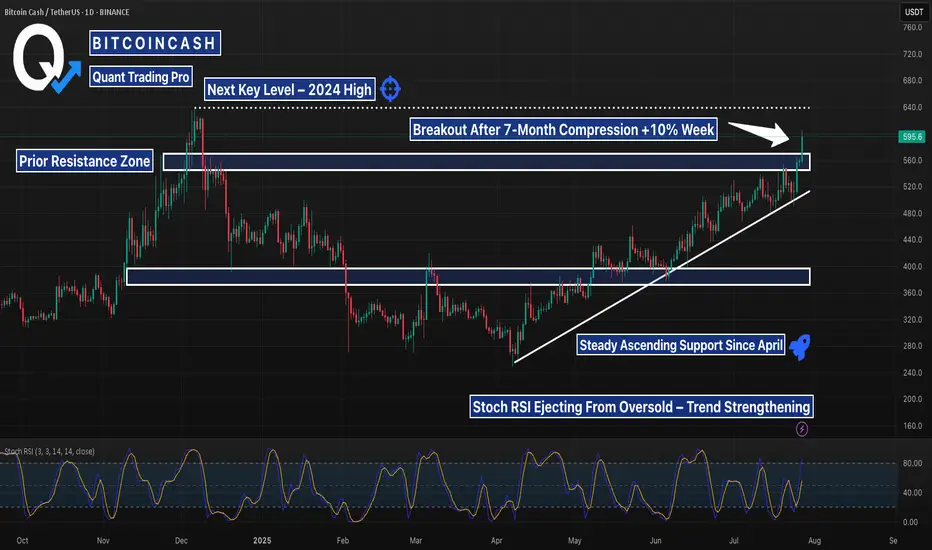
BCH Breaks Out of 7-Month Range — Eyes Set on 2024 HighsBCHUSDT 1D chart shows a clean technical breakout after months of slow grinding structure. Price has officially pushed through the $570–$580 resistance that’s capped upside since December 2023. This move comes on growing volume and renewed interest in BCH across crypto forums and analyst posts, with some calling it a long-overdue move for a top-20 coin.
The prior resistance zone around $430–$470 acted as a major accumulation range — now flipping into solid support. Price is also respecting a long-standing ascending trendline since April, showing consistent higher lows and steady bullish structure.
Stochastic RSI confirms momentum is shifting — pushing out of the mid-zone and suggesting trend continuation. With this breakout confirmed, the next major target sits near $640: the high from late 2024.
If BCH holds this breakout, it may be entering a new expansion phase. Watch for possible retests of $570–580, but structure favors bulls.
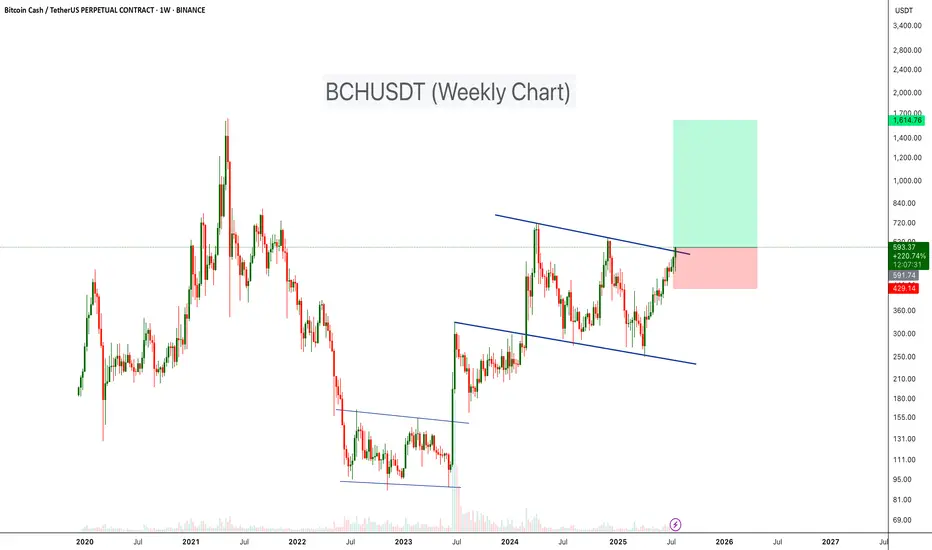
BCHUSDT Bullish ChannelBCH is currently testing the upper resistance of a long-term descending channel on the weekly timeframe, a level that has historically acted as strong resistance. After months of consolidation and a healthy recovery structure, BCH is once again knocking on the door of a major trendline breakout.
The price has steadily recovered from the lows near $250 and is now hovering around $590. A confirmed breakout above this descending trendline could trigger a larger bullish continuation, potentially propelling BCH toward the $1,600–$1,700 zone.
Cheers
Hexa🧘♀️
#BCH Update #2 – July 27, 2025#BCH Update #2 – July 27, 2025
After its last impulsive move, Bitcoin Cash experienced a full retracement. However, it managed to maintain its bullish structure by avoiding a close below its previous low.
At this point, it has reached its target and is still climbing. However, buying from here is a completely risky move. From a technical analysis perspective, Bitcoin Cash has already reached the extent of its potential upside.
Starting from this point forward, I absolutely do not recommend any long positions in Bitcoin Cash. Due to potential profit-taking by whales, a sharp correction is very likely.
I’ll provide updates as the situation develops, but for now, Bitcoin Cash is not in a suitable position for opening long trades. It has reached its target. Therefore, the best action at this stage is to wait.

Bitcoin Cash $2,615 Minimum · $4,178 Possible · Plan Ahead105 days. This is definitely the longest stretch of bullish action since 2021. Bitcoin Cash has been growing non-stop for 105 days.
If someone told you this would be the case some months ago or a few years back you wouldn't believe it. What if someone tells you now that you've seen nothing yet? What if I told you that the best is yet to come? This is only the build-up process. Bitcoin Cash is about to shoot up really strong. It will skew the chart. People won't be able to comprehend what is happening less adapt to the market. It will be chaos, bullish chaos.
Years of consolidation. Bitcoin Cash has been on a wide trading range since February 2024. We can easily say since mid-2023 if we consider using a wider range. This is all the build-up process for this moment now. The 2025 bull market. Predicted years ago, now it cannot be denied, it is right in your face.
Let's play the other side for entertainment's sake. Bitcoin Cash stops rising, either a lower high now or a reversal at the December or April 2024 high. What would happen then? A bear market? No! Just a down-wave, more consolidation before the final advance, price jump and market bull run.
Let's go back to reality for accuracy's sake. Bitcoin Cash will grow in bullish momentum and will break all resistance one next to the other, stops will be short. If there is a correction in-between the action, it won't be long.
Look back to the 2021 bullish wave, the fifth wave; notice three weeks red, two weeks red, one week red, etc., in-between the rising wave. Straight up but obviously, there are some stops. When we are in the experience, when it is happening, these weeks feel like forever and we never know if it will continue rising or if that's it, we reached the end. I am telling you now, it will not be over until a major new all-time high hits, and the levels are being shown now. When we are more advanced in the market cycle, I will not try to predict the short-term. Instead, I will tell you to secure profits and move on. Once prices are really high, close your position and start looking for the ones still trading low near support. Of course, writing this won't change anything, people will still be attracted to the action and mistakes will be the norm. Only if you bought early when prices were low, you will be able to withstand the market pressure. If you buy late, the market will kill you and take everything from you. This is a friendly reminder. Plan ahead.
Namaste.

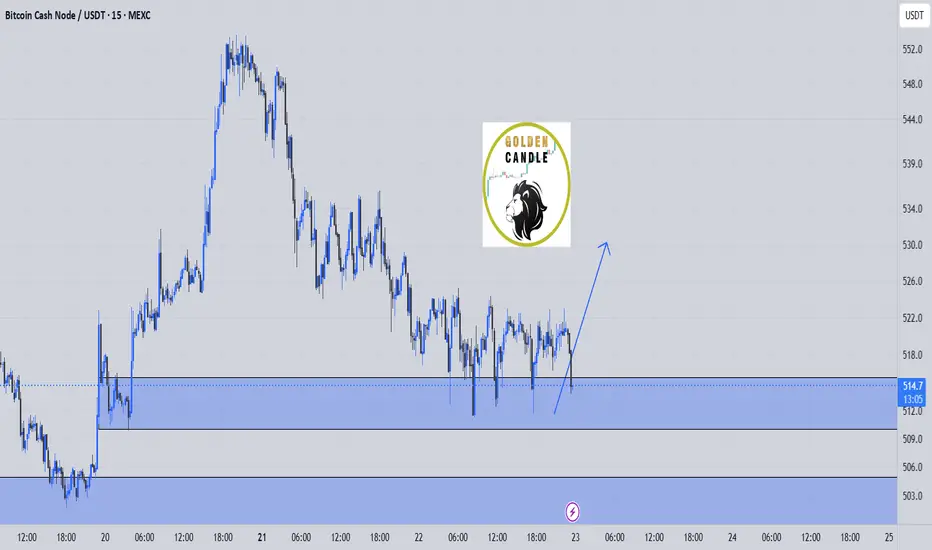
bch buy midterm"🌟 Welcome to Golden Candle! 🌟
We're a team of 📈 passionate traders 📉 who love sharing our 🔍 technical analysis insights 🔎 with the TradingView community. 🌎
Our goal is to provide 💡 valuable perspectives 💡 on market trends and patterns, but 🚫 please note that our analyses are not intended as buy or sell recommendations. 🚫
Instead, they reflect our own 💭 personal attitudes and thoughts. 💭
Follow along and 📚 learn 📚 from our analyses! 📊💡"
#BCH Update #1 – July 15, 2025#BCH Update #1 – July 15, 2025
Bitcoin Cash appears to have completed the correction of its latest impulsive move. The retracement ended at the 0.786 Fibonacci level, which also coincides with the 200 MA — a strong technical support zone.
Given this confluence, I opened a Long position targeting a 5% profit. I am not using a stop-loss because I plan to lower my average entry by adding more from lower levels if needed. Technically, the setup looks favorable for a Long trade at this point.

buy bch midterm"🌟 Welcome to Golden Candle! 🌟
We're a team of 📈 passionate traders 📉 who love sharing our 🔍 technical analysis insights 🔎 with the TradingView community. 🌎
Our goal is to provide 💡 valuable perspectives 💡 on market trends and patterns, but 🚫 please note that our analyses are not intended as buy or sell recommendations. 🚫
Instead, they reflect our own 💭 personal attitudes and thoughts. 💭
Follow along and 📚 learn 📚 from our analyses! 📊💡"

#BCH Update #2 – July 18, 2025#BCH Update #2 – July 18, 2025
Bitcoin Cash completed a correction after its previous impulsive move, but within that correction, a secondary retracement occurred. This brought the price down to the edge of the 200 MA zone. The MA200 acted as strong support and triggered a reaction.
Despite experiencing another minor pullback, the current structure still appears favorable for Long entries. As shown in the chart, a Long position is already open. I haven’t set a stop-loss because I have enough capital to average down if needed.
For those looking to enter, this could be a good opportunity.
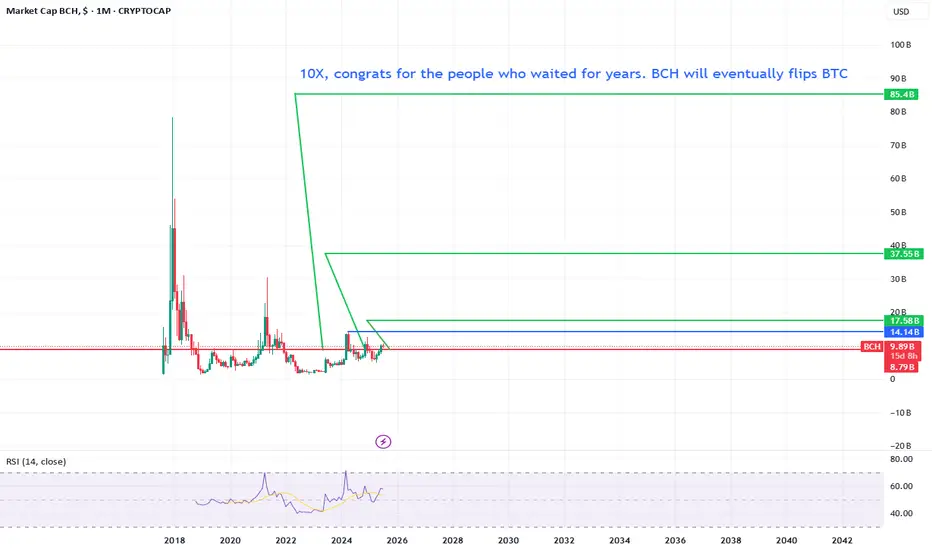
Bitcoin Cash will do a solid 10X For years bitcoin cash is been selling off.
But let me tell you this, we are just getting started.
If we pass the blue line we are officially triggered for a 85 billion marketcap.
Can still take some time but eventually it will happen. Make sure to fomo in when the party is starting!
Bull Market Action Exposed—Bitcoin Cash Growing 91 Days Non-StopWhat we are seeing now is very different compared to the past. If you look at early 2024 the rise was composed of strong big candles, always fast as if in a hurry. Very strong growth. If we go further and consider late 2024, we got a lower high but still very big candles. Fast forward to present day 2025, and we have a perfect uptrend, prices rising week after week after week with relatively small candles, some medium-sized but not as big as before. This is bull market action.
In the past, the candles were really big because the bullish action was soon to end, it wasn't expected to last a long time and thus everything needs to be accomplished fast. Things are different now. The fact that we have slow and steady growth is good news. Since the market is going to be growing for a prolonged period of time, the candles are smaller.
Don't be fooled by current price action, it all ends up in a major bull-run. While the candles are small now you can take it as bullish consolidation. Prices are growing but this is still a sort of accumulation/build-up phase. Everything is building up to a very strong climax with new all-time highs all-across and then some more.
Bitcoin Cash has been growing straight up for 91 days. In June 2023, Bitcoin Cash produced only two weeks green. Back in late 2024 all the growth happened in 28 days. Early 2024 56 days was all that was needed and then the market turned red. This is the longest stretch of continued growth since 2021... Yes, the previous bull market. You are witnessing bull market action.
Thanks a lot for your continued support.
Namaste.

#BCHBTC #1W (Binance) Big falling wedge breakoutCRYPTOCAP:BCH just regained 50MA weekly support in sats, performing better than CRYPTOCAP:BTC
Seems likely to continue bullish towards 200MA resistance, probably after a pull-back.
⚡️⚡️ #BCH/BTC ⚡️⚡️
Exchanges: Binance
Signal Type: Regular (Long)
Amount: 7.0%
Current Price:
0.004885
Entry Targets:
1) 0.004657
Take-Profit Targets:
1) 0.006329
Stop Targets:
1) 0.003987
Published By: @Zblaba
CRYPTOCAP:BCH BINANCE:BCHBTC #BitcoinCash #PoW bitcoincash.org
Risk/Reward= 1:2.5
Expected Profit= +35.9%
Possible Loss= -14.4%
Estimated Gaintime= 4-7 months

Bitcoin Cash: Altcoins Market Bullish Continuation Confirmed!The rise in late 2024, Nov-Dec, lasted only one month. This time the situation is much more different, it confirms what we already know, a major altcoins bull market.
Bitcoin Cash (BCHUSDT) has been growing for 85 days. No strong upthrust with high volatility, but steady growth, the type that exudes strength. At one point there will be a major impulse and this one will be followed by additional growth. What you are seeing is only the start.
Bitcoin Cash helped us predict a continuation of a bullish move for the altcoins several weeks ago. You can reach the same conclusion again. The fact that Bitcoin Cash is bullish now, confirms that the entire altcoins market will continue to grow.
Thank you for reading.
Namaste.

Is #BCH About to Fall or Will it Continue to Rise? Key LevelsYello Paradisers! Have you seen what’s cooking on #BCHUSDT lately? Let’s dive into the latest structure on #BitcoinCash and what may unfold next:
💎#BCH has been trading within a well-respected ascending channel since early April, consistently bouncing between dynamic ascending support and resistance levels. However, the current move into the $500–$505 resistance zone is showing clear signs of momentum exhaustion, as price stalls and volume fades.
💎The strong resistance area between $500 and $505 has rejected price multiple times, and this recent rejection aligns with both the channel resistance and a bearish momentum divergence in volume. Unless #BCHUSD can break and hold above this zone, bulls are fighting a losing battle.
💎The invalidation of the bearish setup lies above $555. Only a confirmed breakout and sustained hold above this level would negate the current bearish structure and open room for a larger bullish expansion. Until then, the risk of a deeper retracement is very real.
💎Currently trading around $490, #BCH looks vulnerable to a drop toward the moderate support zone near $393, with the strong demand zone between $335 and $340 being the high-probability area for a smart-money reaccumulation—if the market flushes weak hands first. This zone also lines up with previous high-volume nodes on the VRVP.
Trade smart, Paradisers. This setup will reward only the disciplined.
MyCryptoParadise
iFeel the success🌴

Bitcoin Cash, Anomaly or Predictive Signal?Some people can say that Bitcoin Cash right now is simply an anomaly, nothing to see here. But a closer look reveals nothing abnormal, more likely a very strong predictive signal that supports what we saw happening with the COIN stock and what was predicted recently to happen with ETHUSDT (Ethereum), that is, a very strong bullish breakout is the next main major market move.
Good morning my fellow Cryptocurrency trader, I hope this day finds you well.
How are you feeling?
Introduction —The market is one
In isolation, the market is tricky and hard to predict. Within a bigger context, we can easily predict what will happen next. Just look at Bitcoin Cash, it shows exactly what will happen because it has been being in perfect syntony with the rest of the market.
Many pairs are consolidating or retracing. My view is that a bullish move comes next.
Let's see how Bitcoin Cash has been behaving lately and compare this to the rest of the market. The fact that it is bullish now predicts that also the other pairs will be bullish because they are moving in the exact same way.
Price action —Past history
A crash ends in early August 2024. By late 2024 the action goes bullish. November 2024 marks the start of a month long advance that ends December 2024. This is true for most of the altcoins market.
The December 2024 peak leads to a correction with the main low happening 3-February. Another low and market bottom happens 7-April 2025. From this point on, we have a recovery and after a high in late May, the market goes into retrace.
Present day
This retrace is where we are today for most of the pairs. 100% of these are trading within a higher low compared to 7-April. Here BCHUSDT ended its retrace and moved ahead of the pack to hit a higher high compared to May. It also produced the highest price since January 2025.
The future
This is not an anomaly. Bitcoin Cash's price action simply reveals what is coming to the rest of the market. As it moved in perfect synchrony with other projects for months or even years, it will continue to do the same. The fact that it is trading higher now, means the other pairs will follow, in fact, some other pairs are already there; a bullish continuation.
Soon everything will grow.
Thank you for reading.
Namaste.

Bitcoin Cash BCH price analysisMore than 3 months have passed since the publication of the previous idea for #BCH, and the price itself has shown an increase of +40%
◆ Slowly but surely growing
◆ Does not react to the price fall CRYPTOCAP:BTC (for those who don't know, #BCH is the first CRYPTOCAP:BTC fork and probably the only one that survived. Then there were 8-10 more of them in 2017-2018... but hey...)
◆ It has been moving in its own direction for more than a year, when OKX:BCHUSDT is cheaper than $300, it is actively bought back by someone.
We have slightly revised the growth target for #BitcoinCash, but why not consider this asset as a long-term investment from $350-400 to $900 and $1250
_____________________
Did you like our analysis? Leave a comment, like, and follow to get more

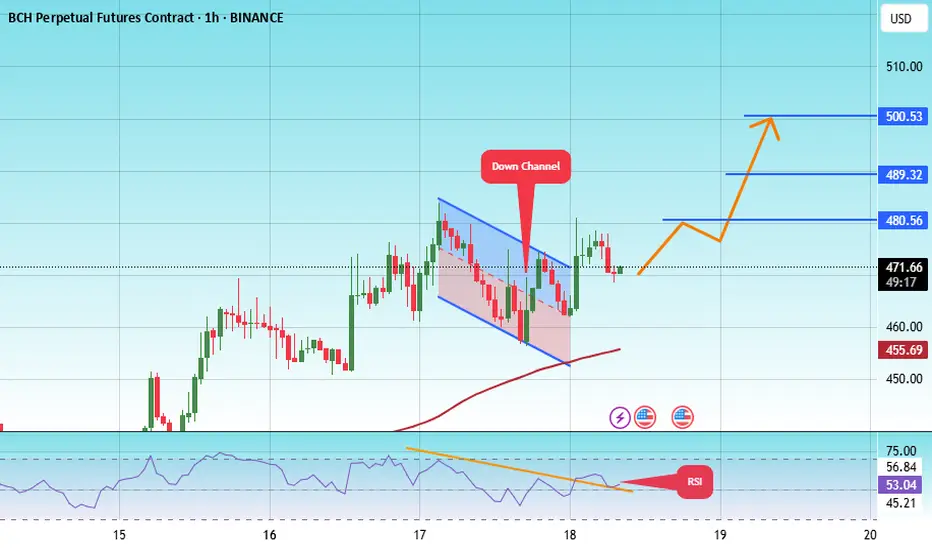
#BCH/USDT#BCH
The price is moving within a descending channel on the 1-hour frame, adhering well to it, and is heading for a strong breakout and retest.
We are experiencing a rebound from the lower boundary of the descending channel. This support is at 456.
We are experiencing a downtrend on the RSI indicator, which is about to break and retest, supporting the upward trend.
We are heading for stability above the 100 moving average.
Entry price: 471
First target: 480
Second target: 489
Third target: 500
Bitcoin Cash Nears $485—Will BCH Hold Its Gains? FenzoFx—Bitcoin Cash remains bullish, nearing the previous monthly high at $485.0, though overbought conditions signal possible consolidation.
BCH/USD may stabilize around $431.0 before resuming its uptrend toward $485.0. A break above this level could pave the way for $568.0.
The bullish outlook holds as long as BCH stays above $349.0.

Bitcoin Cash Weekly Update, Moving Averages & Bullish PotentialI already looked at Bitcoin Cash recently, this time I want to see how the moving averages are doing here to compare with the other Crypto-projects. Good news for one pair is good news for other projects as well specially when they are in the same category. Bitcoin Cash is one of the big projects.
Here we can see BCHUSDT trading weekly above EMA34, EMA89 and MA200, while rising.
Resistance was found at $453, a fib. extension level. Once this level is broken as resistance you can expect a swift advance toward $680. It will be nice and easy. This is the last barrier and current price action is kind of mix.
It is good because this week trades at the highest since November 2024 coming from a low. It is bad because it is lower compared to 19-May on the wick but the week is yet to close.
A weekly close above $420 is highly desirable and favors the bulls, anything lower and we continue with a mixed situation. Make no mistake, the situation is mixed only short-term. The chart shows a clear bullish bias and there will be additional growth in the coming weeks and months. Only the short-term is questionable.
Bitcoin Cash, Bitcoin and the entire Cryptocurrency market is set to grow.
Thanks a lot for your continued support.
Namaste.

Bitcoin Cash Early Recovery & Bullish ContinuationToday's candle says it all. Bitcoin Cash moved to hit a low of $397, today, and the same session now trades at $449, the highest price since 23-May which was the date that produced the highest price since January 2025. This is an early recovery signal.
This signal is good and great but it needs one final bit to be confirmed, and that is a continuation tomorrow. The week is about to end and the close is what determines the next move. If the action closes above the 23-May high, $462, then ultra-bullish confirmed. If the session closes below then there is still room for some more shakeouts, retraces and corrections. But the early recovery signal is in. What one does, the rest follows.
Now, not all pairs will move in the same way. Some will continue lower, retrace, while some others produce an early recovery and move ahead.
Today's session is just too strong, we can easily say that Bitcoin Cash is ready to resume its bullish wave of growth. $684 next target, followed by additional growth.
Thanks a lot for your continued support.
Namaste.

BCH/USD Consolidates Eying $461.9FenzoFx—BCH (Bitcoin Cash) paused its uptrend near $448.1, a low-volume zone, suggesting the rally may resume after consolidation.
Technical indicators show overbought conditions, increasing the likelihood of a short-term dip. BCH/USD may consolidate near $430.0 before aiming for the next target at $461.0.

Everything Bitcoin Cash Points To a New ATH; $2,600 or $4,150?Bitcoin Cash is bullish, ready to grow within the bullish zone. There is zero doubt. I think it will be hard to know if the peak will happen around $2,600 or $4,150. There is a huge difference.
Knowing how erratic BCH has been in the past, we have to go with the second higher target; what do you think?
It is hard to say but we have two targets mainly for late 2025. There is no doubt that we will get a new all-time high we just don't know how high.
I will go with the second one just in case. Say this bull market top for Bitcoin Cash will reach somewhere around $4,000. Can be more or less.
You can leave a comment with your number.
How far up do you think Bitcoin Cash will go?
And remember, the bullish bias is already confirmed. Everything points up. The chart, the indicators, the patterns, the signals, the overall market, everything... Thank you for your continued support.
If you enjoy the content make sure to follow.
Namaste.

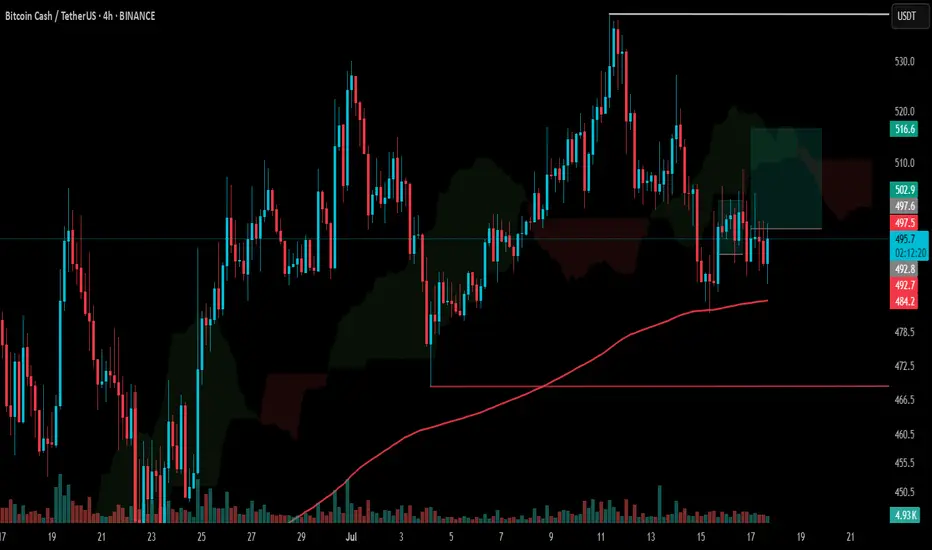
BCH Analysis for Scalpers (1H)Bitcoin Cash (BCH) is currently showing multiple technical signals that support a potential bullish continuation.
A reversed Head and Shoulders pattern is in the process of forming, and it aligns well with several key confluences — including the Ichimoku Cloud and volume profile support zones.
A breakout above the $430 level would not only confirm the pattern but also activate a bullish flag formation, adding further momentum to the setup. In that case, the next immediate target would be around $452.4.
This setup remains valid only upon confirmation of the breakout. Until then, caution is advised — a clean break and retest would offer the most favorable entry.
— Thanks for reading.
