🔥 BCH Break Out: Bullish Momentum Returns After 6 MonthsBCH has been trading in a bearish pattern for almost 6 months. However, with BTC making a new all time high today, BCH has finally broken out through the resistance line and is moving up quickly.
I'm looking at the $650 resistance to be broken before being 100% bullish. First major target is placed at $800.
Happy trading!
BCH

BCH/USD- Day trade Hello,
I have entered #BCH on a hourly day trade today. I entered at 622.65 with the target being $649.
This will be a 4.2% gain if target is reached.
The reason for this trade-
The price has broke above the hourly resistance and the H4 resistance. The momentum should help push the price up while being above the 9/20ma.
Good luck if you join.

BCH Price StandpointBitcoin Cash is holding steady above the support level of 600 as the bulls strive to retest the weekend’s high of 650. Since the beginning of the month, it has risen by about 22% having extended its rebound from below the psychological level of 500 late in September.
On a four-hour chart, it is trading slightly above the 25 and 50-day exponential moving averages. Besides, the formation of an inverted head-and-shoulder pattern, which is a bullish pattern, points to further gains.
In the short term, BCH price will likely hold steady above the support zone at 600 while gathering enough bullish momentum to reach and surpass the next target at 650.91. Above that zone, the next level to watch out for will be the prior resistance level at 675.61. However, this thesis will be invalidated by a move below the support zone of 600.

BCH ready to blast, probably parabolic really coming soon!! Technical analysis: #BitcoinCash (Daily update)
. Symmetrical Triangle Upside Breakout ✅
. BTCUSDT is breakout confirmation done as well as trading above the both MA's (21 & 50-
Day MA), and the beginning of parabolic uptrend is expected.
. The RSI is also TRYING to breakout its downtrend, if it could happen which give momentum bch from here.
. Golden cross could happen very soon that's means bulls are in full control the market.
Take Profits:
TP1= @ $809.5
TP2= @ $1176.4
TP3= @ $1649.6
TP4= @ $2282 and then it could really more then $5000
SL= below 500 usdt on daily closed bases
🥰If you find this helpful and want more FREE forecasts in Tradingview😍.
Please show your support back🙏,
Hit the 👍 LIKE button,
Drop some feedback below in the comment✍️!
❤️🤝 Your Support is very much 🙏 appreciated!❤️🤝
💎 Want me to help you become a better Crypto trader?
Now, It's your turn!
Be sure to leave a comment; let me know how you see this opportunity and forecast.
Trade well, 💪
#bitcoincash #crypto #nextmove #bullmarket #dailyclosed

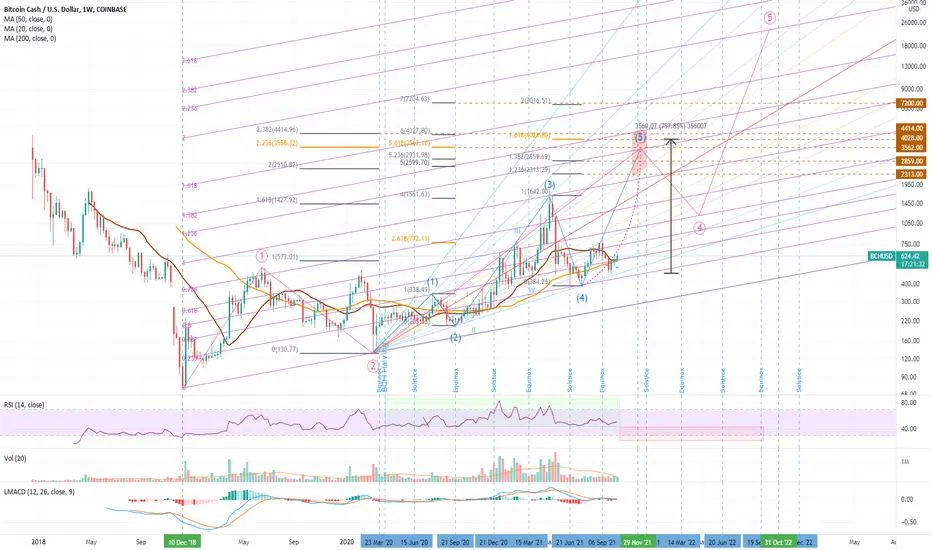
Bitcoin Cash (BCH) - Structure and TargetsI present a study in BCH, using the weekly log chart.
Some structure with a rising Channel and Pitch Fan (wedge) overlay is observed with an Elliott Wave count applied demonstrating potential for new highs. A number of Fibonacci Projections are applied to align some possible price targets.
Do you think we are about to drop through the floor, or rally to a higher-high? Let me know in the comments.
Bitcoin Supercycle?This chart assumes that FED currency debasement continues to unfold and Bitcoin has massive inflows.
$100k - 2021 local top in these months? Maybe.
$1Million - ATH this cycle by early 2022 or late 2021.
$5-10 Million- Expected prices After next 2024 halving.

Bch to the moonWell bch to the moon NFA!!!!
Dyor !!!!
Tp my dotted line
Stay safe guys and trade wisely

Bitcoin Cash Medium Term Investment/TradeThe cryptocurrency has broken out from the triangle pattern, and as Bitcoin has already broken out and is nearing its all time high. It could be a good idea to go long on Large Cryptocurrencies Including BCH.
Risk Reward Ratio - 2:1
Target Price is place near future resistances, while Stop Loss is placed below major supports and previously lower trendline.


BCHUSDT Daily TimeframeSNIPER STRATEGY (new version)
It works ALMOST ON ANY CHART.
It produces Weak, Medium and Strong signals based on consisting elements.
NOT ALL TARGETS CAN BE ACHIEVED, let's make that clear.
TARGETS OR ENTRY PRICES ARE STRONG SUPPORT AND RESISTANCE LEVELS SO THEY CAN ACT LIKE PIVOT POINTS AND REVERSE THE WAVE (or act like a mirror that can reflects light) BASED ON STRENGTH OF THAT LEVEL.
ENTRY PRICE BLACK COLOR
MOST PROBABLE SCENARIOS TARGETS GREEN COLOR
LEAST PROBABLE SCENARIOS TARGETS RED COLOR
TARGETS ARE NOT EXACT NUMBERS THEY ARE MORE LIKE A ZONE.
DO NOT USE THIS STROTEGY FOR LEVERAGED TRADING.
It will not give you the whole wave like any other strategy out there but it will give you a huge part of the wave.
The BEST TIMEFRAMES for this strategy are Daily, Weekly and Monthly however it can work on any timeframe.
Consider those points and you will have a huge advantage in the market.
There is a lot more about this strategy.
It can predict possible target and also give you almost exact buy or sell time on the spot.
I am developing it even more so stay tuned and start to follow me for more signals and forecasts.
START BELIEVING AND GOOD LUCK
HADIMOZAYAN

✅BCHUSDT It did like we said yesterday!BYBIT:BCHUSDT
-
Congrats guys! If you've been following the analysis and trading strategy as below.
Price already hit TP1!
As usual, don't forget to take some part of unrealized profit, do not miss you already gain!
Next, could hold it till TP2, and I'll update further TP later.
Keep following us!
-
If you like this analysis, give it a like and leave a comment below to share your perspective
or let me know what crypto you want to see!
Trading is a reflection of yourself. Learn more daily and be ready for every opportunity.
Have a nice trading!

BCH retested with bullish engulfing in 4hIn BCHUSDT 4h
It retested the long term downtrend and rebounded with bullish engulfing .
It means confirmation of the support to me .
If it could breakout the blue downtrend and consolidation area
SL:576.7
TP1:681.7
TP2:699.9
TP3:738.9
TP4:802.1

BCHUSDT keeps Converging and timing to open!/Trading strategy BYBIT:BCHUSDT
1H trend chart
-
BCH has been consolidating in a convergence formation for a while.
We could notice there is a double pattern formed, and its neckline becomes a short-term support zone.
If price can break out the upper downtrend line , it's time to entry, and trading strategy as below.
-
Profit Targets:
a) 618.45----Fib(1)
b) 632.3~637.95----Fib(1.272~1.382)
c) 669.45-----Fib(2)
Stop losses:
a) I'll set up if the downtrend line are taken out around here.
-
If you like this analysis, give it a like and leave a comment below to share your perspective
or let me know what crypto you want to see!
Trading is a reflection of yourself. Learn more daily and be ready for every opportunity.
Have a nice trading!

BCHUSD LONGBCH is a great asset that has really seen a high price to a support level of 1644.33. After a downtrend, BCH had another bull run from 398.57 to 813.82. This has displayed the continuous power of buyers than sellers.
As prices approaches the 813.82 resistance level, will it be up for another bull run? Tell me what you think below

BCHUSDT Technical Analysis
⏳ Spot
💎 BCHUSDT has been making HHs and Hls in the ascending channel. Right now the price is at a very significant resistance and if it breaks above the resistance it could go much higher from where it is now.
🌐 Tradingview
🏁 Short & Medium Term
💵 Invest Only 5% of your Portfolio
🎳 Entry at Market or at 596.0
☕️ TP1 638.0
🍺 TP2 674.0
🍻 TP3 720.0
🍾 TP4 783.0
🍷 TP5 830.0
🍸 TP6 _____
🍹 TP7 _____
🎁 TP8 _____
🚫 SL 575.0
Good Luck 🎲
Check the Links in Description and If you LIKE this analysis, Please support our page and Ideas by hitting the LIKE 👍 button. ❤️ Your Support is really appreciated! ❤️
Traders, if you have your own opinion about it, please write your own in the comment box. We will be glad for this.
Feel free to request any pair/instrument analysis or ask any questions in the comment section below.
We will have more FREE forecasts in TradingView soon
Have a Profitable Day

💡Don't miss the great buy opportunity in BCHUSD
Trading suggestion:
". There is a possibility of temporary retracement to the suggested support line (596.1).
. if so, traders can set orders based on Price Action and expect to reach short-term targets."
Technical analysis:
. BCHUSD is in a range bound, and the beginning of an uptrend is expected.
. The price is above the 21-Day WEMA, which acts as a dynamic support.
. The RSI is at 53
Take Profits:
TP1= @ 628.3
TP2= @ 680.0
TP3= @ 722.8
TP4= @ 787.9
TP5= @ 833.2
SL= Break below S2
❤️ If you find this helpful and want more FREE forecasts in TradingView
. . . . . Please show your support back,
. . . . . . . . Hit the 👍 LIKE button,
. . . . . . . . . . Drop some feedback below in the comment!
❤️ Your support is very much 🙏 appreciated!❤️
💎 Want us to help you become a better Forex / Crypto trader?
Now, It's your turn!
Be sure to leave a comment; let us know how you see this opportunity and forecast.
Trade well, ❤️
ForecastCity English Support Team ❤️

BCHUSDT a Cup and Handle is forming?/Trading StrategyBYBIT:BCHUSDT
4H trend chart
-
Price has build a Cup pattern, and there is a potential handle in 4H chart.
If price can break out Fib(1) which is 625.85 and stand firm on it, the handle will be completed.
The cup and handle pattern is a bullish signal, so our trading strategy as below.
*Notice the pink zone, which is long-term resistance, probably give pressure on price, even there is a C&H pattern.
-
Profit Targets:
a) 651.7~662.1----Fib(1.272~1.382)
b) 684.55----Fib(1.618)
c) 720.8-----Fib(2)
Stop losses:
a) 588----Red horizontal ray
b) 600.5----Red horizontal ray(for those who don't wanna take more risks)
-
If you like this analysis, give it a like and leave a comment below to share your perspective or let me know what crypto you want to see!
Trading is a reflection of yourself. Learn more daily and be ready for every opportunity.
Have a nice trading!

BCH broke out resistance#BCHUSDT
$BCH broke out from long term descending resistance, and it is trading above support zone, next resistance is around $700, and a successful break above $700 will reach #BCH to $900.

BCH-rakshith analysis chartFor everyday learning. I am trying to plot the trend lines and trying to apply technical analysis. Hope I learn analysis soon. Please guide if anybody want to give any suggestion.

BCH/USDT looks fantastic for 2xSummary,
1. BCH seems to have completed re-test.
2. When BTC begins ranging, BCH has 2x potential heading to center median line of the pitchfork.


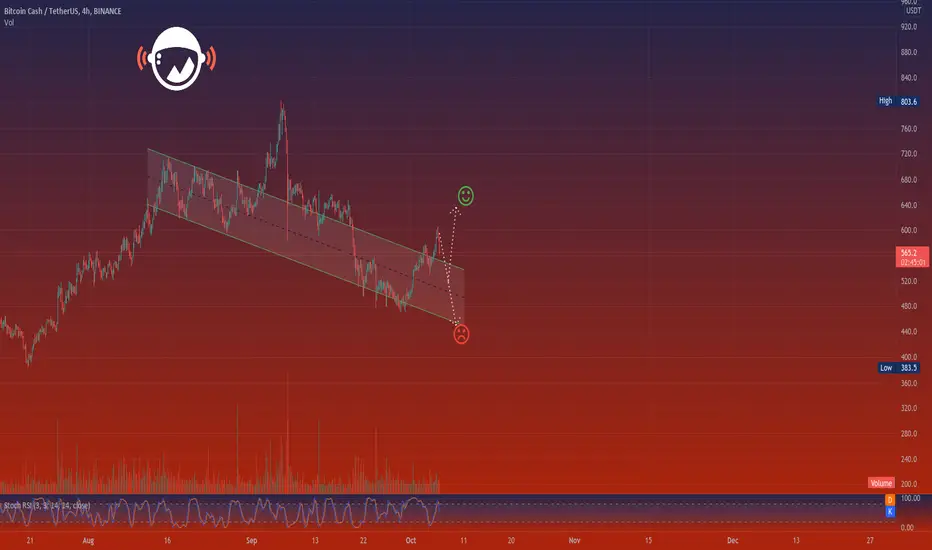
BCHUSDTHello Crypto Lovers,
Mars Signals team wishes you high profits.
We are in a 4-hour time frame.
As you see, the price has gone out of the channel several times and has entered into the channel again.
At the moment, we believe that the price will be able to enter into the channel again and go to the bottom of the channel, if it is not supported.
We have to wait to see which way the price wants to move.
Warning: This is just a suggestion and we do not guarantee profits. We advise you analyze the chart before opening any position.
Wish you luck
BCH 200% pumping SOONit can be happen after the bitcoin back to 62K level then We can see the 2800 & 4400 Targets from Bch
